Canada

by David Klemt David Klemt No Comments

Ontario Updates Employment Standards Act

Ontario Updates Employment Standards Act

by David Klemt

Daytime photo of the Toronto, Ontario, Canada, skyline

Yesterday, Ontario, Canada’s government tabled updates to the province’s Employment Standards Act meant largely to protect restaurant and hospitality workers.

These explicit protections are known as Bill 79, Working for Workers Four Act, 2023.

Interestingly and timely, the updates seem to be, at least in part, a direct response to technological developments.

For example, Bill 79 addresses digital payment apps and artificial intelligence. I’ll expand on that below.

These updates certainly appear to have been drawn up to protect restaurant workers specifically, and hospitality professionals overall.

An End to Unpaid Trial Shifts

One of the most significant updates addresses hours and pay.

It likely shouldn’t have to be said but, according to Ontario law, an employee must be paid for all the hours they work. This includes trial shifts.

Specifically, the new legislation expressly prohibits unpaid trial shifts.

Pooling Tips

Employers in Ontario are well within their rights to share in pooled tips. That is, if the employer is performing the same tasks as staff.

However, there’s now an update to this practice within the Employment Standards Act.

If any employer intends to share in a tip pool, they must make this clear and inform staff.

Speaking of Tips…

For the most part, digital payment platforms bring with them transaction fees. This includes fees for restaurant workers to get their tips.

“We’re seeing apps that are taking a cut every time…a worker accesses their tips, and that’s not acceptable,” says Piccini.

So, moving forward, employees who are paid tips via direct deposit will have more control. The updates to the Employment Standards Act now state that employees paid this way can choose where their tips will be deposited.

Deducting Wages

Per multiple studies, one in 20 diners has dined and dashed. Apparently, it has been common practice for some employers to deduct wages in response.

Personally, I think it’s ridiculous for any employers to pass a business loss on to their workers. That’s neither good leadership, ethical, or a healthy work culture. I’m not saying I’m surprised it happens; I’m disgusted that it still happens.

Now, the practice of penalizing employees monetarily for guests dining and dashing is prohibited specifically. Will that stop it from happening? Probably not, although perhaps it will happen much less moving forward.

This also includes language that makes it illegal to deduct pay from employees due to customer “gassing and dashing.” For anyone wondering, gas theft affected Ontario businesses to the tune of $3 million CAD in 2022.

Artificial Intelligence

Some employers, as many job hunters are aware, use artificial intelligence during the hiring process.

Now, these employers will have to disclose their use of AI in job listings. In theory, this update addresses privacy and data collection concerns.

Further, job listings will now have to include salary ranges. Also, employers are now prohibited from requiring work Canadian work experience in their job listings or on their application forms.

To review Bill 79 in its entirety, click here.

Image: mkdrone_ on Unsplash

Bar Nightclub Pub Brewery Operations Standard Operating Procedures SOP

by David Klemt David Klemt No Comments

Indies in the US & Canada: The Numbers

Independents in the US & Canada: The Numbers

by David Klemt

Canadian and America flags flying together

Operators who wonder how many independent restaurants there are throughout America and Canada finally have their answer thanks to Datassential.

The well-known food and beverage research and intelligence platform’s recent infographic reveals the state of indies in both countries.

For the purposes of their infographic, Datassential splits restaurants into two overarching categories. One major category is full-service restaurants, the other is limited-service.

From there, the platform organizes restaurants into five segments: casual, QSR, midscale, fast casual, and fine dining.

To my understanding, QSR and fast casual fall under Datassential’s limited-service designation. Casual, midscale, and fine dining are full-service restaurants.

To review the infographic yourself, please click here.

Number of Indie Restaurants: America

According to Datassential, there are 483,885 independent restaurants in the US.

Of those restaurants, 57 percent are full-service. It follows, then, that 43 percent are limited-service.

Close to half—44 percent—of full-service restaurants in the US boast more than five years of being open. Just a quarter of limited-service restaurants (26 percent) can claim the same.

This does, anecdotally, make some sense. QSRs and fast-casual brands have been on the rise over the past couple of years. In fact, some casual chains are developing and launching QSR brands off the strength of the category.

Finally, 21 percent of full-service restaurants in the US see annual sales under $500,000. That number climbs to 27 percent for limited-service restaurants.

Now, let’s take a look at independent restaurants in Canada.

Number of Indie Restaurants: Canada

Per Datassential, there are a total of 59,914 independent restaurants throughout Canada.

The split between full-service restaurants and limited-service restaurants is just about even. Fifty-one percent of indie restaurants in Canada are full-service. Forty-nine percent are limited-service operations.

A little under 40 percent of full-service independent restaurants in Canada (36 percent) can say they’ve been operating for more than five years. That number is 28 percent for limited-service restaurants.

Interestingly, just five percent of independent full-service restaurants in Canada bring in less than $500,000 in sales annually. That number jumps to 34 percent when we look at the limited-service category.

Indie Restaurants by Segment

The breakdown of the five Datassential independent restaurant categories is the same for America and Canada.

Most independent restaurants in either country are casual. Following, in descending order of number of restaurants, are QSR, midscale, fast casual, and fine dining.

For America, the numbers are as follows:

  • Casual: 37 percent
  • QSR: 34 percent
  • Midscale: 19 percent
  • Fast casual: 9 percent
  • Fine dining: 1 percent

And for Canada the breakdown is nearly identical:

  • Casual: 37 percent
  • QSR: 30 percent
  • Midscale: 18 percent
  • Fast casual: 14 percent
  • Fine dining: 1 percent

There are eight times as many independent restaurants in America as there are in Canada. But as you can see, the industry segmentation by country is nearly the same.

Future independent operators can look at this information a few different ways. They can choose to join the most popular segments and differentiate themselves from the competition. They can look for and fill a need for an indie fast-casual or fine-dining concept. Or they can shoot for the middle and go midscale, a segment that’s gaining traction across several hospitality industry sectors.

For you own copy of Datassential’s infographic, follow this link.

Image: chris robert on Unsplash

KRG Hospitality. Restaurant Business Plan. Feasibility Study. Concept. Branding. Consultant. Start-Up.

by David Klemt David Klemt No Comments

Canada’s Single-use Plastics Ban

How Canada’s Single-use Plastics Ban Affects Operators

by David Klemt

Single-use plastic straws and utensils

With a few exceptions, Canada’s ban on the manufacture, importation, and sale of single-use plastics is now officially in effect.

However, that doesn’t mean restaurant and bar operators need to worry about current inventories just yet. While the Single-use Plastics Prohibition Regulations are in effect, operators have a year to deplete their stocks.

SUPPR is a crucial element of Canada’s overall plan to combat pollution and reach a goal of zero plastic waste by 2030. The single-use plastics ban was announced in June of this year.

“We promised Canadians we would deliver a ban on single-use plastics. Today, that’s exactly what we’ve done,” said Minister of Environment and Climate Change Steven Guilbeault the day SUPPR was announced. “By the end of the year, you won’t be able to manufacture or import these harmful plastics. After that, businesses will begin offering the sustainable solutions Canadians want, whether that’s paper straws or reusable bags. With these new regulations, we’re taking a historic step forward in reducing plastic pollution, and keeping our communities and the places we love clean.

Now, six months later, it’s the law of the land.

What’s Banned?

Essentially, Canadian operators must evaluate everything they use for delivery and takeout or pickup. If any items are single-use plastic, they must be gone by December 2023.

Per SUPPR, the manufacture, importation, and sale of the following is prohibited:

  • Checkout bags designed to carry purchased goods from a business and typically given to a customer at the retail point of sale.
  • Cutlery includes:
    • knives
    • forks
    • spoons
    • sporks
    • chopsticks
  • Foodservice ware designed for serving or transporting food or beverage that is ready to be consumed, and that:
    • contains
      • expanded polystyrene foam
      • extruded polystyrene foam
      • polyvinyl chloride
      • carbon black
      • an oxo-degradable plastic
    • are limited to the following items
      • clamshell containers
      • lidded containers
      • boxes
      • cups
      • plates
      • bowls
  • Ring carriers are flexible and designed to surround beverage containers in order to carry them together.
  • Stir sticks designed to stir or mix beverages, or to prevent a beverage from spilling from the lid of its container.
  • Straws include:
    • straight drinking straws, and
    • flexible straws, which have a corrugated section that allows the straw to bend, packaged with beverage containers (juice boxes and pouches)

For accuracy, the above comes from the Government of Canada website directly, unedited.

What does this mean for Operators?

Again, operators in Canada don’t need to toss their current stock of the above items.

However, Restaurants Canada does recommend that operators contact suppliers and customers if they import, export, or sell prohibited items currently.

The single most important thing for operators to do now is research single-use plastic alternatives. Items need testing as changes will affect F&B items and the guest experience.

Of course, it’s possible an operator’s current supplier already offers alternatives to single-use plastics. That could prove convenient but costs, supply chain reliability, and impact on menu items need careful consideration.

Sustainability and responsible practices are no longer just conversation topics within the industry. As of this week, in Canada, they’re the only way forward.

Image: Volodymyr Hryshchenko on Unsplash

by David Klemt David Klemt No Comments

Canada’s Top 2022 DoorDash Orders

Canada’s Top 2022 DoorDash Orders

by David Klemt

Burgers, French fries and milkshakes

Operators curious about the most popular delivery items in 2022 will be happy to learn that DoorDash’s year-end report is ready for viewing.

Those who want to compare it to predictions from several sources earlier this year can click here. The DoorDash Canada report can also be compared to consumer trends in Canada revealed back in October.

Before we jump in, I’m not detailing the DoorDash report in its entirety here. To review the entire report, please click here.

Instead, I’ll be sharing the top takeaways in terms of top menu items; top cuisines; and top items by province.

Speaking of provinces, a word to New Brunswick, Newfoundland and Labrador, Northwest Territories, Nova Scotia, Nunavut, Prince Edward Island, and the Yukon. Please don’t break out the pitchforks and come for me for not including you in this article. DoorDash’s report only covers data from six provinces—I didn’t leave you out intentionally.

Top DoorDash Cuisines in Canada

  1. American
  2. Mexican
  3. Japanese
  4. Thai
  5. Mediterranean
  6. Indian
  7. Chinese
  8. Italian
  9. Korean
  10. Filipino

Top DoorDash Items in Canada

  1. Burgers & Fries
  2. Fried Chicken
  3. Poutine
  4. Sushi Rolls
  5. Chicken Wings
  6. Burritos
  7. Chicken Rice Bowl
  8. Shawarma Wraps
  9. Curry
  10. Pad Thai

I think there’s one key takeaway that stands out in regards to this list. Notably, it appears that while chicken isn’t number one, it’s undeniably popular amongst Canadian DoorDash users.

In fact, according to DoorDash data, chicken reigns supreme in British Columbia. When you reach the province-specific sections below, you’ll see how powerful the cravings in BC are for chicken.

Top DoorDash Late-night Items

Again, chicken rules the DoorDash roost in this category.

  1. Chicken Nuggets
  2. Fries
  3. Poutine
  4. Chicken Wings
  5. Chicken Burgers
  6. Apple Pie
  7. Cheeseburger
  8. Spinach & Cheese Dip
  9. Chocolate Fudge Sundae
  10. Crispy Chicken

Top DoorDash Items: British Columbia

  1. Burrito Bowl
  2. Szechuan Chicken Lettuce Wraps
  3. Butter Chicken
  4. California Roll
  5. Crispy Chicken Sandwich
  6. Tofu Bowl
  7. Chocolate Chip Cookies

Top DoorDash Items: Ontario

  1. Cheeseburger
  2. Coffee
  3. Burrito Bowls
  4. Chicken Shawarma
  5. Crispy Chicken
  6. Bagels
  7. Pad Thai
  8. Beef Patty
  9. Pizza
  10. Onion Rings

Top DoorDash Items:Alberta

  1. Spinach and Cheese Dip
  2. Chicken Cheddar Sandwich
  3. Chilli Chicken
  4. Kale Salad
  5. Margarita Pizza
  6. Hot Apple Turnover

Top DoorDash Items: Québec

  1. Poutine
  2. Cappuccino
  3. Pad Thai
  4. Steak and Cheese
  5. Croissant
  6. Dumplings
  7. Chips
  8. Tacos

Top DoorDash Items: Saskatchewan

Interestingly, a beverage item holds the top spot in Saskatchewan.

  1. Bubble Tea
  2. Pepperoni Pizza
  3. Pork Bun
  4. Crispy Pork
  5. Garlic Bread
  6. Pasta

Top DoorDash Items: Manitoba

  1. Fries
  2. Butter Chicken
  3. Red Velvet Cake
  4. Poke Bowl
  5. Shawarma Wrap

As I stated in Wednesday’s article detailing Grubhub and Uber Eats’ reports for the US, we believe operators should take as much control over their restaurants and bars as possible. At KRG Hospitality, that means implementing direct delivery if it makes sense: ease of use, delivery capabilities, favorable costs, etc.

It’s also helpful to know what consumers in your area are craving and ordering. Such information can provide a useful baseline for many concepts’ menu development.

Image: John Fornander on Unsplash

by David Klemt David Klemt No Comments

These are the Happiest Provinces in Canada

These are the Happiest Provinces in Canada

by David Klemt

Newfoundland and Labrador during daytime

If you’re wondering which province in Canada is the happiest, Statistics Canada has the answer—and the happiest may surprise you.

Of course, those who live and work in the happiest province won’t find it shocking. After all, they’re largely happy to be there.

However, if you expect the happiest province to be the home of Toronto, Vancouver, Montreal or Canada… Well, you’re in for a surprise.

Earlier this week we took a look at the happiest cities and states in America. Congratulations Fremont, California, and Hawaii, respectively. To learn where 181 other cities and 49 states rank, please click here.

The Happiness Survey

Or more accurately, the “life satisfaction” survey. For this survey, that’s what Statistics Canada reveals: life satisfaction.

Interestingly, the survey is very simple. Apparently, Statistics Canada simply asked participants to rate the satisfaction of living in their province, zero through ten. For this survey, zero is least satisfied, ten is most.

Ages 15 through 75 (and older) were able to participate. The survey was also broken down to gauge the satisfaction of men and women.

Before we jump into the breakdown of province satisfaction or happiness, some good news. Reviewing the Statistics Canada data, most participants across all age groups are happy. In fact, age groups 65 to 74 and 75-plus appear to be happiest.

On the other side, ages 15 to 54 had the most people who rated their life satisfaction between zero and five. Even so, just over 20 percent of survey respondents rated their satisfaction a five or less.

So, on the whole, Canadians seem satisfied or happy with their lives, regardless of the province in which they live. Personally, I find that to be great news.

The Happiest Province

Okay, let’s dive into the reason you’re here: to learn which province is the happiest.

  1. Newfoundland and Labrador
  2. Prince Edward Island
  3. Quebec
  4. New Brunswick
  5. Manitoba
  6. Alberta
  7. Saskatchewa
  8. Nova Scotia
  9. Ontario
  10. British Columbia

The above rankings are determined by the percentage of survey respondents who rated their life satisfaction eight, nine or ten. So, if you’re in Newfoundland and Labrador, Prince Edward Island or Quebec, wow—you’re apparently one incredibly happy person.

Conversely, below you’ll find the rankings as determined by the largest percentage of respondents who rated their satisfaction a five or lower. As you’ll find, the list below isn’t simply the inverse of the one above.

  1. Ontario
  2. British Columbia
  3. New Brunswick
  4. Alberta
  5. Nova Scotia
  6. Prince Edward Island
  7. Manitoba
  8. Saskatchewa
  9. Quebec
  10. Newfoundland and Labrador

As far as Canada overall, the results of this particular survey are positive. Just 19.4 percent of survey respondents rated their satisfaction or happiness zero through five. And only 28.9 percent provided a rating of six or seven.

More than half of Canadians, 51.7 percent, rate their lives an eight, nine or ten. That’s some great and welcome news.

Image: Erik Mclean on Unsplash

by David Klemt David Klemt No Comments

Menus in Canada: Who Wants What Items?

Menus in Canada: Who Wants What Items?

by David Klemt

Bar and restaurant food and drink menus

Nobody has a crystal ball telling them what they should put on their menus to boost traffic and revenue, but we do have data.

In this instance, we have useful data regarding Canadian consumers specifically. Not only do we have helpful information from Restaurants Canada, David Henkes from Technomic has also weighed in. For those who are unfamiliar, Technomic is one of the best foodservice research and consulting firms.

Before we dive into Restaurant Canada’s menu trend information, this is not a review of the top menu item orders in Canada. For a deep dive into that topic in particular, please read our article “F&B in Canada: Top Menu Items.”

Instead, in this article we’re reviewing broader menu categories and interest in them among Canadian consumers. For your own copy of the 2022 Foodservice Facts report, click here.

Word of Warning

Now, it’s important to bear in mind that the data below is a snapshot. It’s important, informative data but it shouldn’t influence your menu completely.

In other words, when considering revising your menu in any way, make sure you’re staying true to your brand and the community you serve. If your data differs from Restaurants Canada and Technomic data, that’s okay.

Not only are there always outliers, not all data applies to every concept. So, don’t take drastic action on your menus based solely on the data below.

For this particular topic, Restaurants Canada asked three age groups about their interest in eight menu categories.

The groups are: 18 to 34, 35 to 54, and 55-plus. The industry advocacy group then reviewed the numbers for those who indicated they’re “very interested” or “somewhat interested” for each category or item.

Who Wants What?

The menu category generating the most interest from Canadian consumers, according to Restaurants Canada data, is food sourced from local farmers. Overall, 93 percent of survey respondents very or somewhat interested. Those in the 55-plus age group are the most interested.

More than 80 percent are interested in comfort foods, or creative riffs on comfort foods. Age groups 18 to 34 and 35 to 54 have the most interest. Precisely 80 percent are interested in trying globally inspired foods and flavors, led by the 18 to 34 age group.

Foods that promote health and wellness come next, with 79 percent of Canadian consumers showing interest. The 55-plus age group is particularly interested. However, dishes that utilize ingredients that boost one’s immune system are only popular among 53 percent of survey respondents. Interestingly, it’s the 18 to 34 age group with the most interest in this category.

In what’s possibly a contrast from American consumers, the final three categories have no more than 41 percent of survey respondents’ interest. Forty-one percent have interest in meatless and vegetarian items. Next, just 38 percent show interest in alcohol-free cocktails. Finally, just 33 percent are interested in plant-based burgers and sausages.

For each of those categories, the greatest interest comes from the 18 to 34 age group, and the 55-plus group shows the least amount of interest.

Recommended Reading

We’ve been reviewing the 2022 Foodservice Facts report from Restaurants Canada in depth for several weeks. To learn more about this important report, please read the following:

Image: Samuel Regan-Asante on Unsplash

by David Klemt David Klemt No Comments

F&B in Canada: Top Menu Items

F&B in Canada: Top Menu Items

by David Klemt

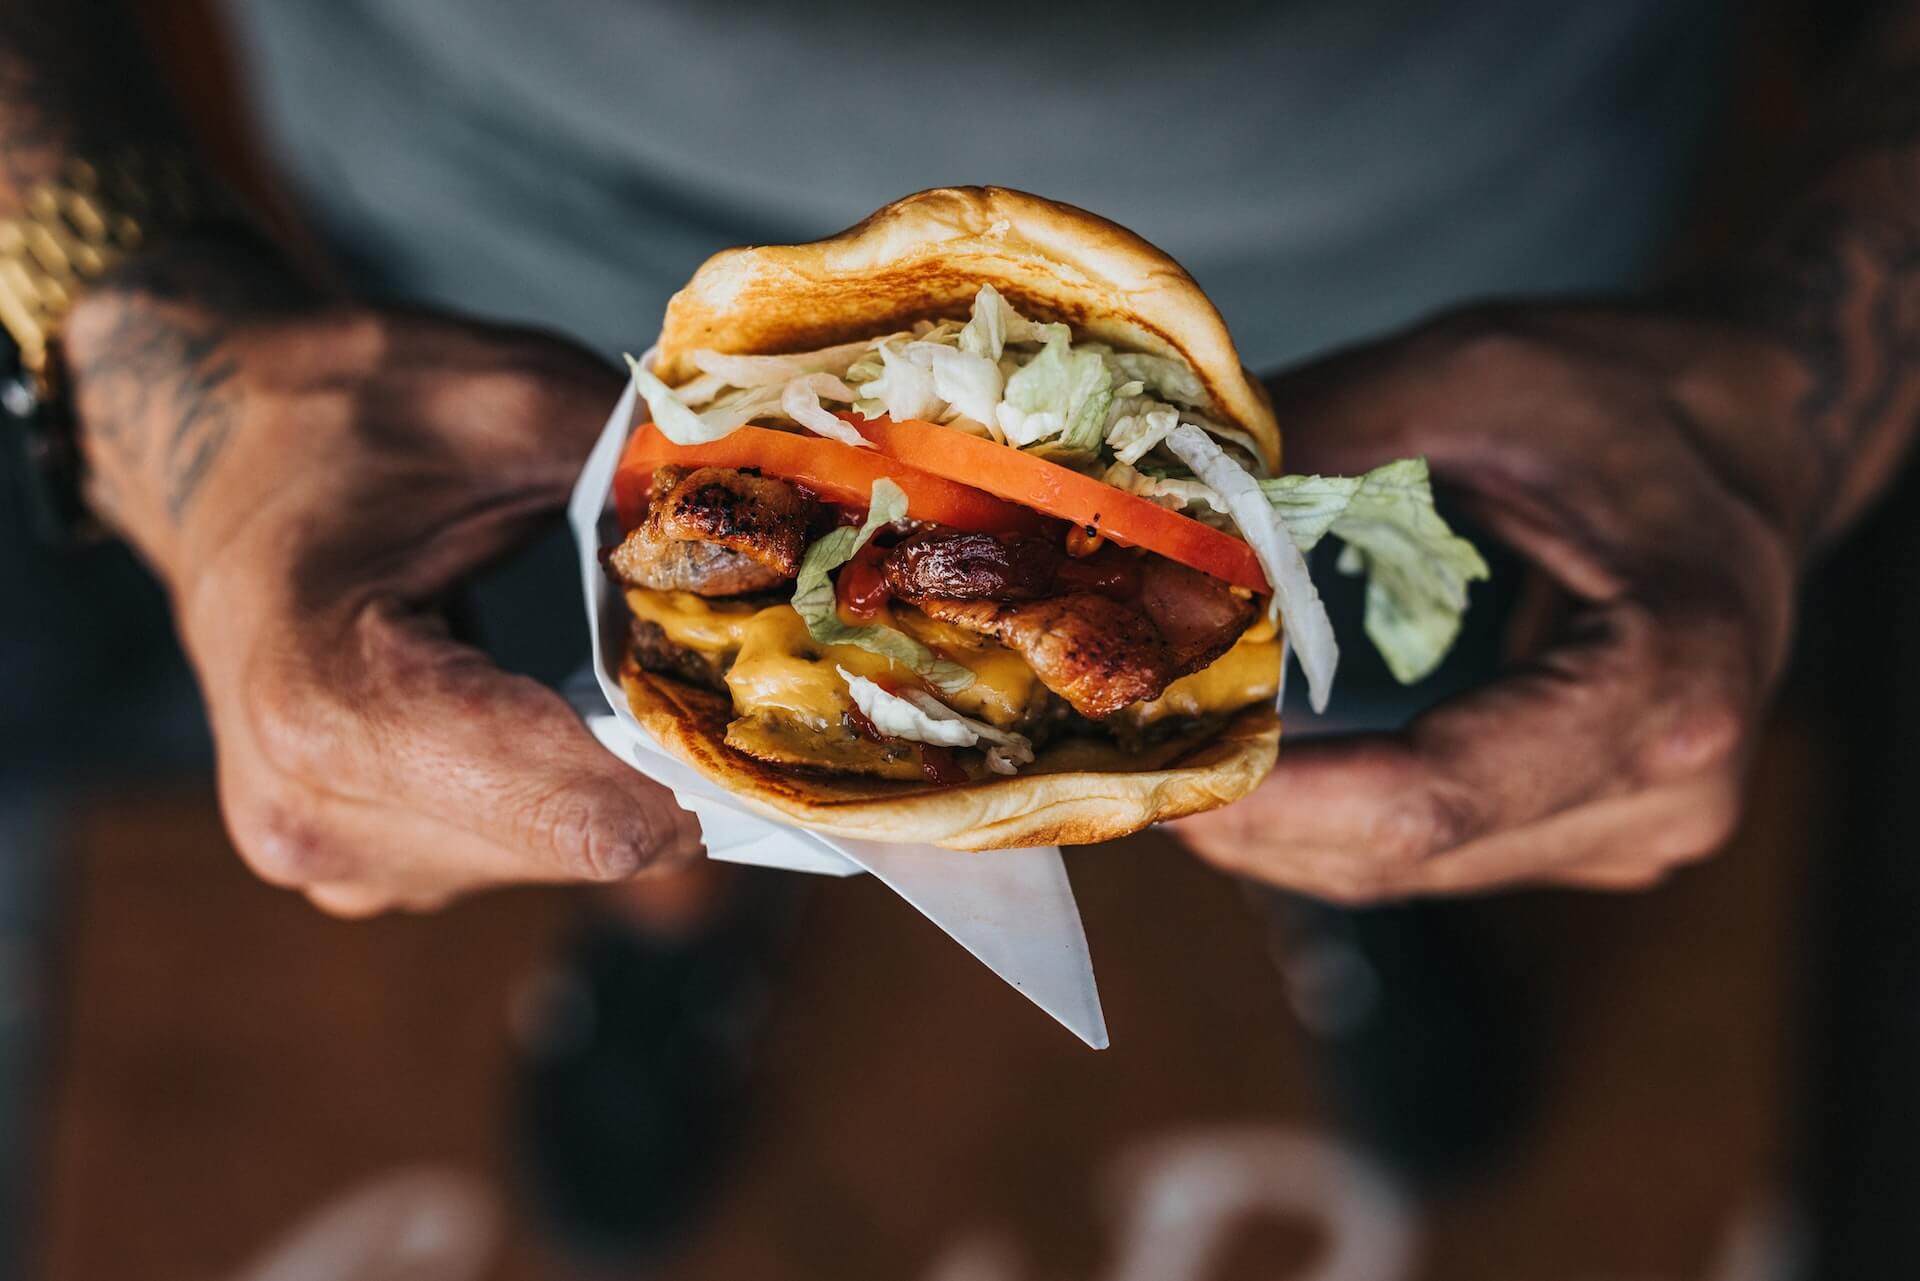
Closeup of hands holding burger

Those wondering what food and beverage menu items are performing best among consumers throughout Canada need wonder no more.

And why is that? Well, Restaurants Canada has the answers, revealing the top ten food and top ten beverage items.

Further, the organization compares each item’s performance. In this instance, Restaurants Canada analyses the percentage of orders that contained each food or beverage item from January to April 2022 in comparison to 2019.

These insights (and many more) are available in Restaurants Canada’s 2022 Foodservice Facts report. In fact, you can find our reviews of several of the restaurant advocacy group’s report topics via the links below:

For your own copy of this year’s Foodservice Facts report, click here.

Top 10 Canadian Drink Menu Trends

As you’ll see below, coffee is outperforming nearly every other beverage category. Specifically, Hot coffee is at the top, while Iced or frozen coffee is ranked third.

Unsurprisingly, Carbonated soft drinks / Pop / Soda split the two coffee categories. According to Restaurants Canada, the Carbonated soft drink category can credit its performance in large part to QSRs.

  1. Milk: 1.8% (2019) to 1.8% (2022)
  2. Iced tea: 2.9% (2019) to 1.6% (2022)
  3. Milkshakes / Smoothies: 2.1% (2019) to 2.0% (2022)
  4. Fruit juice: 3.8% (2019) to 3.0% (2022)
  5. Hot tea: 5.5% (2019) to 4.5% (2022)
  6. Alcohol beverages: 5.1% (2019) to 5.7% (2022)
  7. Water: 6.6% (2019) to 5.0% (2022)
  8. Iced or frozen coffee: 5.3% (2019) to 7.5% (2022)
  9. Carbonated soft drinks / Pop / Soda: 19.7% (2019) to 20.2% (2022)
  10. Hot coffee: 40.9% (2019) to 41.9% (2022)

Compellingly, Alcohol beverage performance in restaurants fluctuated by age group between 2021 and 2022. Alcohol order shares in restaurants, per Restaurants Canada:

  • Legal drinking Age (LDA) to 34: 46% (2021) to 43% (2022)
  • 35 to 49: 17% (2021) to 21% (2022)
  • 50-plus: 37% (2021) to 36% (2022)

Alcohol order shares in bars, according to Restaurants Canada:

  • LDA to 34: 35% (2021) to 35% (2022)
  • 35 to 49: 17% (2021) to 19% (2022)
  • 50-plus: 49% (2021) to 47% (2022)

Overall, the 35 to 49 age group appears to be consuming less alcohol in bars and restaurants in comparison to the LDA to 34 and 50-plus cohorts.

Top 10 Canadian Food Menu Trends

As Restaurants Canada notes, the Sandwich / Sub category has grown in 2022. Interestingly, the category just below it in growth, Chicken, is partially responsible for boosting Sandwich / Sub performance.

As far as entrees or “main attractions,” the Burger category remains at the top, beating out Breakfast, Sandwich / Sub, Chicken, and Pizza menu items.

  1. Cake / Squares / Muffins: 3.7% (2019) to 3.3% (2022)
  2. Salad: 4.3% (2019) to 3.8% (2022)
  3. Donuts / Beignets: 3.0% (2019) to 3.8% (2022)
  4. Breads: 4.3% (2019) to 3.4% (2022)
  5. Pizza / Panzerotti / Calzone: 4.1% (2019) to 4.3% (2022)
  6. Chicken: 7.6% (2019) to 8.5% (2022)
  7. Sandwich / Sub: 8.0% (2019) to 8.5% (2022)
  8. Breakfast: 10.8% (2019) to 11.4% (2022)
  9. Burger: 9.0% (2019) to 10.9% (2022)
  10. French fries / Potato / Sweet potato / Onion rings: 15.0% (2019) to 16.1% (2022)

Image: Nathan Dumlao on Unsplash

by David Klemt David Klemt No Comments

The Numbers on Food Delivery in Canada

The Numbers on Food Delivery in Canada

by David Klemt

Burger in container inside car

For most restaurants, delivery is now a crucial service element rather than a “nice-to-have” option a small percentage of guests expect.

This is true whether your restaurant is in the US or Canada. But who’s placing orders? How are they ordering? And will they continue to order for the foreseeable future?

Well, Restaurants Canada has answers to all those questions and more. So, we let’s take a look at what their 2022 Foodservice Facts report says about delivery.

To download your own copy of this informative report, click here.

Who’s Placing Orders?

In their 2022 Foodservice Facts report, Restaurants Canada looks at three age groups:

  • 18 to 34
  • 35 to 54
  • 55-plus

Perhaps unsurprisingly, the 18- to 34-year-old cohort leads the charge when it comes to ordering delivery. It’s also not surprising that 35 to 54 comes in second, and 55 and older is third.

However, the first two groups are closer than some may assume. Eighty-three percent of the the 18 to 34 cohort placed orders at quick-service or full-service restaurants between December 2021 and May 2022.

That number does drop for the same time period among the 35 to 54 group, but not by a significant amount. Of that cohort, 77 percent ordered delivery. Just over half of the 55-plus group placed delivery orders: 52 percent.

Now, those numbers are down a bit from 2021, which makes sense. Things were much more restrictive in 2021 and people were just getting back to a sense of normalcy at the start of this year.

In 2021, the delivery order percentages were:

  • 18 to 34: 89 percent
  • 35 to 54: 81 percent
  • 55-plus: 67 percent

Looking at these numbers, it appears the 55-plus cohort is more comfortable dining out in person. Conversely, the 18 to 34 age group is clearly comfortable making delivery a part of their everyday lives.

How do People Want to Order?

Believe it or not, your website still matters. I’ve been saying this for years but the pervasiveness of delivery and takeout ordering is really driving this point home.

The fact is, a notable percentage of your guests want to support your restaurant and staff directly. Over the past couple of years, consumers have become well aware that third-party delivery services are incredibly costly for operators.

Consumers are also aware of third-party delivery debacles, such as the abysmal Grubhub “Free Lunch” mess from May of this year.

So, direct delivery is something that operators need to at least consider. Implementation is often less difficult than most business owners believe. And many platforms, SevenRooms, for example, make implementing direct delivery simple and affordable.

Interestingly, Restaurants Canada data supports the need for direct delivery. Back in May, the industry advocacy organization asked survey respondents how they prefer to place delivery orders from restaurants.

Preferences for QSR customers:

  • No preference: 10 percent
  • Over the phone: 19 percent
  • Third party: 35 percent
  • Restaurant website or app: 36 percent

Full-service customer preferences:

  • No preference: 8 percent
  • Over the phone: 28 percent
  • Third party: 29 percent
  • Restaurant website or app: 35 percent

Honestly, I find it surprising anyone calls a QSR to place an order. However, I suppose that makes sense for an office or catering.

At any rate, make sure your website is up-to-date, you offer direct or “last-mile” delivery, and make it easy to navigate your menu and the ordering process.

Is Ordering Here to Stay?

Now, we all know why restaurant delivery has been supercharged the past two years. However, consumer trend data show that delivery was on the rise before the Covid-19 pandemic.

But now that people are eager to return to normal and the industry is on its way to returning to pre-pandemic levels, is delivery really here to stay?

According to another question asked of survey respondents by Restaurants Canada, more than half of QSR and full-service restaurant customers plan to stick with delivery.

For their 2022 Foodservice Facts report, Restaurants Canada asked back in May how often consumers planned to place delivery orders in the next six months.

Order frequency for QSR customers:

  • Never placed a delivery order and don’t plan to now: 29 percent
  • Order less often: 20 percent
  • Will order with the same frequency: 45 percent
  • Will order more often: 7 percent

Frequency of orders for full-service customers:

  • Never placed a delivery order: 24 percent
  • Order less often: 23 percent
  • Will order with the same frequency: 44 percent
  • Will order more often: 9 percent

Here to Stay?

Of course, there are multiple factors feeding the numbers above. Some people simply don’t like ordering and waiting for delivery. For these consumers, the practice doesn’t just seem convenient.

There’s also the consumer demand to return to in-person dining, socializing with family and friends. And, of course, meeting new people while dining out.

We must also consider inflation and rising costs. Often, restaurant spending is among the first to be reduced when consumers need to be more frugal. Rising menu costs are sure to curtail some delivery spending.

That said, it’s clear delivery is here to stay and must be considered a crucial element for most restaurant operations. QSR and full-service operators need to bear in mind is placing orders; how often they’re placing orders; and get them in the habit of placing orders directly.

Image: Oliur on Unsplash

by David Klemt David Klemt No Comments

Operators & Guests Respond to Rising Costs

Operators & Guests Respond to Rising Costs

by David Klemt

Canadian dollar bills

Everything is more expensive these days and both operators and consumers have their own ideas for addressing rising costs.

To gather and share insight into people’s mindsets, Restaurants Canada conducted and commissioned two surveys.

For one, the industry research and advocacy organization surveyed operators. The focus was on how much operators anticipated increasing their prices.

On the other side, Restaurants Canada commissioned Angus Reid for a survey focusing on consumers. This survey revealed potential traffic slowdowns and perceived value for money.

For your own copy of Restaurant Canada’s 2022 Foodservice Facts report, click here.

QSR vs. FSR: Consumers

As an operator, converting first-time visitors into repeat guests is paramount. Equally as important: increasing visit frequency per guest.

Of course, an immediate byproduct of rising costs is consumers pulling back and reevaluating their spending. Oftentimes, dining out is one of the first costs consumers slash in order to save money.

Therefore, operators always face the risk of reduced traffic and even losing some guests permanently when they raise prices. However, this is often a necessary risk to take to combat rising costs.

So, how dire is the situation among Canadian consumers currently? Or at least, how did they feel in Q2 of this year? Angus Reid conducted a survey of consumers to find out, and the results can be found within the 2022 Foodservice Facts report.

First, let’s look at visit frequency for QSRs and FSRs. Before we begin, 12 percent of survey respondents answer that they “don’t know for sure” if rising prices will affect their visit frequency for either QSRs or FSRs. Not helpful.

For QSRs, 19 percent of respondents say an increase in prices won’t impact their visit frequency. Thirty-six percent anticipate visiting “a little less often,” while 32 percent will visit much frequently.

As for FSRs, 16 percent of survey respondents won’t change their visit frequency. However, 37 percent anticipate visiting FSRs much less often. Nearly as many, 36 percent, will visit a bit less frequently.

Interestingly, however, is perceived value. More FSR guests believe they receive excellent or good value for their money than they do from QSRs. More QSR guests believe they receive fair, poor, or very poor value for their money.

Overall, though, 90 percent of Canadian consumers feel positive toward the value they receive from QSRs and FSRs.

QSR vs. FSR: Operators

Clearly, it’s good news that the vast majority of Canadians believe they receive good value for their money when dining out.

Nobody enjoys paying more but it appears that both QSRs and FSRs in Canada can increase their prices. At least, they can do so for now while consumers are mostly understanding about inflation.

Restaurants Canada asked QSR and FSR operators a simple but revealing question for their 2022 Foodservice Facts report. The question? How much higher do operators expect to increase their prices by the end of Q4 of this year in comparison to last year?

The majority of operators in both categories anticipate they’ll increase menu prices by more than seven percent. Twenty-seven percent of QSR operators have that expectation. That number rises to 35 percent for FSR operators.

Twenty-two percent of QSR operators anticipate raising prices five to seven percent before the end of 2022. In comparison, 32 percent of FSR operators expect to raise prices in the same range.

At the moment, Canadian consumers appear to be willing to endure these increases. However, it’s likely they expect prices to drop back to “normal” (pre-pandemic prices) or close to it sometime in 2023. That is, unless Canada slides into recession.

Image: PiggyBank on Unsplash

by David Klemt David Klemt No Comments

Restaurants in Canada: Daypart Performance

Restaurants in Canada: Daypart Performance

by David Klemt

White clock on red background

For both in-person dining and off-premise consumption, more Canadian consumers are ordering from restaurants across all dayparts.

As Restaurants Canada points out in their latest report, traffic and sales remain lower than pre-pandemic levels. However, there are reasons to be positive.

For one example, Restaurants Canada predicts 2022 sales to return to pre-pandemic levels by the end of the year. The foodservice research and advocacy organization’s 2022 Foodservice Facts report provides another positive outlook.

Just looking at Q1 of this year versus Q3, all dayparts are seeing increases in traffic.

To read more about the report and grab your own copy, follow this link.

Numbers Tell the Tale

Per Restaurants Canada, the breakfast daypart slid significantly in 2020. During that time, it fell 20 percent that year.

For the first half of this year, however, Restaurants Canada reports that breakfast traffic is just four percent lower in comparison to 2019.

On a positive note, the breakfast daypart has risen steadily from March of this year to July, or Q1 versus Q3. In fact, all dayparts have grown.

According to Restaurants Canada, 43 percent of Canadians ordered breakfast from restaurants in March 2022. That number grew to 50 percent by July of this year.

In terms of snack purchases, 55 percent of Canadian consumers made purchases from restaurants. By July, that percentage rose to 62 percent.

Continuing along, 64 percent of Canadians placed lunch orders in March. Four months later, that number had increased to 73 percent.

Per the 2022 Foodservice Facts report, a significant percentage of Canadians are placing lunch and snack orders. In fact, Restaurants Canada says that Canadians are making purchases from restaurants during those dayparts two to three times per month.

Of course, there’s one more daypart we need to discuss…

Dinner is King

By the numbers, the dinner daypart is outperforming all others in Canada.

In March of 2022, 85 percent of Canadians had placed dinner orders at restaurants. That number rose to 87 percent in April but dipped to 86 percent in May.

However, dinner saw growth again in June and July, rising to 88 and then 89 percent, respectively.

As the numbers show, dinner orders are outpacing lunch orders 14 percent. Snacks are being outpaced by dinner by nearly 30 percent. Of all dayparts, breakfast is the weakest.

In fact, dinner outperforms breakfast by nearly 40 points. This makes sense when we consider the work-from-home effect.

More people working from home means, in theory, many less people commuting to work. Restaurants that once saw great breakfast daypart traffic are seeing a significant dropoff. Less people commuting means less people popping into a restaurant for breakfast.

It appears that instead, people are clocking in, working until break time, and then going to get a snack. And when lunch rolls around, why not place an order for lunch?

Naturally, after working all day, people are tired or eager to meet up with friends and family to socialize and decompress. So, dinner ruling the daypart roost makes complete sense.

In other words, operators looking to streamline should consider this Restaurants Canada data. The dayparts that require the most labor currently are lunch and dinner, so operators should plan accordingly if that’s viable for their business.

Image: CHUTTERSNAP on Unsplash

Top