Direct delivery

by David Klemt David Klemt No Comments

2023 DoorDash Ordering Trends

2023 DoorDash Ordering Trends: Canada & US

by David Klemt

Canada and the United States of America on a globe

After checking out this year’s annual Cravings Report we’re turning our attention to the 2023 DoorDash restaurant ordering trends reports.

Luckily, there are two reports available from DoorDash: one that focuses on Canada, and one for the US.

These two countries are, of course, KRG Hospitality’s primary markets. So, the data in these DoorDash reports is relevant and compelling for our current and future clients.

Perhaps unsurprisingly, Canadian and American DoorDash users are somewhat similar by a few metrics. However, where there are differences they’re fairly glaring.

For example, 78 percent of Canadian DoorDash survey respondents picked up a takeout order from a restaurant in the month prior to being surveyed. That number is 76 percent for American survey respondents.

Regarding in-person restaurant dining, 62 percent of respondents had done so the month prior. Among American survey respondents that number is 61 percent.

But when it comes to placing an order for delivery we see a notable difference. For Canada, 58 percent of survey respondents had ordered delivery. That number jumps to 77 percent among Americans.

This tells me a few (fairly obvious) things. Generally speaking, it appears consumers in Canada and America—according to DoorDash—prefer delivery and takeout to in-person dining. Going further, it seems that overall, Canadians prefer pickup or takeout to delivery. However, Americans seem to place delivery and pickup orders at nearly identical rates.

If it’s true that consumers favor delivery or takeout to in-person dining currently, there could be a couple of simple reasons. First, convenience.

Second, fees. It’s possible that today’s consumer perceives delivery fees are lower than in-person dining fees, unfortunately. If that’s the case, third-party delivery services can exploit this perception.

More Similar than Different

In comparing both DoorDash reports, I find that Canadian and American consumers who use DoorDash are rather similar.

Survey respondents in both countries indicate that Friday is the most popular day of the week to order food. Further, 6:00 PM is the most common local time to place orders in both countries.

And when it comes to the fastest-growing dayparts for order placement? In both Canada and the US it’s late-night and breakfast. Although, I most note that both dayparts are growing faster in Canada.

Nearly half of American respondents and a little over half of Canadian respondents indicate they want to try new restaurants and dishes.

Definitely not surprisingly, consumers in both countries primarily focus on menu selection and pricing when seeking a new restaurant to try. In fact, these numbers are identical for Canadians and Americans, at 55 percent and 51 percent, respectively.

Top Canadian Food Orders

When we look at the top items ordered via DoorDash, we don’t find anything out of the ordinary.

  1. Burgers
  2. Fries
  3. Pizza
  4. Salad
  5. Sandwiches

Looks like standard fare and comfort foods to me. This tells me that operators who have these items on their menus need to ensure they’re of the highest quality to stand out from other restaurants and bars.

Top American Food Orders

Interestingly but not too surprisingly, the list below is quite similar to the list above.

  1. French fries
  2. Burgers
  3. Tacos
  4. Salad
  5. Pizza

With the exception of tacos and sandwiches, the list is nearly identical.

Hey, who wants to debate whether tacos and sandwiches are in the same food family?

I encourage you to review both reports in their entirety for yourself. For the Canadian Edition of DoorDash’s report, click here. And click here for the US edition.

Image: Lara Jameson on Pexels

Bar Pub Brewery Nightclub Club Nightlife Technology Plan Tech Stack

by David Klemt David Klemt No Comments

Canada’s Top 2022 DoorDash Orders

Canada’s Top 2022 DoorDash Orders

by David Klemt

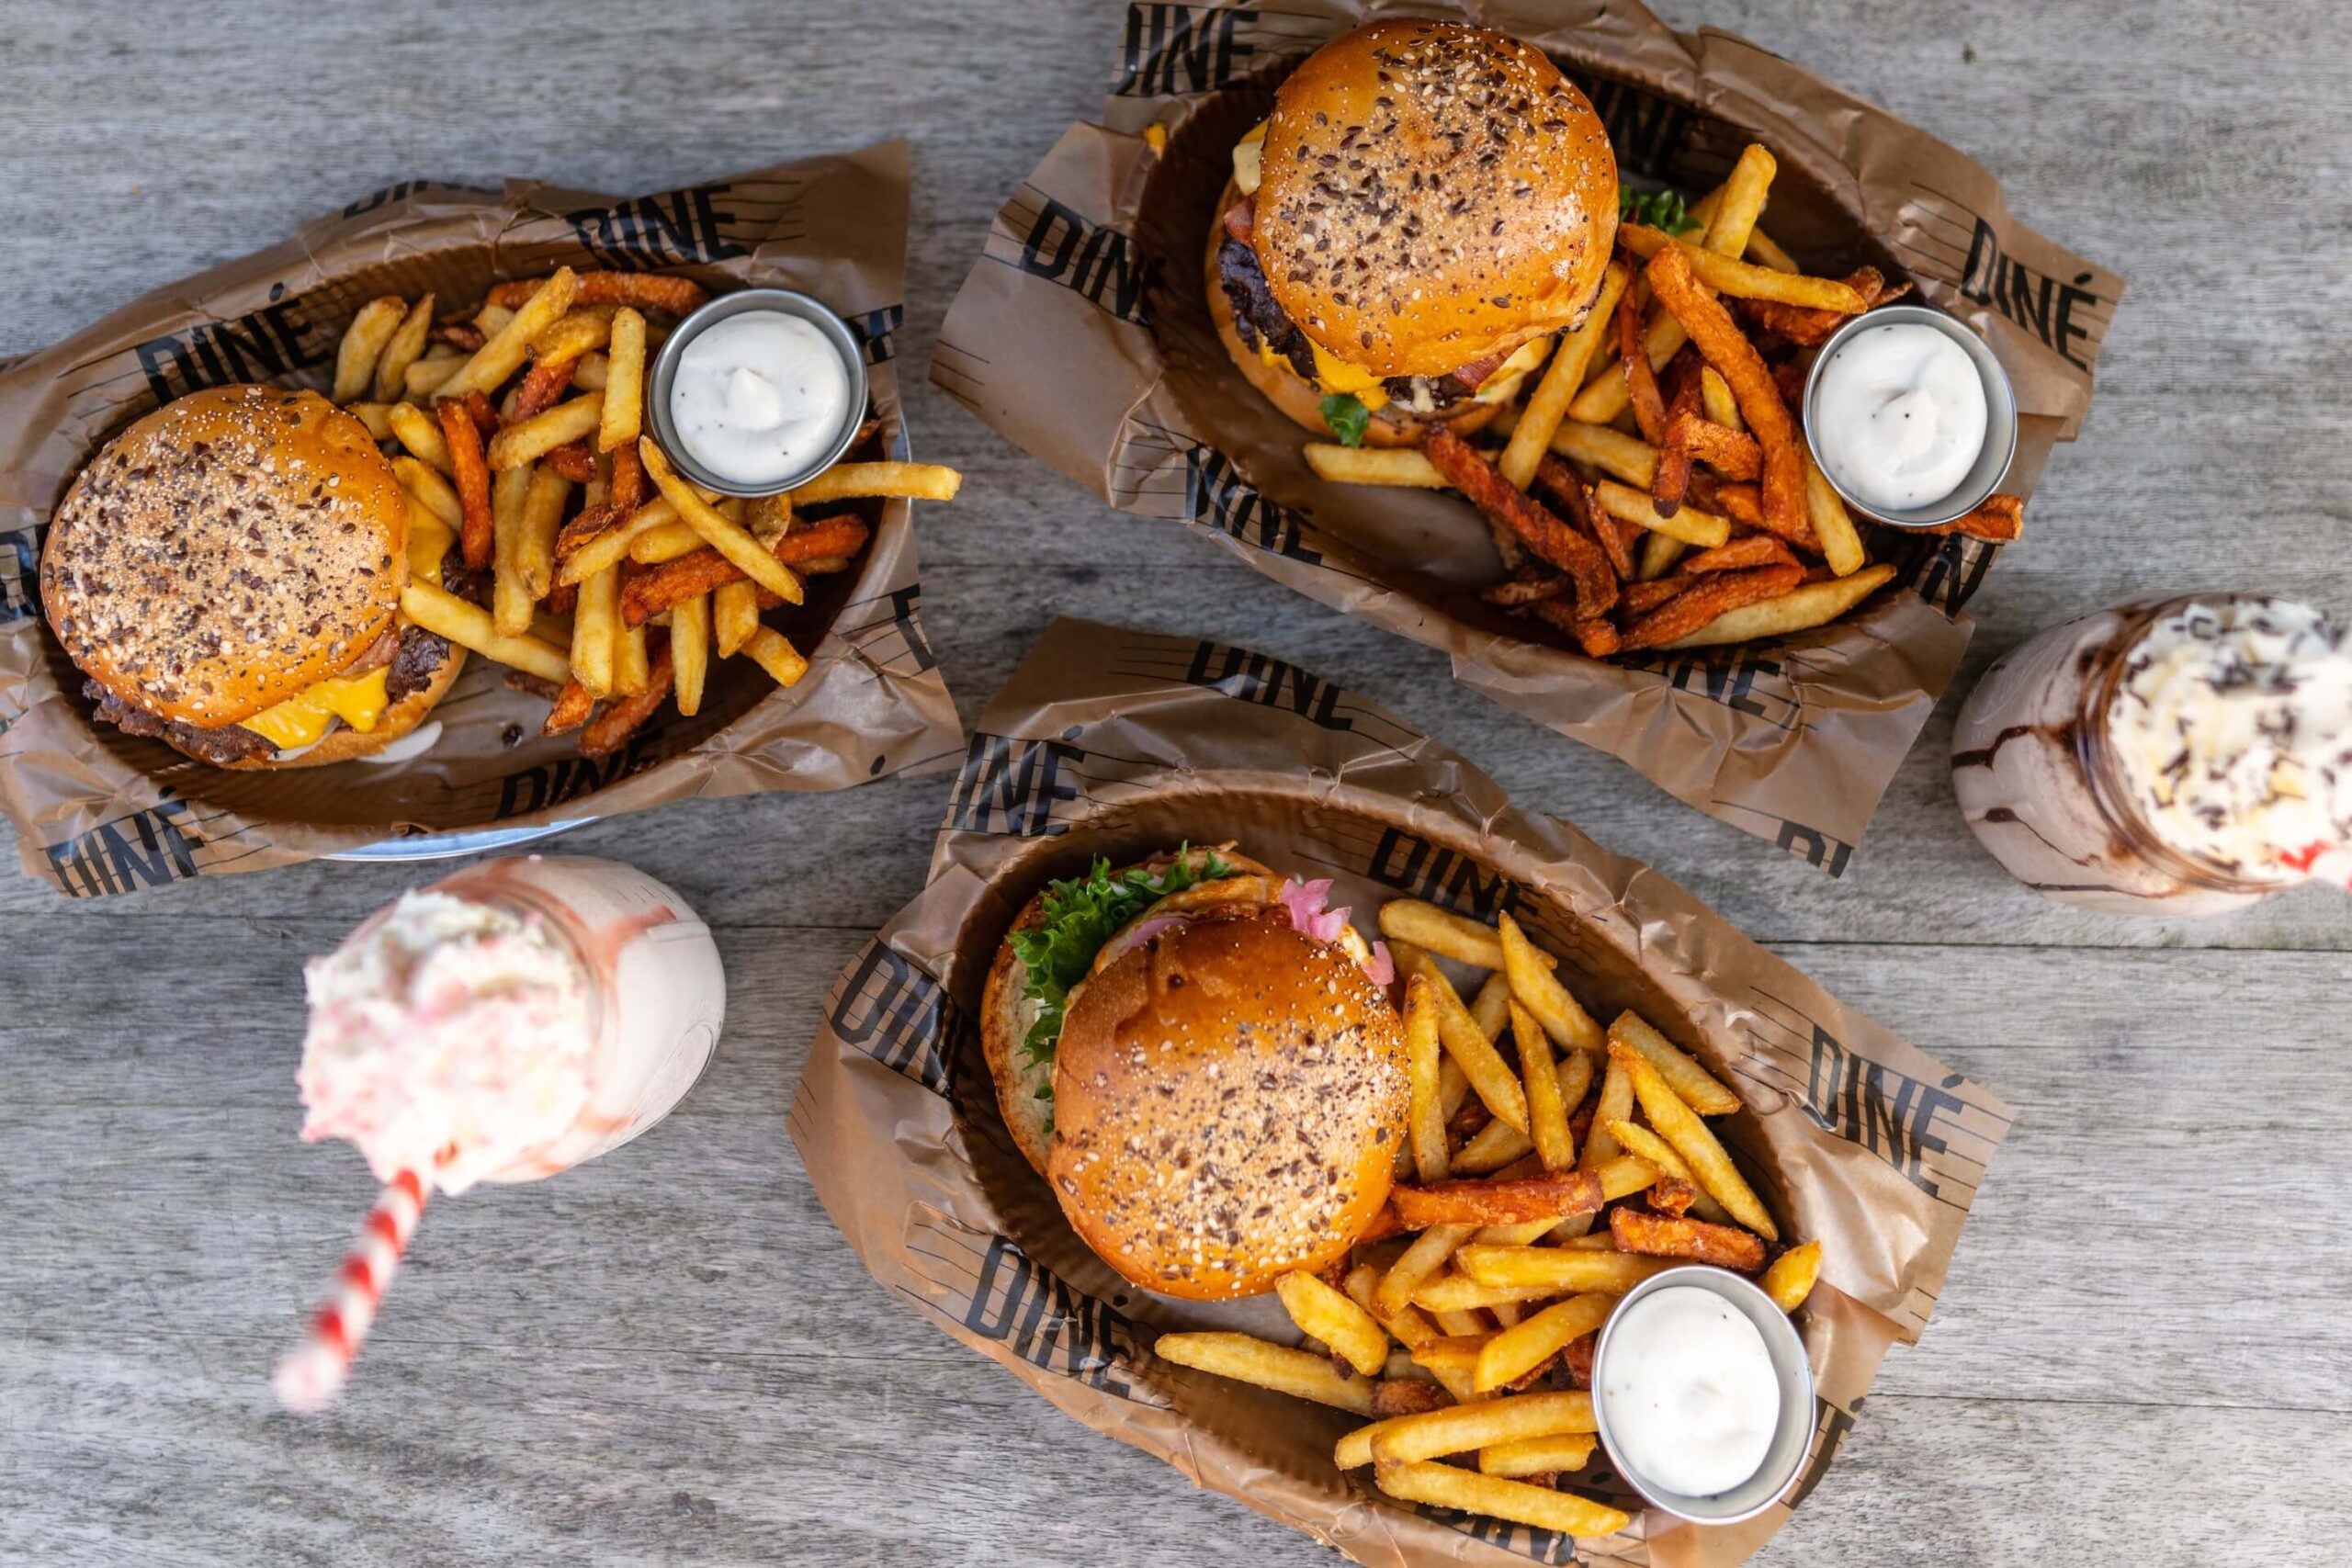
Burgers, French fries and milkshakes

Operators curious about the most popular delivery items in 2022 will be happy to learn that DoorDash’s year-end report is ready for viewing.

Those who want to compare it to predictions from several sources earlier this year can click here. The DoorDash Canada report can also be compared to consumer trends in Canada revealed back in October.

Before we jump in, I’m not detailing the DoorDash report in its entirety here. To review the entire report, please click here.

Instead, I’ll be sharing the top takeaways in terms of top menu items; top cuisines; and top items by province.

Speaking of provinces, a word to New Brunswick, Newfoundland and Labrador, Northwest Territories, Nova Scotia, Nunavut, Prince Edward Island, and the Yukon. Please don’t break out the pitchforks and come for me for not including you in this article. DoorDash’s report only covers data from six provinces—I didn’t leave you out intentionally.

Top DoorDash Cuisines in Canada

  1. American
  2. Mexican
  3. Japanese
  4. Thai
  5. Mediterranean
  6. Indian
  7. Chinese
  8. Italian
  9. Korean
  10. Filipino

Top DoorDash Items in Canada

  1. Burgers & Fries
  2. Fried Chicken
  3. Poutine
  4. Sushi Rolls
  5. Chicken Wings
  6. Burritos
  7. Chicken Rice Bowl
  8. Shawarma Wraps
  9. Curry
  10. Pad Thai

I think there’s one key takeaway that stands out in regards to this list. Notably, it appears that while chicken isn’t number one, it’s undeniably popular amongst Canadian DoorDash users.

In fact, according to DoorDash data, chicken reigns supreme in British Columbia. When you reach the province-specific sections below, you’ll see how powerful the cravings in BC are for chicken.

Top DoorDash Late-night Items

Again, chicken rules the DoorDash roost in this category.

  1. Chicken Nuggets
  2. Fries
  3. Poutine
  4. Chicken Wings
  5. Chicken Burgers
  6. Apple Pie
  7. Cheeseburger
  8. Spinach & Cheese Dip
  9. Chocolate Fudge Sundae
  10. Crispy Chicken

Top DoorDash Items: British Columbia

  1. Burrito Bowl
  2. Szechuan Chicken Lettuce Wraps
  3. Butter Chicken
  4. California Roll
  5. Crispy Chicken Sandwich
  6. Tofu Bowl
  7. Chocolate Chip Cookies

Top DoorDash Items: Ontario

  1. Cheeseburger
  2. Coffee
  3. Burrito Bowls
  4. Chicken Shawarma
  5. Crispy Chicken
  6. Bagels
  7. Pad Thai
  8. Beef Patty
  9. Pizza
  10. Onion Rings

Top DoorDash Items:Alberta

  1. Spinach and Cheese Dip
  2. Chicken Cheddar Sandwich
  3. Chilli Chicken
  4. Kale Salad
  5. Margarita Pizza
  6. Hot Apple Turnover

Top DoorDash Items: Québec

  1. Poutine
  2. Cappuccino
  3. Pad Thai
  4. Steak and Cheese
  5. Croissant
  6. Dumplings
  7. Chips
  8. Tacos

Top DoorDash Items: Saskatchewan

Interestingly, a beverage item holds the top spot in Saskatchewan.

  1. Bubble Tea
  2. Pepperoni Pizza
  3. Pork Bun
  4. Crispy Pork
  5. Garlic Bread
  6. Pasta

Top DoorDash Items: Manitoba

  1. Fries
  2. Butter Chicken
  3. Red Velvet Cake
  4. Poke Bowl
  5. Shawarma Wrap

As I stated in Wednesday’s article detailing Grubhub and Uber Eats’ reports for the US, we believe operators should take as much control over their restaurants and bars as possible. At KRG Hospitality, that means implementing direct delivery if it makes sense: ease of use, delivery capabilities, favorable costs, etc.

It’s also helpful to know what consumers in your area are craving and ordering. Such information can provide a useful baseline for many concepts’ menu development.

Image: John Fornander on Unsplash

by David Klemt David Klemt No Comments

The Numbers on Food Delivery in Canada

The Numbers on Food Delivery in Canada

by David Klemt

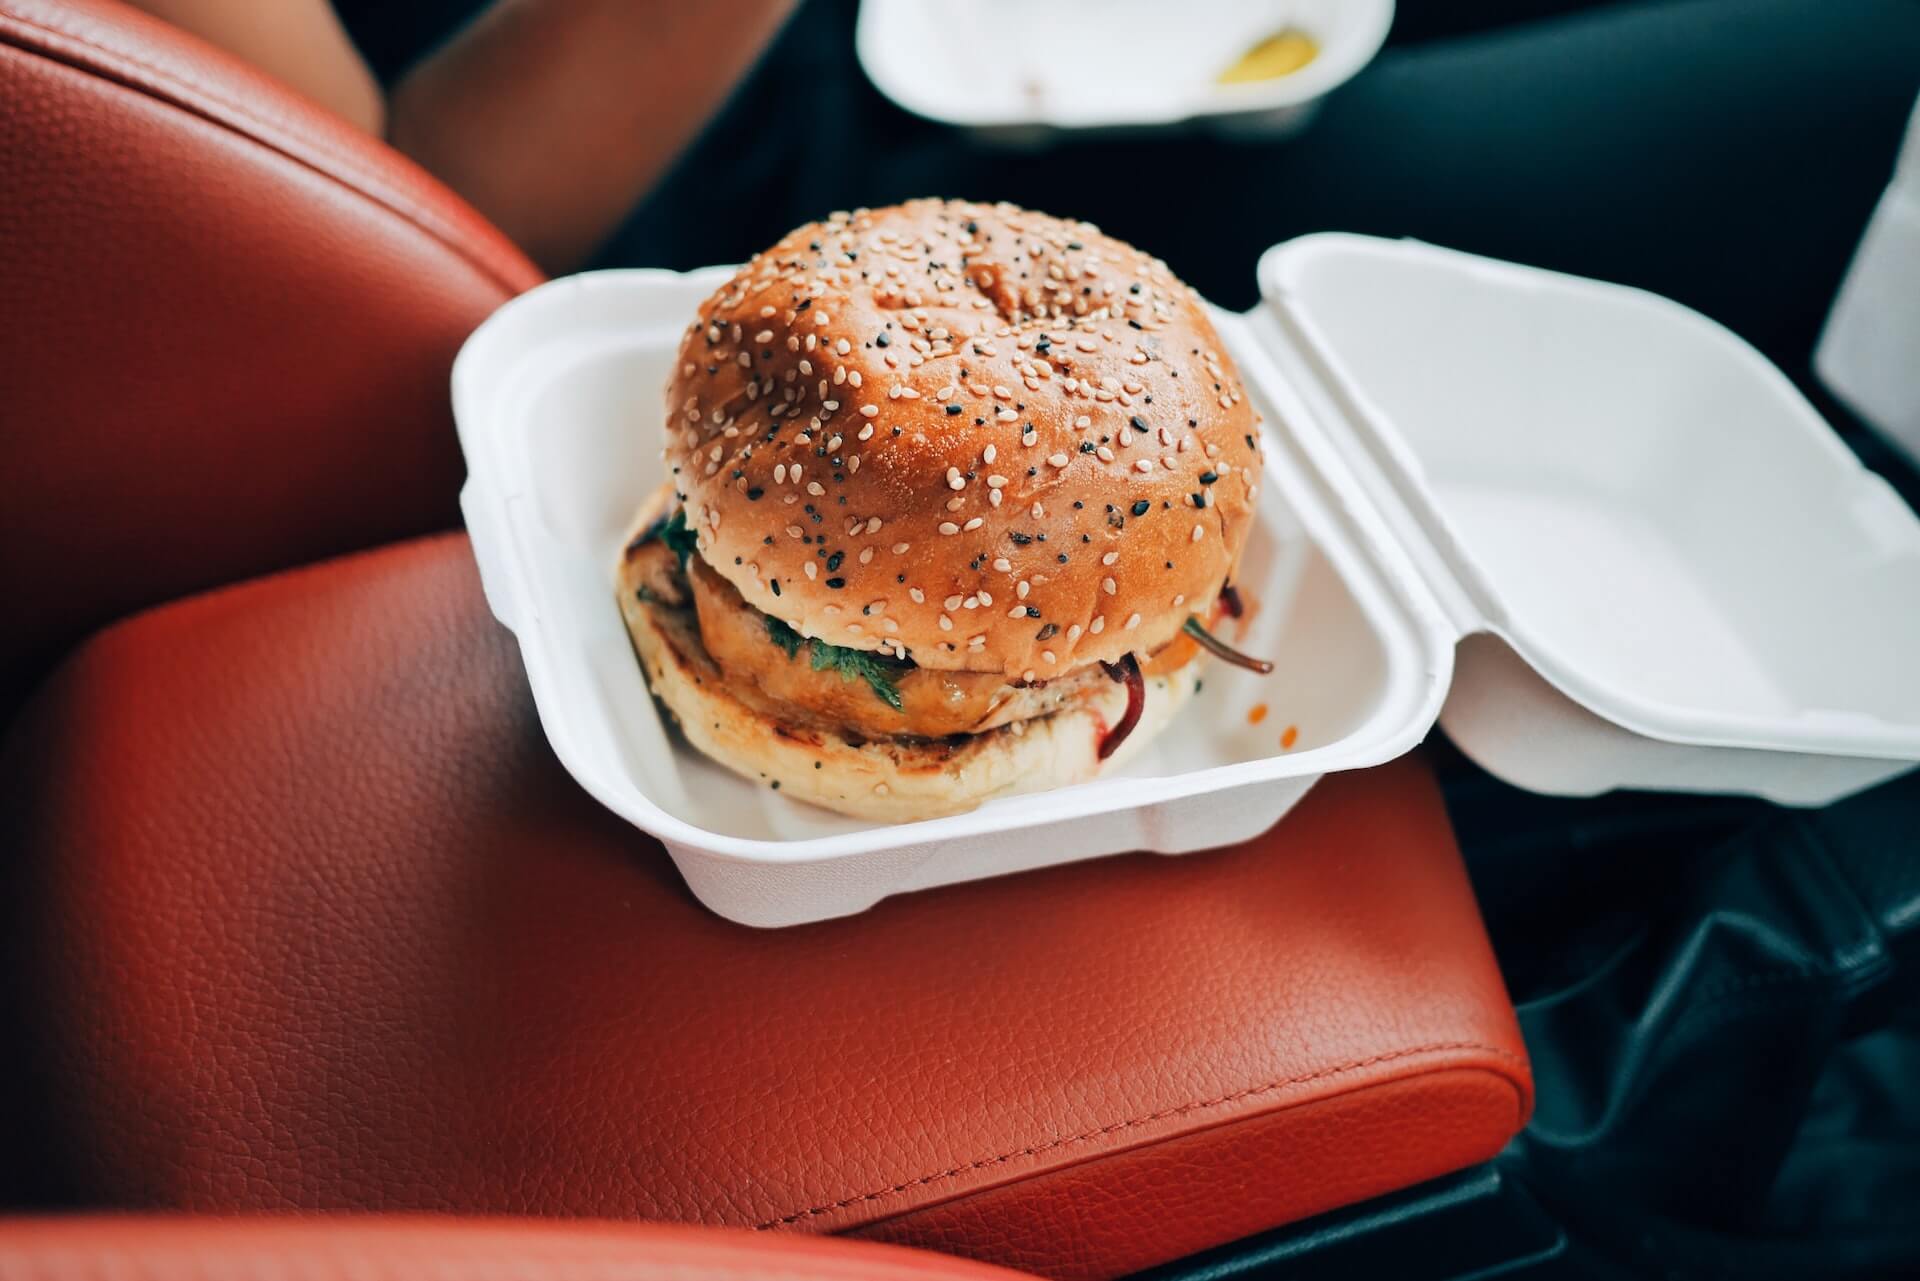
Burger in container inside car

For most restaurants, delivery is now a crucial service element rather than a “nice-to-have” option a small percentage of guests expect.

This is true whether your restaurant is in the US or Canada. But who’s placing orders? How are they ordering? And will they continue to order for the foreseeable future?

Well, Restaurants Canada has answers to all those questions and more. So, we let’s take a look at what their 2022 Foodservice Facts report says about delivery.

To download your own copy of this informative report, click here.

Who’s Placing Orders?

In their 2022 Foodservice Facts report, Restaurants Canada looks at three age groups:

  • 18 to 34
  • 35 to 54
  • 55-plus

Perhaps unsurprisingly, the 18- to 34-year-old cohort leads the charge when it comes to ordering delivery. It’s also not surprising that 35 to 54 comes in second, and 55 and older is third.

However, the first two groups are closer than some may assume. Eighty-three percent of the the 18 to 34 cohort placed orders at quick-service or full-service restaurants between December 2021 and May 2022.

That number does drop for the same time period among the 35 to 54 group, but not by a significant amount. Of that cohort, 77 percent ordered delivery. Just over half of the 55-plus group placed delivery orders: 52 percent.

Now, those numbers are down a bit from 2021, which makes sense. Things were much more restrictive in 2021 and people were just getting back to a sense of normalcy at the start of this year.

In 2021, the delivery order percentages were:

  • 18 to 34: 89 percent
  • 35 to 54: 81 percent
  • 55-plus: 67 percent

Looking at these numbers, it appears the 55-plus cohort is more comfortable dining out in person. Conversely, the 18 to 34 age group is clearly comfortable making delivery a part of their everyday lives.

How do People Want to Order?

Believe it or not, your website still matters. I’ve been saying this for years but the pervasiveness of delivery and takeout ordering is really driving this point home.

The fact is, a notable percentage of your guests want to support your restaurant and staff directly. Over the past couple of years, consumers have become well aware that third-party delivery services are incredibly costly for operators.

Consumers are also aware of third-party delivery debacles, such as the abysmal Grubhub “Free Lunch” mess from May of this year.

So, direct delivery is something that operators need to at least consider. Implementation is often less difficult than most business owners believe. And many platforms, SevenRooms, for example, make implementing direct delivery simple and affordable.

Interestingly, Restaurants Canada data supports the need for direct delivery. Back in May, the industry advocacy organization asked survey respondents how they prefer to place delivery orders from restaurants.

Preferences for QSR customers:

  • No preference: 10 percent
  • Over the phone: 19 percent
  • Third party: 35 percent
  • Restaurant website or app: 36 percent

Full-service customer preferences:

  • No preference: 8 percent
  • Over the phone: 28 percent
  • Third party: 29 percent
  • Restaurant website or app: 35 percent

Honestly, I find it surprising anyone calls a QSR to place an order. However, I suppose that makes sense for an office or catering.

At any rate, make sure your website is up-to-date, you offer direct or “last-mile” delivery, and make it easy to navigate your menu and the ordering process.

Is Ordering Here to Stay?

Now, we all know why restaurant delivery has been supercharged the past two years. However, consumer trend data show that delivery was on the rise before the Covid-19 pandemic.

But now that people are eager to return to normal and the industry is on its way to returning to pre-pandemic levels, is delivery really here to stay?

According to another question asked of survey respondents by Restaurants Canada, more than half of QSR and full-service restaurant customers plan to stick with delivery.

For their 2022 Foodservice Facts report, Restaurants Canada asked back in May how often consumers planned to place delivery orders in the next six months.

Order frequency for QSR customers:

  • Never placed a delivery order and don’t plan to now: 29 percent
  • Order less often: 20 percent
  • Will order with the same frequency: 45 percent
  • Will order more often: 7 percent

Frequency of orders for full-service customers:

  • Never placed a delivery order: 24 percent
  • Order less often: 23 percent
  • Will order with the same frequency: 44 percent
  • Will order more often: 9 percent

Here to Stay?

Of course, there are multiple factors feeding the numbers above. Some people simply don’t like ordering and waiting for delivery. For these consumers, the practice doesn’t just seem convenient.

There’s also the consumer demand to return to in-person dining, socializing with family and friends. And, of course, meeting new people while dining out.

We must also consider inflation and rising costs. Often, restaurant spending is among the first to be reduced when consumers need to be more frugal. Rising menu costs are sure to curtail some delivery spending.

That said, it’s clear delivery is here to stay and must be considered a crucial element for most restaurant operations. QSR and full-service operators need to bear in mind is placing orders; how often they’re placing orders; and get them in the habit of placing orders directly.

Image: Oliur on Unsplash

by David Klemt David Klemt No Comments

What Consumers Expect from Delivery

What Consumers Expect from Delivery

by David Klemt

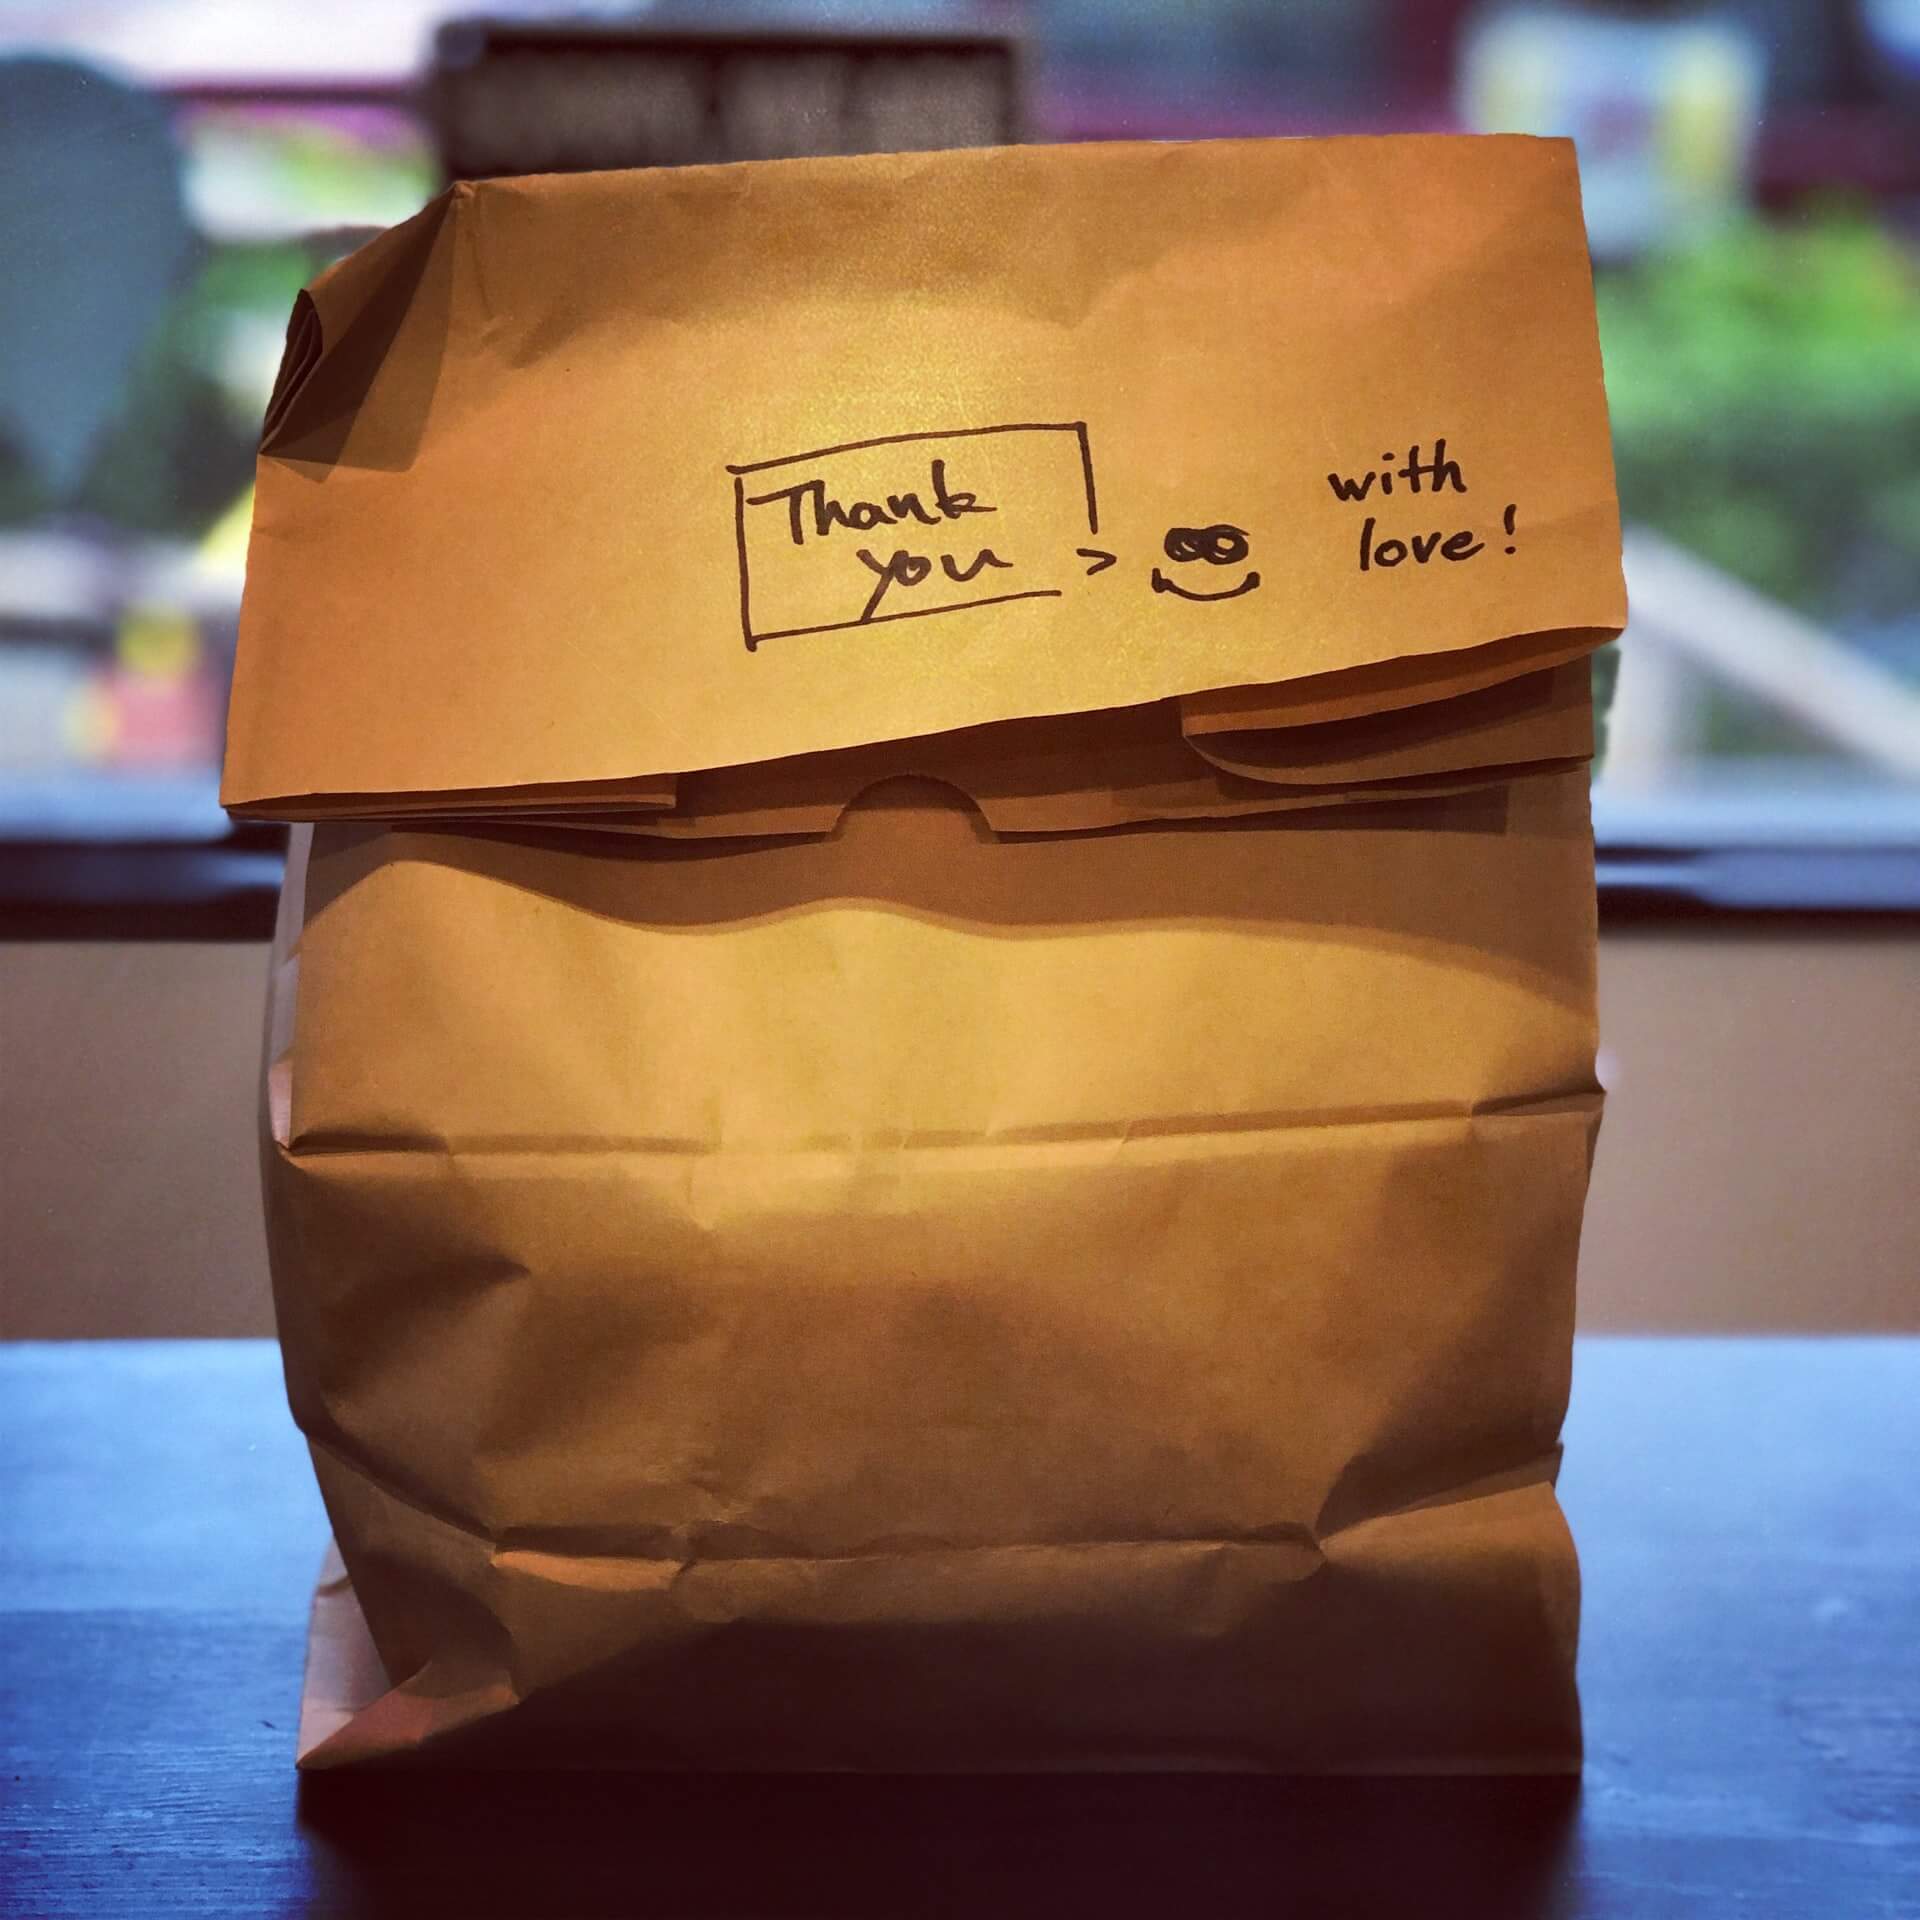
Delivery or takeout food order in brown paper bag

Consumers are developing specific behaviors and opinions regarding delivery that impact their perception of restaurants and brands.

Over the course of two years and three surveys, Deloitte has attempted to learn more about consumers and delivery.

In total, Deloitte surveyed 1,550 restaurant customers. Additionally, the multinational interviewed highly positioned executives from ten casual, fast-casual, and QSR brands.

What Consumers Want

First, it should come as no surprise that delivery is here to stay. None of Deloitte’s survey results indicate otherwise.

In fact, it appears that some consumers are showing an interest in additional delivery methods. Half of survey respondents are willing to try driverless or drone delivery.

More than half—64 percent—don’t expect to return to pre-pandemic dining habits by March of this year. Illustrating the habit of ordering takeout and delivery, 61 percent of respondents engage with restaurants that way at least once per week. That represents a 32-percent increase from June 2020 to September 2021.

When dining off-premise, 57 percent of Deloitte survey respondents prefer to place orders via an app. However, 40 percent of respondents prefer a restaurant’s own branded website or app. That shows that:

  1. A restaurant’s website matters. A significant percentage of consumers want to get information, get a feel for a restaurant, and place orders with a business directly.
  2. Direct delivery is feasible. Consumers want to know and feel as though they’re supporting a restaurant directly rather than a third-party business.

Own the Delivery Experience

Of course, quality is a concern with consumers who place delivery orders. This points to another pitfall regarding third-party delivery beyond the fees.

Unfair as it is, three out of five restaurant customer survey respondents have quality expectations. Specifically, they expect the same food experience off-premise as they receive on-premise. That means the same quality and the same freshness.

They also indicate that wait times of up to 30 minutes are acceptable. Here’s where the risk to restaurants comes into play. Consumers will fault the restaurant for late orders; cold food (or melted or room-temperature food for cold items); iced drinks becoming watered down; and other order issues even if they’re delivered by third-party services.

So, operators must look into and invest into what they can to improve the quality of delivery orders. Containers that keep hot food hot, French fries and other fried foods crisp, and cold foods cold are paramount.

Unfortunately, problems that occur after an order has left a restaurant—which are out of the business’ hands—are often attributed to the venue. Another reason, then, to consider and implement direct delivery.

Image: Yu Hosoi on Unsplash

by David Klemt David Klemt No Comments

SevenRooms Reveals Third Party Impact

SevenRooms Reveals Third Party Delivery Impact

by David Klemt

Person using Uber Eats on their iPhone

New findings from SevenRooms, the powerful reservation and guest relationship platform, show the impact third-party delivery has on restaurants.

In partnership with YouGov, a respected internet-based market research and data analytics firm, SevenRooms finds that direct delivery saves operators thousands of dollars per month.

The overall finding of the “Data & Dollars: Revealing the Impact of Third-Party Marketplaces” report is startling. Operators are relying on a technology that in reality is harming them and their bottom line.

Cost of Convenience

Foodservice operators and workers, along with being hospitable in their mission to serve others, are adaptable.

The industry proves this time and time again. This is particularly true of the past 12 months.

Nimble operators pivot quickly, so it makes sense that so many restaurants, bars and other foodservice businesses embrace delivery, takeout and curbside pickup. Doing so is a direct and seemingly logical response to a major shift in consumer behavior to lockdowns, restrictions, and health concerns.

Most operators are well aware that state third-party delivery platforms take a 30-percent commission on average. However, the cost goes beyond devastatingly high fees: operators also lose control of the guest journey.

Real-world Example

SevenRooms illustrates the negative financial impact third-party delivery platforms with three examples: a high-end Italian restaurant in New York; a high-end steakhouse in Los Angeles; and a high-volume casual restaurant in California.

Let’s take a look at the last example.

Over a six-month period, the restaurant fulfills 19,000 combined orders. Delivery makes up 75 percent of these orders, takeout/pickup account for 25 percent. The average order is $33, and over the six-month period the total order volume is $617,500. Had the restaurant implemented direct delivery rather than third-party, they would have saved about $154,000.

Break those savings down and the restaurant would save approximately $25,600 per month that could go to:

  • PPE: 853 boxes of face masks or 196 boxes of gloves.
  • Takeout: 101,000 food containers.
  • Guest experience: 522 tanks of propane to keep guests warm on patios.

Using an average rent amount of $6,000-15,000 per month in Los Angeles, that’s also two to four months’ rent.

Guests Support Direct Delivery

The impact of third-party delivery on restaurants isn’t lost on consumers. Many view ordering food as more than just convenient, they see it as a way to support their favorite businesses.

Luckily, consumers are supportive of ordering delivery, takeout and pickup directly from restaurants.

Per SevenRooms:

  • Firstly, 37 percent of Americans are eager to do anything they can to help restaurants.
  • Nearly half, 48 percent, think it’s more economical to order directly from a restaurant.
  • 28 percent who say they prefer ordering directly to third-party delivery feel that way after seeing their favorite restaurants suffer.
  • 23 percent are informed and think third-party delivery platforms charge restaurants too much in fees.
  • 16 percent feel that the harm done to restaurants by third-party delivery outweighs any benefits.

Leverage Direct Delivery Support

SevenRooms identifies several ways in their report that operators can succeed in getting consumers to order directly.

One way is the platforms’ own Direct Delivery solution. We speak to SevenRooms CEO Joel Montaniel about this solution on our Bar Hacks podcast.

Then, of course, there are an array of incentives consumers are willing to accept in exchange for direct delivery and ordering:

  • 41 percent of Americans would order directly over ordering via third-party if a restaurant has its own app with features such as tracking and communication.
  • 37 percent consider a complimentary item such as an appetizer, drink or dessert in addition to their order an appealing incentive.
  • 32 percent like the idea of a personalized promotion applied to a future order or in-person visit.
  • 28 percent indicate interest in a personalized promotion for their meal such as a discount code or comp item.
  • 17 percent are fans of restaurants using ordering history to customize their menu and experience.

Read the entire report here. To learn more about SevenRooms, please click here. Connect with SevenRooms on Twitter, Facebook, LinkedIn and Instagram.

Image: cottonbro from Pexels

Top