Report

by David Klemt David Klemt No Comments

af&co. x Carbonate: 2024 Trends to Watch

af&co. x Carbonate: 2024 Trends to Watch

by David Klemt

Paddle and ball on pickleball court

Marketing and creative agencies af&co. and Carbonate Group‘s 16th annual Hospitality Trends Report provides in-depth insight across several categories.

This is an in-depth, insightful report operators should review in its entirety. The “Sweet Sixteen” edition of this yearly report is available for download here.

There are two interesting details toward the end of af&co. and Carbonate’s report. First, a list of 2023 clients. Second, an explanation for the design of the report itself.

This makes sense: Carbonate is a creative agency that works in the hospitality space, after all. Further, af&co. is a hospitality industry marketing agency.

Now, I won’t be sharing every trend or insight found in these two agencies’ report. Rather, I’m highlighting a number of items across four of the report’s six categories. Again, I think operators and leadership team members should download the report for themselves.

Food

While af&co. and Carbonate identify specific cuisines and items that are trending, it’s their 10,000-foot view of food that I find most compelling. In terms of the big picture, “rigid” adherence to authentic cuisine is falling out of favor.

Chefs, in the agencies’ opinions, are taking a more modern approach to menus. Instead of following the “rules” of certain cuisines, they’re creating dishes and programs that defy labels. Of course, for those who feel the need to label, one could call this approach “contemporary fusion.”

Examples given are Good Luck Gato’s Okonomiyaki Baked Potato, and the Birria Dumplings at Little Bull.

Cuisine Trends

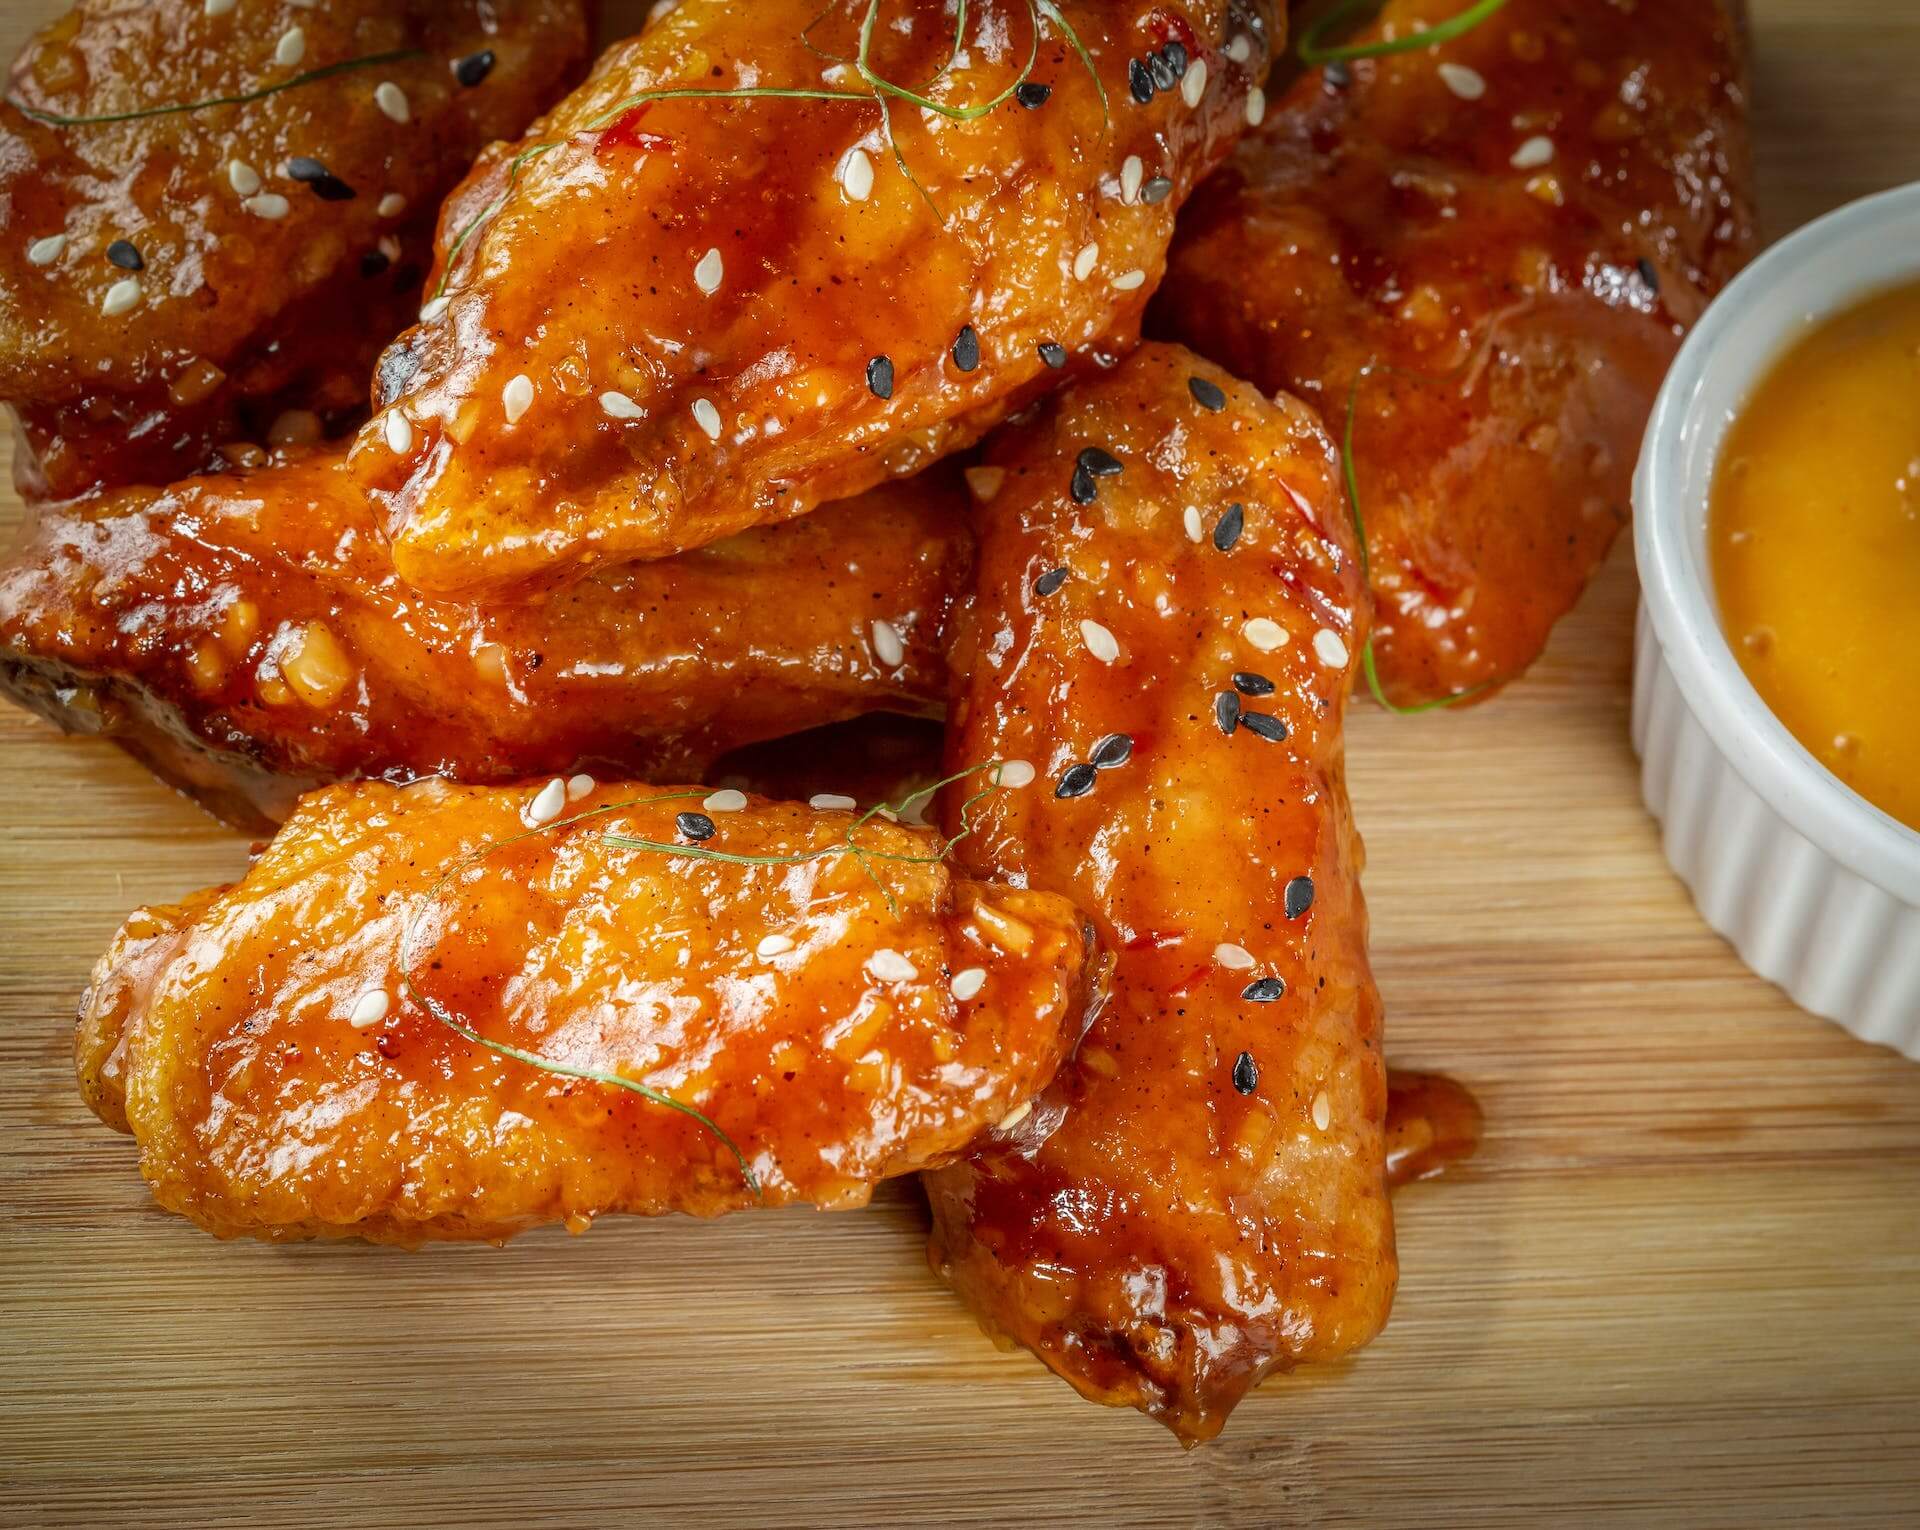
Of course, af& co. and Carbonate also zoom in on food. Their Cuisine of the Year goes to Korean.

Dessert of the Year goes to the Pavlova or Eton Mess. So, one can argue that operators should connect with their back-of-house teams about meringue-based desserts.

Other food trends include making pastries with buckwheat; getting inventive with mortadella; serving borek in snack and entree size; and Brazilian-style pizza.

However, it’s a presentation trend that stood out the most to me. Accompanied by a timeline complete with images, the agencies state confidently that we’re in the “Crescent Moon” era of plating.

Visualize a plate, then place all of the food along the edge, with roughly two-thirds of the space open. That’s the crescent moon presentation.

Beverage

A number of the trends in this section aren’t exactly new. That tells me that some are likely on the brink of moving from trend to ubiquity.

That, or they’re at risk of bumping against their expiration date.

Two trends that have been popping their fins out of the sea of cocktails for a bit make it into the af&co. and Carbonate report. One is clarified cocktails.

Spend a bit of time looking up cocktails on social media and you’ll see these are a bit divisive. Some bartenders are all for them, some appear to absolutely despise this trend. Guests, however, seem to like the novelty of well-known, opaque or translucent classic turning transparent.

Another drink trend? Culinary cocktails. For food-driven concepts, it makes perfect sense to encourage the bar team to work closely with the kitchen team. Offering culinary cocktails is one method of pulling a concept’s threads tighter, telling a more complete story.

Along those lines, the agencies identify another divisive cocktail trend: cheese.

Personally, cocktails that feature cheese aren’t my thing. However, these drinks are, at the minimum, going to grab a guest’s attention. And those who order these drinks aren’t likely to forget the experience any time soon, good or bad.

That last point is important for operators and their teams to remember. A negative experience can be more powerful and stick with a guest longer than a positive one. So, pursue trends with caution.

Hotel

One of the biggest hotel developments the Hospitality Trends Report identifies is the dual-brand hotel. This is also a trend with which KRG Hospitality is well acquainted, both through industry research and client projects.

So far, the most common approach tends to include two towers, a shared lobby and fitness center, and shared F&B concepts. However, there are properties that incorporate not only brand-specific design for each tower but separate the bars and restaurants as well.

Notably, Marriott opened the first-ever tri-brand hotel in Nashville in 2019. The hotel and resort colossus combined an AC Hotel, a Residence Inn, and a SpringHill Suites.

Another interesting hotel trend? Eco-friendly, pre-fab construction. An excellent example of this approach is Moliving. To learn more about this brand, check out Bar Hacks podcast episode 68 with Jordan and Hanna Bem.

Interest by consumers in supporting eco-friendly brands informs two other trends identified by af&co. and Carbonate. One of these is hotels and resorts including e-bikes among their amenities.

Another is rewarding guests for engaging in a number of green initiatives. For example, cleaning up the beach in front of a hotel, or helping to plant trees on or near the property.

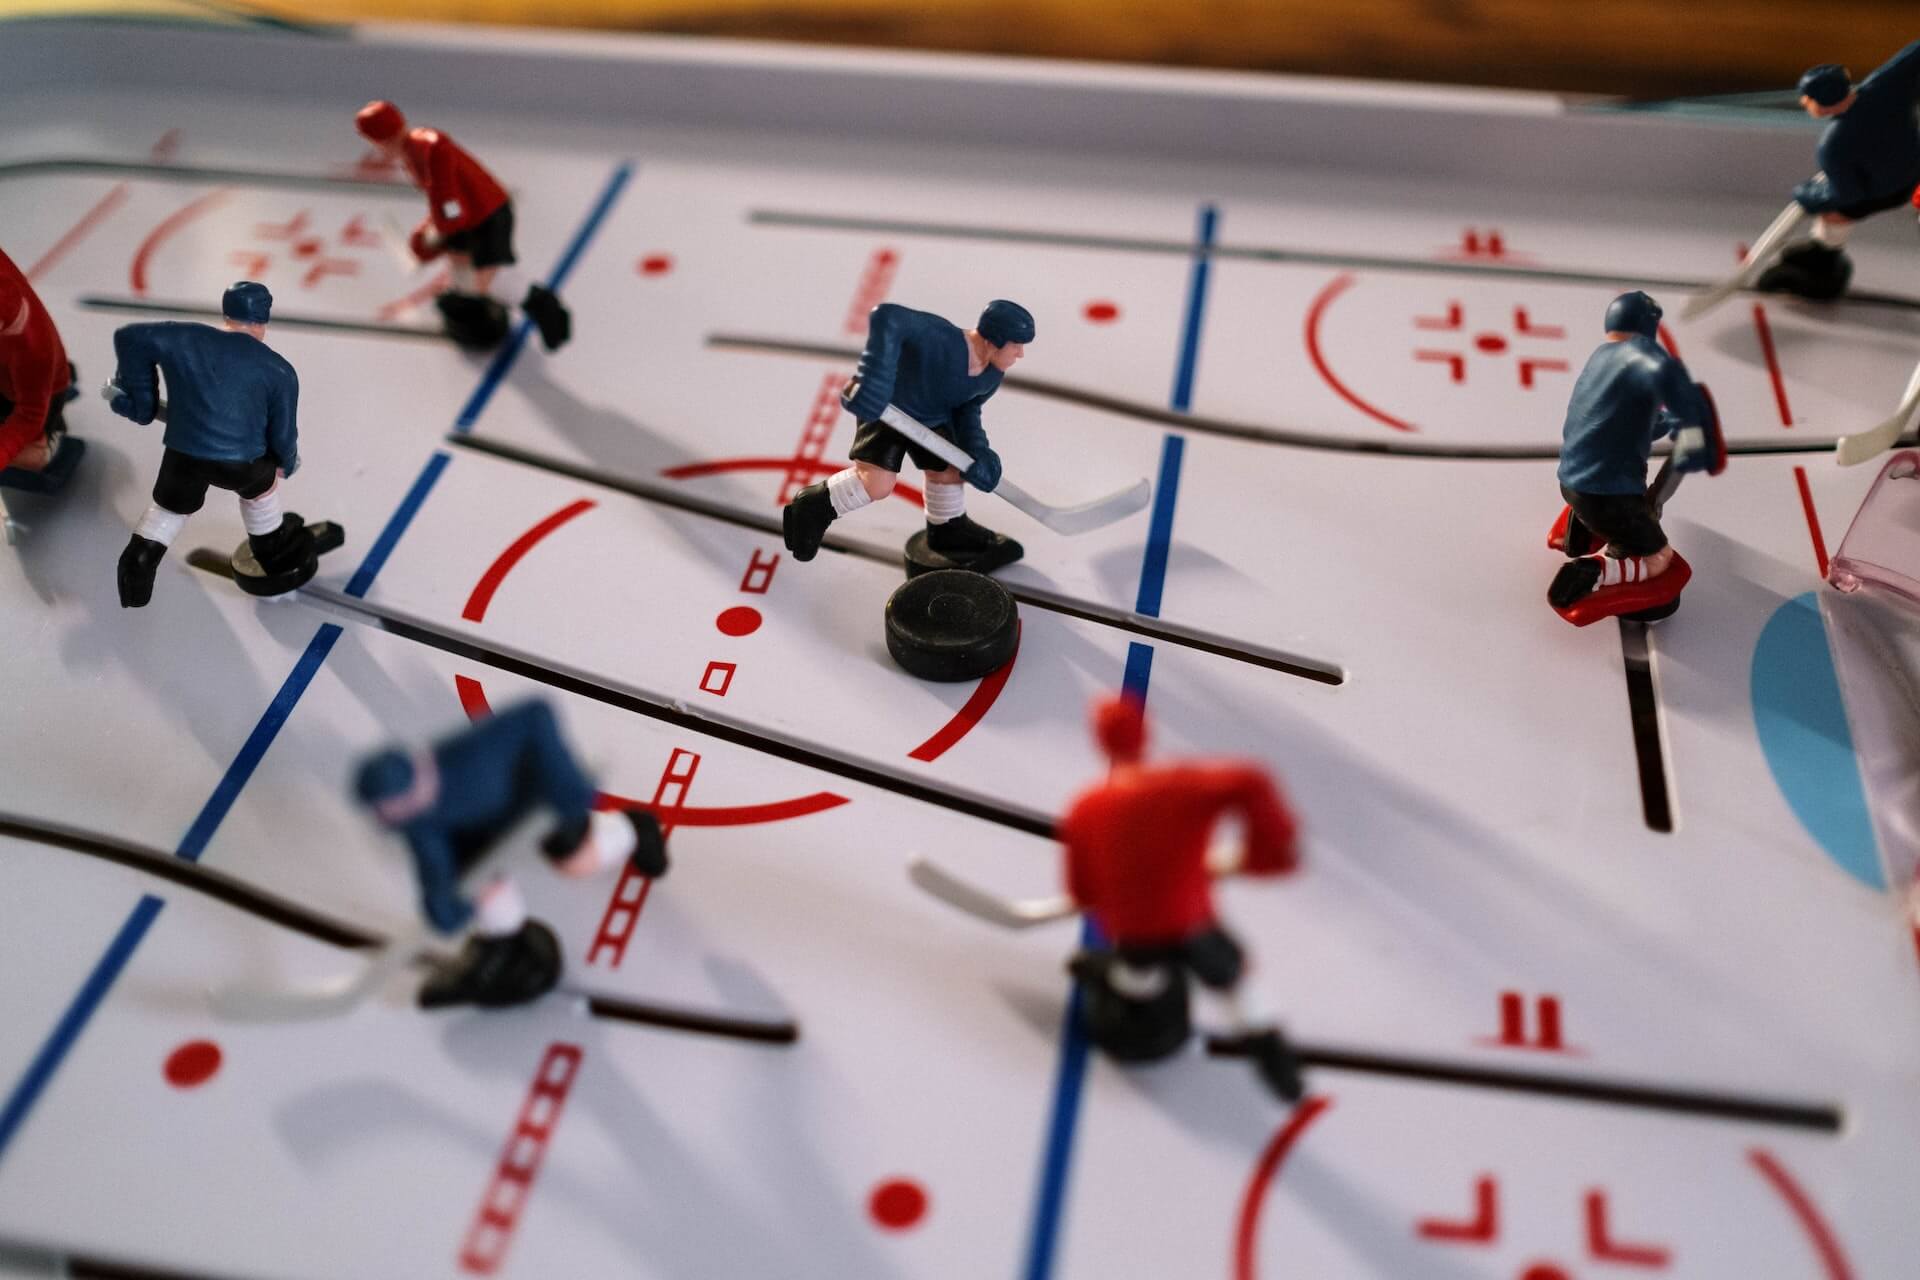
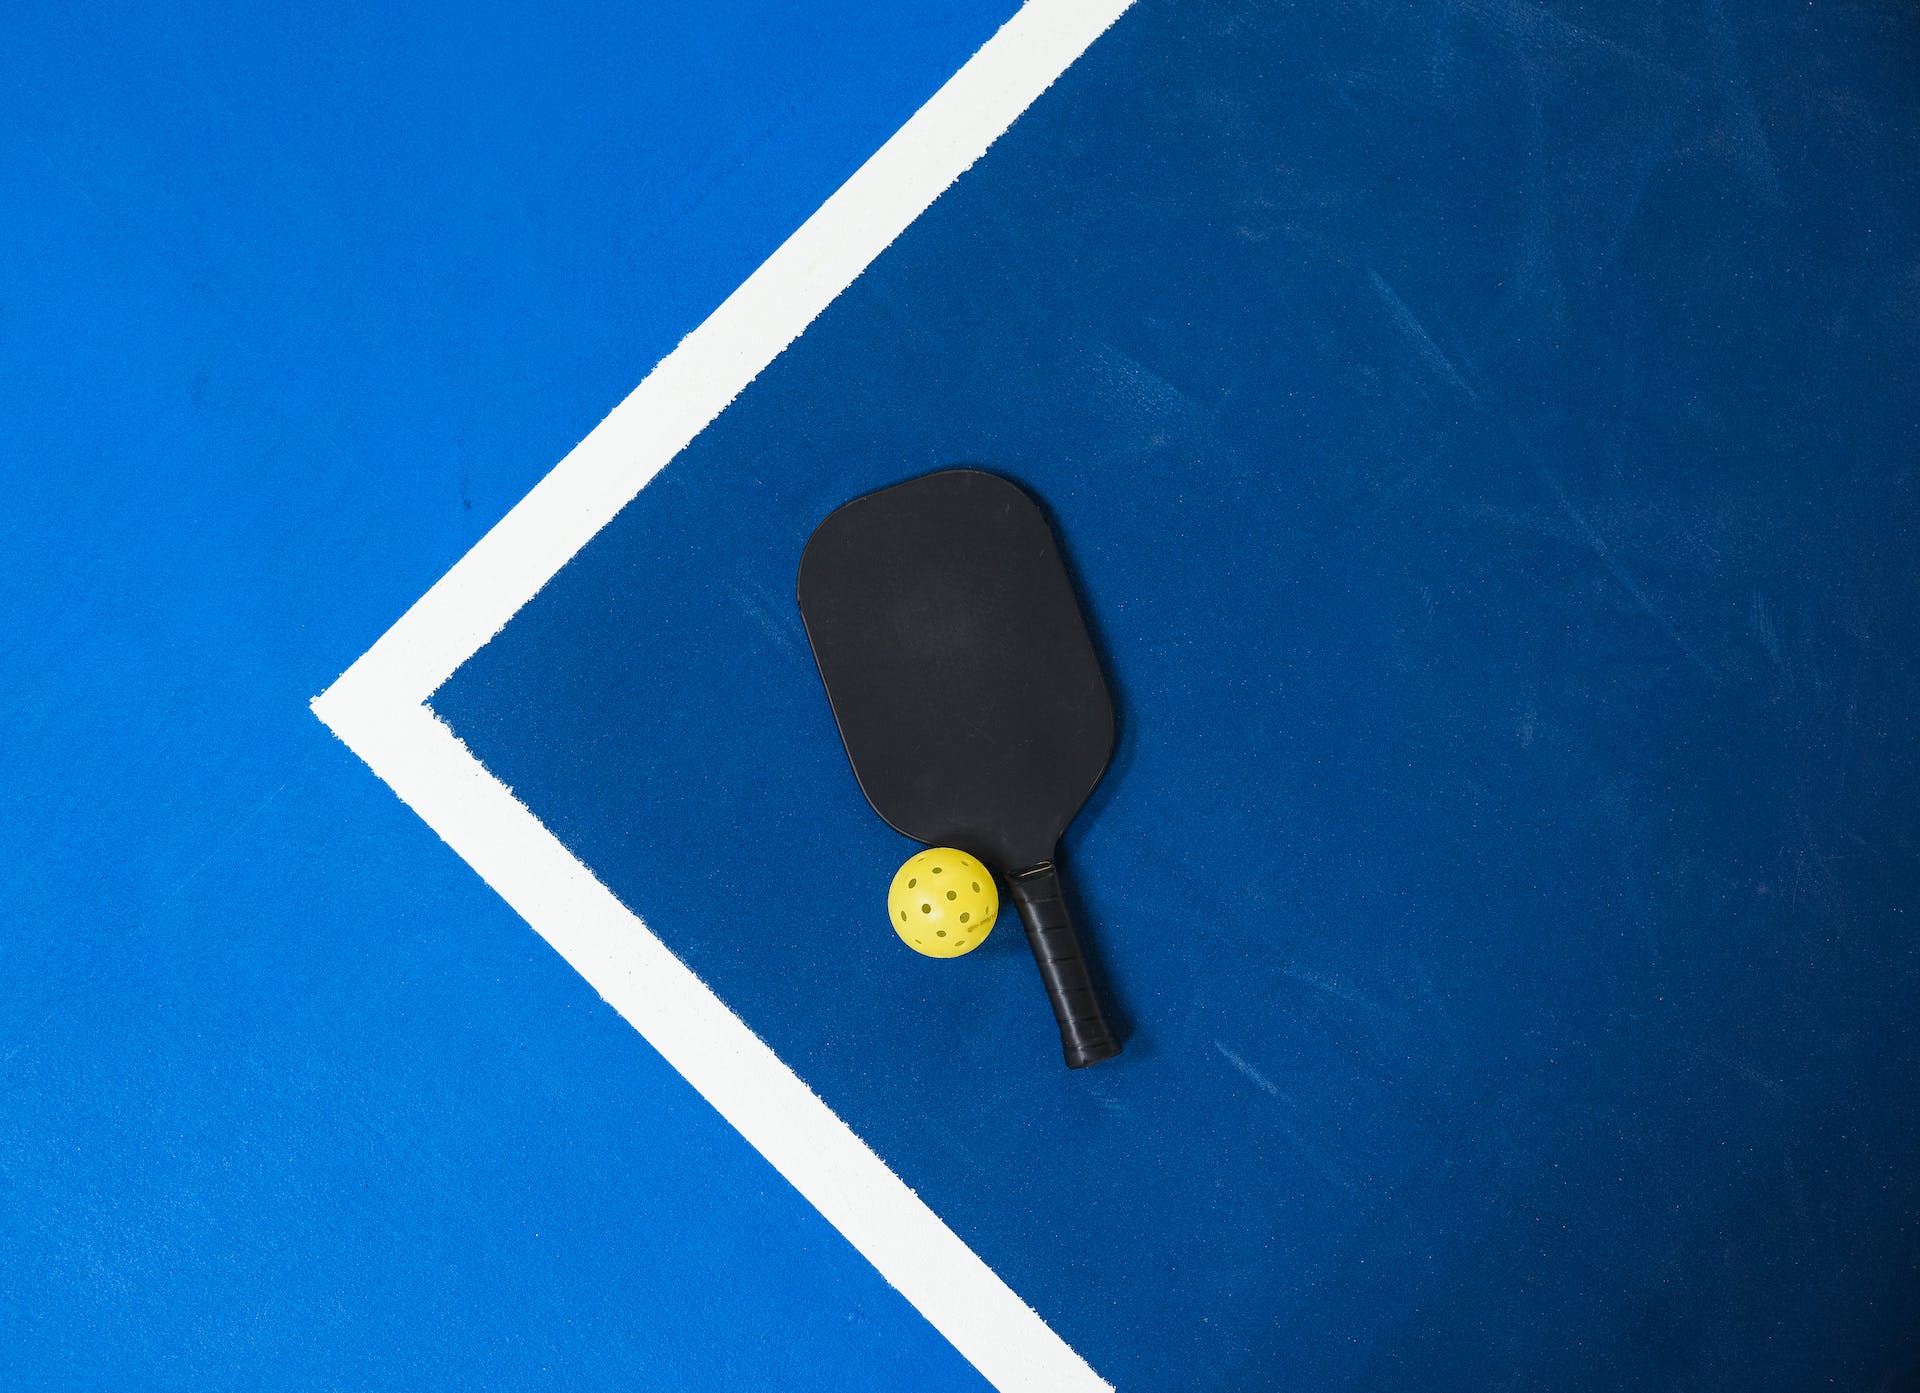
Speaking further of amenities, hotel and resort operators are likely aware that if they have courts for racquet sports, they need to include pickleball.

Design

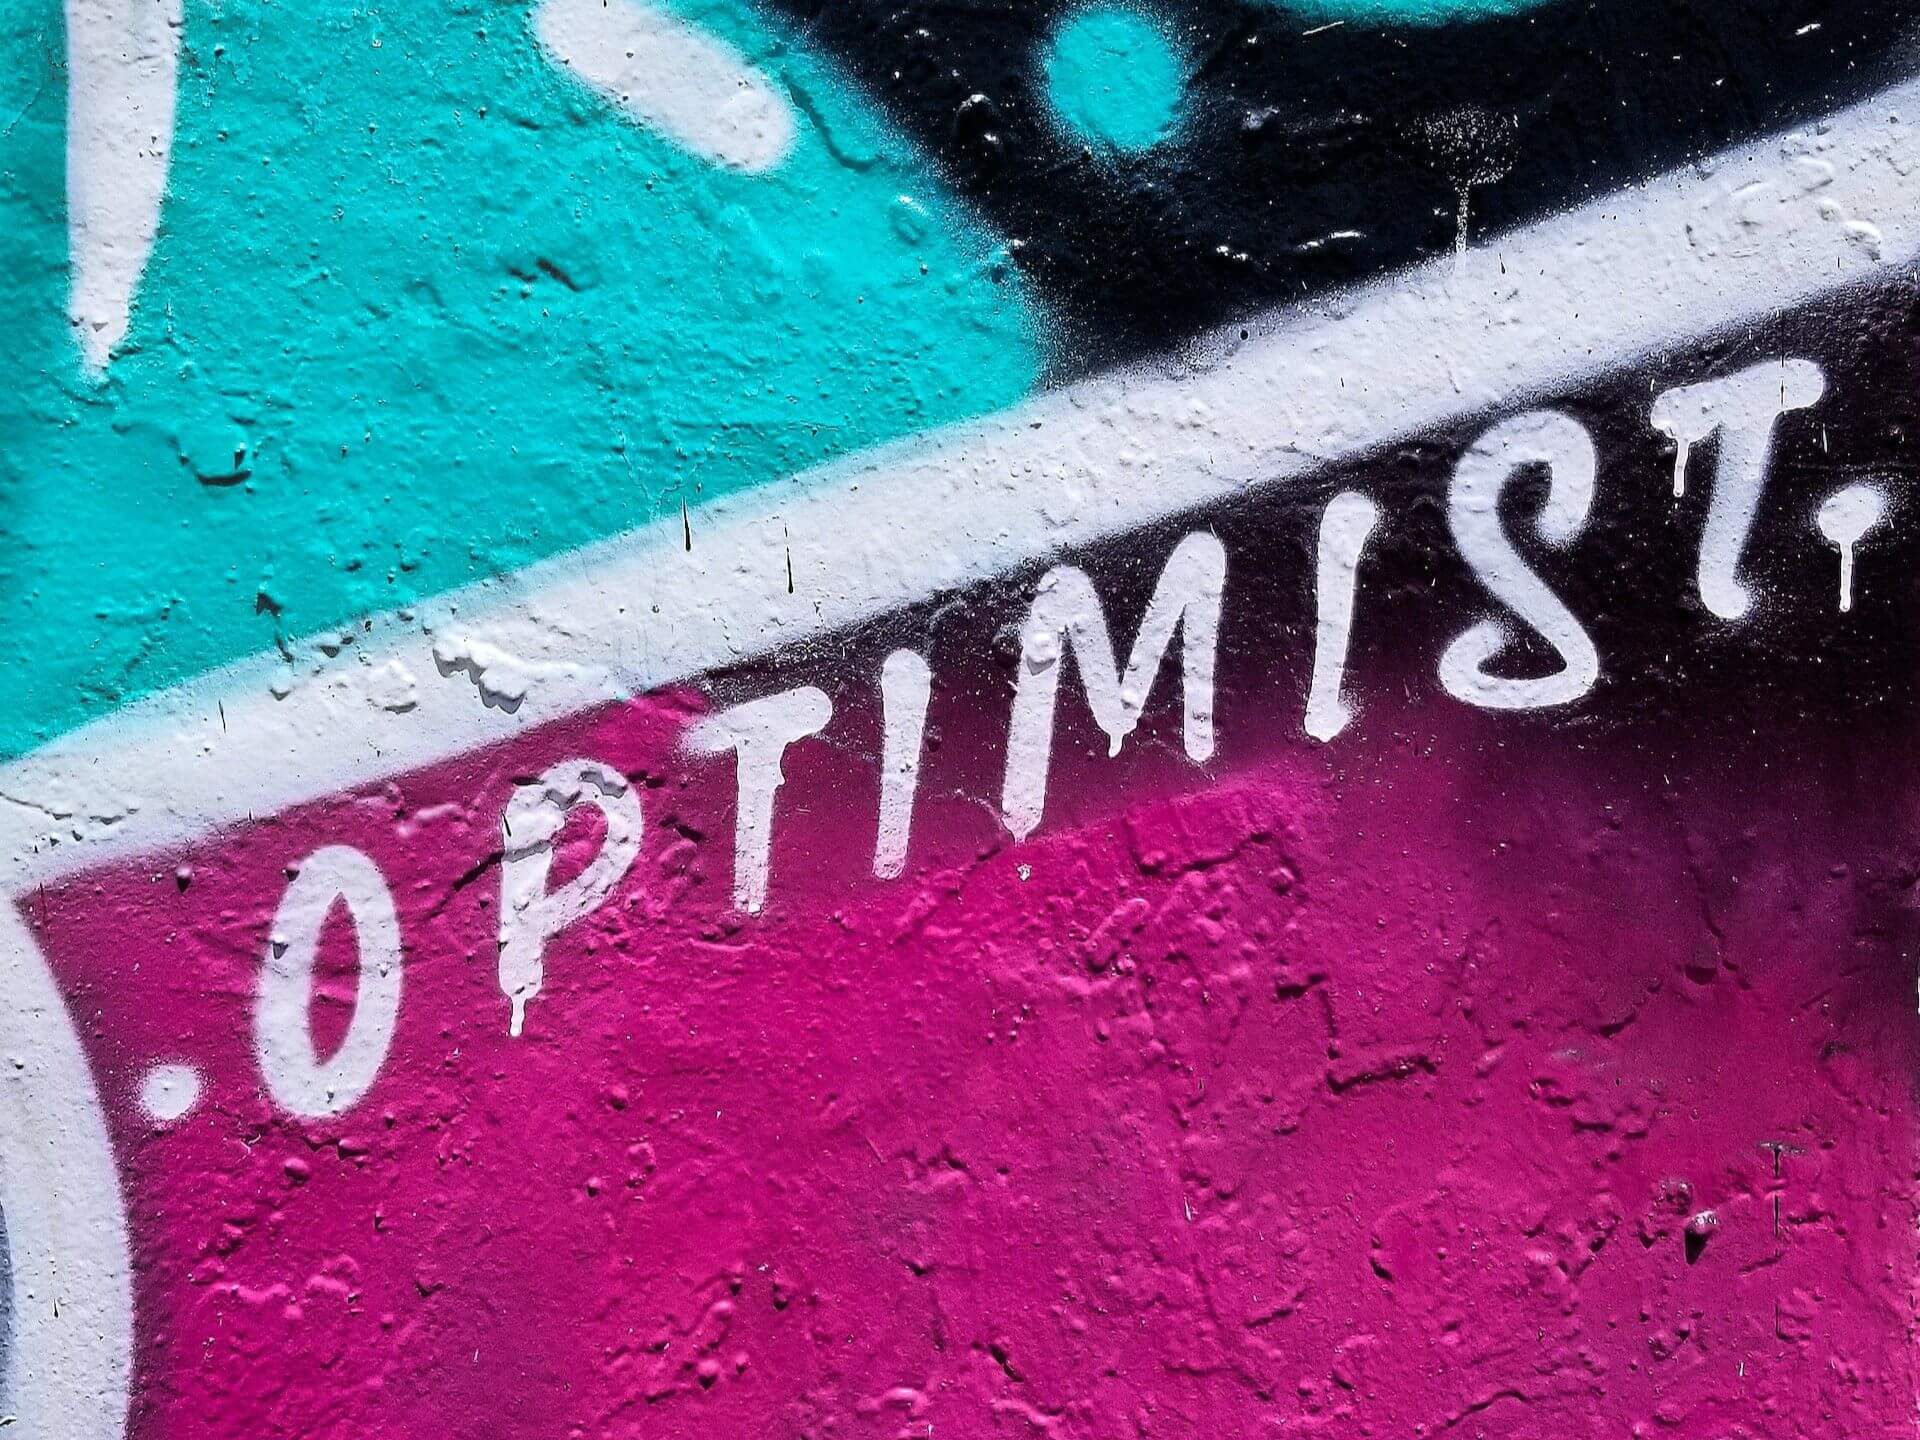
Operators considering a refresh or starting from a clean slate for a new space may want to work with a designer on the following approach: maximalism.

According to the 16th annual Hospitality Trends Report, this bold, playful design language is on the rise. Following this trend, af&co. and Carbonate think that maximalism is working particularly well for “concept-driven, design-forward” bars.

As far as colors and materials operators may want to ask designers about, the agencies suggest pink, bronze, gold, and velvet. These colors are warm and welcoming, exactly what a hospitality venue should be.

To download the Hospitality Trends Report, click here. Two categories not covered in this article are Marketing Ideas and Social Media Trends, so follow that link!

Image: Mason Tuttle on Pexels

Bar Nightclub Pub Brewery Menu Development Drinks Food

by David Klemt David Klemt No Comments

2023 State of the Menu: Datassential

2023 State of the Menu: Datassential

by David Klemt

Korean fried chicken wings

The annual 2023 State of the Menu by Datassential includes an interesting metric to gauge restaurant recovery: menu size by segment.

Hosts Jack Li, Mike Kostyo, and Claire Conaghan discuss a handful of topics during this webinar. Host Li touches on food-forward cities at the beginning of this presentaiton. Kostyo shares some of the most innovative menu items out there right now. And Conaghan dives deep into menu trends.

Industry professionals interested in watching this webinar on demand can register to do so here.

There are a handful of metrics people are using to measure post-pandemic restaurant recovery. Labor is, of course, receiving a lot of attention. People are also tracking traffic, average check size, revenue, and profits.

One metric Datassential is keeping tabs on is menu size per restaurant segment. Additionally, they’re tracking each segment’s top-growing food and beverage items.

Notably, however, in tracking menu size, Conaghan focuses solely on food and non-alcohol beverage items, omitting catering and alcohol.

Chains vs. Independents

Starting things off, Conaghan addresses the overall menu size trend. That is, menus are noticeably smaller in comparison to pre-pandemic sizes.

Interestingly, chain restaurants don’t appear to be in any rush to move away from this trend. In fact, Conaghan notes that chains appear to be further reducing the size of their menus. This has been the trend over the past 12 months.

According to Conaghan, fine dining also seems to be happy to shrink their menus. Menu size shrunk the most among restaurants in this segment. In comparison, quick-service menu sizes decreased the least.

However, independent restaurant operators appear to be going in the opposite direction from their chain counterparts. In contrast, indies have been growing the size of their menus the past 12 months.

Menu Size by Segment

Fast Casual

Per Conaghan, the only segment to reach pre-pandemic menu size is fast casual. In fact, this category of restaurant is often exceeding pre-pandemic items-per-menu size.

This increase in menu size is attributable to operators “leaning into” core cuisine items. For example, sandwiches, Mexican entrees, and pizza.

However, the fastest-growing food item on fast-casual menus is the chicken wing. According to Conaghan, it’s easy for operators to innovate with chicken wings.

A restaurant doesn’t have chicken wings? All they have to do is add them, starting with simple preparations. If a restaurant does have chicken wings on the menu already, innovation is as simple as adding new flavors.

As far as the fastest-growing drink for fast-casual restaurants, it’s dessert beverages.

QSR, Casual Dining, and Midscale

These three segments are “very, very close” to reaching pre-pandemic menu sizes.

As midscale operators are likely very aware, this segment tends to have the largest menus. I wouldn’t be surprised, therefore, if a number of midscale concepts review their items per menu, their costs, and decide they can perform well with slightly smaller menus moving forward.

Unsurprisingly, chicken wings are the food item growing most quickly on QSR food menus. Oh, and barbecue chicken wings are the fastest-growing food item among casual dining restaurants.

Perhaps a bit more eyebrow-raising is the fastest-growing beverage type for QSRs: energy drinks. Boba and flavored iced teas are growing fastest on casual-dining drink menus.

For midscale restaurants, dessert samplers are the fastest-growing food items. Think “dessert charcuterie” when trying to picture a dessert platter. Another way to think about the dessert sampler is a static dessert cart with small bites of each dessert on the menu.

Fine Dining

Again, this segment is the furthest from pre-pandemic menu size. And, again, operators in this category seem happy with this trend.

An interesting note Conaghan makes about this segment is what many operators are using to fill out their menus: desserts. This is, she says, an area where fine dining can differentiate itself from other concepts.

Per Conaghan, bao, applesauce, and summer squash are growing the fastest on fine-dining food menus.

Now, I may have slipped into a fever dream during this portion of the Datassential webinar. Because unless I’m mistaken, the Shirley Temple has been identified as the fastest-growing beverage in the fine-dining space.

Pricing

Okay, so this segment of the 2023 State of the Menu webinar isn’t really a recovery metric.

However, it’s interesting, and something Jack Li says about chain restaurant pricing made me chuckle.

Most Expensive vs. Least Expensive

First, some straightforward data.

The following list identifies the five most-expensive ZIP codes for chain restaurant menu pricing. Anyone who wants the full list of 15 most-expensive ZIP codes can watch the webinar.

  • 10036 (New York, NY)
  • 96707 (Kapolei, HI)
  • 98902 (Yakima, WA)
  • 96815 (Honolulu, HI)
  • 99503 (Anchorage, AK)

It’s understandable to think this would consist entirely of New York City, Los Angeles, or San Francisco ZIPs. But when we consider what it costs operators to import food to Hawaii and Alaska. Additionally, Washington and New York are among the states with the highest minimum wage. Operators need to recover those costs somehow.

And now the five least-expensive ZIP codes:

  • 78526 (Brownsville, TX)
  • 75224 (Dallas, TX)
  • 76106 (Fort Worth, TX)
  • 31907 (Columbus, GA)
  • 31701 (Albany, GA)

Pricing Logic

Now, on to what Li says during the webinar that makes me laugh.

Nationwide, the average price of a McDonald’s Big Mac in the US is $5.26. (A caveat: This webinar took place in October. This price may have increased or decreased by now.)

However, the lowest price for a Big Mac is $3.49 at a location in Wilburton, Oklahoma.

So, what’s the highest price, and where can one find these pricey Big Macs? Three McDonald’s locations sell the burger for $8.29. That’s nearly two-and-a-half times the lowest-priced Big Mac.

Summarizing pricing variations among chain restaurants succinctly, Li made me laugh with the following: “Store pricing often just doesn’t make sense.”

Going further, Li says Datassential shows that the more franchised a restaurant chain is, the more variances in pricing will occur.

The full webinar can be viewed here.

Image: Leonardo Luz on Pexels

Bar Nightclub Pub Brewery Menu Development Drinks Food

by David Klemt David Klemt No Comments

Wallethub Ranks Best Foodie Cities in US

Wallethub Ranks America’s Best Foodie Cities

by David Klemt

Eola Lake Park in Orlando, Florida

Comparing 182 cities across more than two dozen “food-friendliness” indicators, Wallethub has revealed their rankings for America’s best foodie cities in 2023.

Why 182 cities? Wallethub started with 150 of America’s most-populous cities. Then, they added “at least two” of the most-populous cities in each state.

Regarding the ranking itself, Wallethub compared the cities against two key measures: affordability, and diversity, accessibility, and quality. Those two measures consist of 28 key indicators, including:

  • cost of groceries;
  • restaurant meal cost;
  • sales tax;
  • food tax;
  • restaurants per capita;
  • ratio of full-service to fast-food restaurants; and
  • restaurant diversity.

Using a 100-point grading system, affordability was worth up to 30 points. Simple math shows diversity, accessibility, and quality indicators were worth up to 70 points.

Further, Wallethub valued indicators anywhere from half-weight (international grocery stores per capita) to triple weight (restaurants per capita).

Now, it’s important to contextualize Wallethub’s use of the word “foodie city” here. For their ranking, the company is identifying “the best and cheapest” cities for consumers for whom eating is an experience, hobby, and/or lifestyle.

“These wallet-friendly cities cater to diners who prefer to cook at home, explore the local flavors or both,” reads their post, which can be reviewed in its entirety here.

The Top 25

So, per Wallethub, the cities below are the top 25 among the 182 “best foodie cities in America in 2023.”

  1. Orlando, Florida
  2. Portland, Orgeon
  3. Sacramento, California
  4. Miami, Florida
  5. San Francisco, California
  6. Tampa, Florida
  7. San Diego, California
  8. Las Vegas, Nevada
  9. Austin, Texas
  10. Seattle, Washington
  11. Denver, Colorado
  12. Atlanta, Georgia
  13. Los Angeles, California
  14. Chicago, Illinois
  15. Richmond, Virginia
  16. Pittsburgh, Pennsylvania
  17. Washington, DC
  18. St. Louis, Missouri
  19. Houston, Texas
  20. New York, New York
  21. Oakland, California
  22. Phoenix, Arizona
  23. Santa Ana, California
  24. Grand Rapids, Michigan
  25. Cincinnati, Ohio

Interestingly, you’ll find the “usual” foodie scene suspects on this list. However, a mere handful of those cities are ranked in the top ten: Miami, San Francisco, and Las Vegas.

Chicago (14), Los Angeles (13), and New York (20) don’t make the three or five. In fact, they’re out of the top ten entirely here.

If affordability is a major factor here, it raises an eyebrow that Miami is among the top five foodie cities. After all, sources show the cost of living in the city is 20 percent higher than the national average. The cost of living in San Francisco is nearly 80 percent higher.

At any rate, Orlando, per Wallethub’s methodology, is the number-one foodie city in America.

Compelling Comparisons

With the top 25 foodie cities out of the way, let’s check out a few other interesting comparisons.

Cost of Groceries

Lowest-cost cities, in descending order:

  1. Brownsville, Texas
  2. Corpus Christi, Texas
  3. Laredo, Texas
  4. Fayetteville, North Carolina
  5. Austin, Texas

The cities with the highest cost of groceries are Honolulu and Pearl City in Hawaii.

Restaurants per Capita

The cities with the most restaurants per capita, again in descending order:

  1. Miami, Florida
  2. Orlando, Florida
  3. Las Vegas, Nevada
  4. San Francisco, California
  5. Los Angeles, California

It’s important to note each of the cities on this list is, per Wallethub, tied for first place.

The city with the fewest restaurants per capita is Pearl City, Hawaii.

Ratio, FSR to Fast Food Restaurants

On this list, the five cities with the highest ratio of full-service restaurants to their fast-food counterparts (yes, in descending order):

  1. Cape Coral, Florida
  2. Santa Rosa, California
  3. Portland, Maine
  4. Burlington and South Burlington, Vermont

That leaves the city with the lowest ration, which is Jackson, Mississippi.

The Bottom Ten

Now that we know which cities Wallethub identifies the best foodie cities in the US, let’s take a look at the bottom of their list.

  1. Augusta, Georgia
  2. Fontana, California
  3. Jackson, Mississippi
  4. Moreno Valley, California
  5. Mobile, Alabama
  6. Montgomery, Alabama
  7. West Valley City, Utah
  8. Nampa, Idaho
  9. Shreveport, Louisiana
  10. Pearl City, Hawaii

Personally, I find the data regarding restaurants per capita and the FSR to fast-food ratio the most useful.

To review this report in its entirety, including Wallethub’s methodology, please click here.

Image: Mick Haupt on Unsplash

Bar Pub Brewery Nightclub Club Nightlife Concept Development

by David Klemt David Klemt No Comments

US Restaurant Employment Still Short

US Restaurant Employment Creeping Toward February 2020 Levels

by David Klemt

Restaurant door handle that says "push"

Keep pushing. We have work to do to reach February 2020 employment levels.

After what appeared to be a strong September 2023, restaurants and bars saw a decline of 7,500 jobs in the month of October.

In fact, the strong numbers from September were notably weaker once revised. After revisions, eating and drinking businesses added 48,300 jobs, not the nearly 61,000 from preliminary reports.

Importantly, a correction in employment numbers for August 2023 has revealed further declines. Initially, reports stated that restaurants had added 14,400 jobs. Unfortunately, the corrected number showed that restaurants shed 9,300 positions.

However, context is important. Notably, the unemployment rate in the US has remained under four percent for nearly 24 months. As of the latest reporting by the US Bureau of Labor Statistics, unemployment is at 3.9 percent.

Numbers by Restaurant Category

The data in this subsection comes from the National Restaurant Association. As the NRA notes, this information is based on data from September 2023.

These numbers should provide further context for restaurant and bar’s current situation. Some restaurant categories are struggling more than others to reach or surpass pre-pandemic levels of employment.

Below, employments numbers for September 2023 in comparison to February 2020.

  • Full-service: -214,000 jobs
  • Quick-service and Fast Casual: +128,000 jobs
  • Bars and Taverns: +50,000 jobs
  • Cafeterias and Buffets: -36,600 jobs
  • Catering and Mobile Food Service: +14,900
  • Snack and Non-alcohol Beverage Bars: +107,000 jobs
  • Foodservice Contractors: +15,100 jobs

As you can see, full-service restaurants are struggling the most to reach pre-pandemic employment numbers. However, QSRs and bars have surpassed that milestone.

By the Numbers

Below, the change in employment in each state and Washington, DC. The time period the data span runs from September 2019 to September 2023*.

  • Alabama: -5,700 (-3.4%)
  • Alaska: +100 (+0.4%)
  • Arizona: +18,200 (+7.6%)
  • Arkansas: +7,900 (+8.1%)
  • California: +32,700 (+2.2%)
  • Colorado: +9,100 (+3.8%)
  • Connecticut: -1,200 (-1.0%)
  • Delaware: +2,500 (+6.4%)
  • District of Columbia: -2,500 (-4.5%)
  • Florida: +35,200 (+4.4%)
  • Georgia: +21,800 (+5.5%)
  • Hawaii: -4,900 (-6.9%)
  • Idaho: +7,000 (+11.5%)
  • Illinois: -11,000 (-2.3%)
  • Indiana: +7,900 (+3.2%)
  • Iowa: -200 (-0.2%)
  • Kansas: +4,800 (+4.7%)
  • Kentucky: -400 (-0.2%)
  • Louisiana: -9,000 (-5.2%)
  • Maine: -4,000 (-7.9%)
  • Maryland: -16,700 (-8.0%)
  • Massachusetts: -15,600 (-5.6%)
  • Michigan: -21,400 (-6.3%)
  • Minnesota: -9,000 (-5.2%)
  • Mississippi: -1,700 (-1.7%)
  • Missouri: -3,500 (-1.5%)
  • Montana: +4,500 (+10.7%)
  • Nebraska: +600 (+0.8%)
  • Nevada: +22,300 (+16.7%)
  • New Hampshire: -1,500 (-2.9%)
  • New Jersey: +7,400 (+2.7%)
  • New Mexico: +3,100 (+4.2%)
  • New York: -10,000 (-1.4%)
  • North Carolina: +12,900 (+3.3%)
  • North Dakota: -100 (-0.3%)
  • Ohio: -6,300 (-1.4%)
  • Oklahoma: +3,600 (+2.5%)
  • Oregon: -2,000 (-1.2%)
  • Pennsylvania: -5,600 (-1.3%)
  • Rhode Island: -2,000 (-4.3%)
  • South Carolina: +1,000 (+0.5%)
  • South Dakota: +3,100 (+9.4%)
  • Tennessee: +8,000 (+3.0%)
  • Texas: +74,200 (+6.6%)
  • Utah: +12,900 (+12.0%)
  • Vermont: -1,000 (-4.7%)
  • Virginia: -100 (-0.0%)
  • Washington: +3,900 (+1.5%)
  • West Virginia: -2,600 (-4.6%)
  • Wisconsin: -8,100 (-3.8%)
  • Wyoming: -100 (-0.5%)

Ups and Downs

First, the less-positive news: restaurant employment is below pre-pandemic levels in more than half of the country. Including Washington, DC, 27 states are still lagging behind September 2019.

However, in some cases the change is negligible.

For example, Wyoming is down just 0.5 percent, and Virginia is down just 100 jobs or 0.00033 percent. Of the 27 states seeing declines, 20 are down less than five percent in comparison to September 2019.

Of course, it’s important to note that Hawaii, Michigan, and Massachusetts are down more than five percent.

So, to the good news. Two dozen states are enjoying restaurant and bar employment above September 2019 levels.

Four states are up more than ten percent. Nevada is leading the way, up 16.7 percent. Next is Utah, up 12 percent. Following in third is Idaho, up 11.5 percent.

Takeaways

Restaurant employment’s pre-pandemic peak was in February 2020. As of the most-current data, we’re down 14,000 jobs.

According to the most recent data, restaurants and bars employ 12.32 million people in the US. While we have yet to reach the 12.34 million that were employed in February 2020, we’re not far off. We still have reason to be positive about recovery.

The larger threat looming over operators is rising costs. Additionally, depending on the source, a recession is either a possible or current threat.

Of course, there’s still increasing demand from consumers to gather at restaurants and bars. So, again, there’s reason to remain positive.

This is all to say that numbers without deeper understanding and nuance only provide surface context. They can make us panic or breathe a sigh of relief, seemingly at the drop of a hat. We can either worry that we haven’t reached the pre-pandemic milestone, be positive that we’ll reach that number in the near future, or decide that perhaps that metric shouldn’t be the primary one by which we measure recovery.

In short, operators positioning themselves for long-term success understand their market, their teams, and their guests; focus on staff and guest retention; develop community engagement and support; and have strategic clarity.

*Sources: US Bureau of Labor Statistics, National Restaurant Association

Image: Tim Mossholder on Unsplash

Bar Nightclub Pub Brewery Winery Staff Talent Consulting

by David Klemt David Klemt No Comments

2023 DoorDash Ordering Trends

2023 DoorDash Ordering Trends: Canada & US

by David Klemt

Canada and the United States of America on a globe

After checking out this year’s annual Cravings Report we’re turning our attention to the 2023 DoorDash restaurant ordering trends reports.

Luckily, there are two reports available from DoorDash: one that focuses on Canada, and one for the US.

These two countries are, of course, KRG Hospitality’s primary markets. So, the data in these DoorDash reports is relevant and compelling for our current and future clients.

Perhaps unsurprisingly, Canadian and American DoorDash users are somewhat similar by a few metrics. However, where there are differences they’re fairly glaring.

For example, 78 percent of Canadian DoorDash survey respondents picked up a takeout order from a restaurant in the month prior to being surveyed. That number is 76 percent for American survey respondents.

Regarding in-person restaurant dining, 62 percent of respondents had done so the month prior. Among American survey respondents that number is 61 percent.

But when it comes to placing an order for delivery we see a notable difference. For Canada, 58 percent of survey respondents had ordered delivery. That number jumps to 77 percent among Americans.

This tells me a few (fairly obvious) things. Generally speaking, it appears consumers in Canada and America—according to DoorDash—prefer delivery and takeout to in-person dining. Going further, it seems that overall, Canadians prefer pickup or takeout to delivery. However, Americans seem to place delivery and pickup orders at nearly identical rates.

If it’s true that consumers favor delivery or takeout to in-person dining currently, there could be a couple of simple reasons. First, convenience.

Second, fees. It’s possible that today’s consumer perceives delivery fees are lower than in-person dining fees, unfortunately. If that’s the case, third-party delivery services can exploit this perception.

More Similar than Different

In comparing both DoorDash reports, I find that Canadian and American consumers who use DoorDash are rather similar.

Survey respondents in both countries indicate that Friday is the most popular day of the week to order food. Further, 6:00 PM is the most common local time to place orders in both countries.

And when it comes to the fastest-growing dayparts for order placement? In both Canada and the US it’s late-night and breakfast. Although, I most note that both dayparts are growing faster in Canada.

Nearly half of American respondents and a little over half of Canadian respondents indicate they want to try new restaurants and dishes.

Definitely not surprisingly, consumers in both countries primarily focus on menu selection and pricing when seeking a new restaurant to try. In fact, these numbers are identical for Canadians and Americans, at 55 percent and 51 percent, respectively.

Top Canadian Food Orders

When we look at the top items ordered via DoorDash, we don’t find anything out of the ordinary.

  1. Burgers
  2. Fries
  3. Pizza
  4. Salad
  5. Sandwiches

Looks like standard fare and comfort foods to me. This tells me that operators who have these items on their menus need to ensure they’re of the highest quality to stand out from other restaurants and bars.

Top American Food Orders

Interestingly but not too surprisingly, the list below is quite similar to the list above.

  1. French fries
  2. Burgers
  3. Tacos
  4. Salad
  5. Pizza

With the exception of tacos and sandwiches, the list is nearly identical.

Hey, who wants to debate whether tacos and sandwiches are in the same food family?

I encourage you to review both reports in their entirety for yourself. For the Canadian Edition of DoorDash’s report, click here. And click here for the US edition.

Image: Lara Jameson on Pexels

Bar Pub Brewery Nightclub Club Nightlife Technology Plan Tech Stack

by David Klemt David Klemt No Comments

2023 Cravings Report: “The Most” Orders

2023 Uber Eats Cravings Report: “The Most…” Orders

by David Klemt

Kentucky Fried Chicken packaged for delivery or pickup

Let’s take a look at the top orders, delivery requests, order combinations, surprising pairings, and more from the 2023 Uber Eats Cravings Report.

It appears that the chicken sandwich dominance we’ve seen over the years is winding down. At least, that seems to be the case among Uber Eats users.

As you’ll see below, not only is the chicken sandwich not the most popular item, it’s not even among the top five. It does edge out the cheeseburger and wings among the most popular combos, but it doesn’t outperform French fries and salt as a combo.

Another eyebrow-raising detail? Pizza doesn’t show up anywhere among the most ordered items, most popular combos, or even the most surprising combos.

Now, if you’re curious about the 2022 Uber Eats Cravings Report, you’re in luck. You can click here for the top food orders from that report, and here for the top beverage orders.

The Most…Ordered Items

  • French fries
  • Garlic naan
  • Pad Thai
  • Miso soup
  • California roll

Am I the only one who expected to see burgers, chicken sandwiches, and pizza on this list?

The Most…Popular Combos

  1. Burrito bowl + cheese
  2. French fries + salt
  3. Chicken sandwich + shredded lettuce
  4. Cheeseburger + mustard
  5. Wings + ranch

Fairly standard, really. Every one of these orders makes complete sense. Now, the category coming up next…it’s a different story.

However, before we move on, let’s compare these items to those found on the 2022 Uber Eats Cravings Report.

Interestingly, the number-one item is nearly identical: burrito + cheese. And French fries + salt is the second most-popular item on both lists.

The Most…Surprising Combos

  1. Steak + jelly
  2. Cottage cheese + mustard
  3. Condensed milk + avocado
  4. Seaweed + pasta sauce
  5. Butter + pickled onions

I really have nothing to say after reviewing this short list. I mean…hey, do your thing, everyone. Make your order yours.

To the operators out there, be ready for some odd order combos.

The Most…Popular Requests

  1. No onions
  2. Dressing on the side
  3. Ranch
  4. Extra soy sauce
  5. Spicy
  6. Sauce on the side
  7. No lettuce
  8. No jalapenos
  9. Extra gravy
  10. No slaw

Looking at the top request, Uber Eats has a theory as to what’s driving it: the return to the office.

People, it appears, are self-conscious about their breath in an in-person, face-to-face setting.

The Most…Popular Food and Alcohol Combos

  1. Ribeye + Vodka
  2. Cheeseburger + Frozen Margarita
  3. Chicken + Frozen Piña Colada
  4. Lobster tail + Apple whiskey
  5. Tamales + Daiquiris

Last year’s report reveals the following combos:

  1. Steak + Margaritas
  2. Pizza + White Claw
  3. Burritos + Margaritas
  4. Chicken + Sangria
  5. Wings + Beer

Overall, a lot of change from the 2022 Cravings Report to this year’s report.

Image: Nik on Unsplash

Bar Nightclub Pub Brewery Menu Development Drinks Food

by David Klemt David Klemt No Comments

Brand Love: BrandVue’s 2023 Rankings

Brand Love: BrandVue’s 2023 Rankings

by David Klemt

Black and white image of a winners' podium under a spotlight

As we near the end of the year, Savanta has revealed their BrandVue’s Most Loved Eating Out Brands 2023 report, ranking 100 restaurant brands in America.

The B2B and B2C market consultancy has been publishing this report since 2019. Their fifth-annual report includes 16 categories, including ranking consumer opinion of third-party delivery services.

As a category, Burger boasts the greatest presence with 17 loved restaurant brands. In second is Italian or Pizza with 13 brands. With ten brands, Specialty comes in third as a category. Tied for fourth are Mexican and Chicken, featuring eight brands each.

Download the full report here.

Top Restaurant in Each Category

Below you’ll find the gold medalist in each category, in alphabetical order by restaurant type.

  • Asian: Panda Express
  • Burger: McDonald’s
  • Café or Bakery: Starbucks
  • Chicken: Chick-fil-A
  • Family Style: Cracker Barrel Old Country Store
  • Frozen Dessert: Cold Stone Creamery
  • Italian or Pizza: Olive Garden
  • Mexican: Taco Bell
  • Sandwich: Subway
  • Seafood: Red Lobster
  • Specialty: Krispy Kreme
  • Steak: Texas Roadhouse
  • Varied Menu: The Cheesecake Factory

Other Categories

There are a handful of other categories on the BrandVue list. Namely, Delivery, Sports Bar, and Meal-kit.

I’ve separated Delivery in particular because it doesn’t represent brick-and-mortar brands. Rather, these are third-party services.

For this year’s list, Savanta ranks five delivery services. Below, the top three:

  1. Caviar
  2. DoorDash
  3. UberEats

However, it’s important to note that DoorDash bought their one-time rival Caviar back in 2019. So, it’s really as though DoorDash claims two spots among the top three.

Of course, UberEats owns Postmates, which is among the five Delivery brands on this list. So is Seamless, owned by Grubhub. However, Grubhub itself doesn’t appear on this list.

The other two categories, Sports Bar and Meal-kit, count just one brand each among them: Buffalo Wild Wings and Plated, respectively.

Top 26 Restaurant Brands

Below, the top quarter of the 2023 BrandVue list. As you’ll see, the gold medalists among the top 25 are in bold.

Why did I decide to show the top 26 rather than the top 25? My reasoning is simple: one of the top 25 is a delivery service, not a brick-and-mortar restaurant.

  1. Domino’s (Italian or Pizza)
  2. Red Lobster (Seafood)
  3. Cold Stone Creamery (Frozen Dessert)
  4. Culver’s (Burger)
  5. Caviar (Delivery)
  6. Cinnabon (Specialty)
  7. Braum’s (Burger)
  8. Auntie Anne’s (Specialty)
  9. Wingstop (Chicken)
  10. Popeyes (Chicken)
  11. Wendy’s (Burger)
  12. Pizza Ranch (Italian or Pizza)
  13. Pizza Hut (Italian or Pizza)
  14. KFC (Chicken)
  15. The Cheesecake Factory (Varied Menu)
  16. Subway (Sandwich)
  17. In-N-Out Burger (Burger)
  18. Dunkin’ Donuts (Café or Bakery)
  19. Taco Bell (Mexican)
  20. Raising Cane’s (Chicken)
  21. Olive Garden (Italian or Pizza)
  22. Krispy Kreme (Specialty)
  23. Texas Roadhouse (Steak)
  24. McDonald’s (Burger)
  25. Starbucks (Café or Bakery)
  26. Chick-fil-A (Chicken)

Unsurprisingly, the top six spots go to gold medalists. In total, gold medalists claim seven slots amongst the top ten. Twelve of the top performers out of all 16 categories are in the top 25.

Interestingly, the list also puts America’s love for burgers, chicken, and pizza on full display. Of the top 25 most-beloved restaurant brands, five fall into the Burger category, and five fall into Chicken. Four slots belong to the Italian or Pizza category.

Notably, there are no Asian or Family Style restaurants among the top 26. However, I expect more Asian and Mexican restaurants to earn places in the top quarter over the next few years.

To see the full list of the 100 most-beloved restaurant (and delivery) brands in the US, click here.

Image: Joshua Golde on Unsplash

KRG Hospitality. Restaurant Business Plan. Feasibility Study. Concept. Branding. Consultant. Start-Up.

by David Klemt David Klemt No Comments

Leisure and Hospitality Adds 96,000 Jobs

Leisure and Hospitality Adds 96,000 Jobs

by David Klemt

"Optimist" graffiti

Update: The figure of 61,000 restaurant and bar jobs was adjusted to 48,300 after revisions.

The latest report from the US Bureau of Labor Statistics reveals that the outlook looks promising for hospitality.

Put together, leisure and hospitality added 96,000 jobs in September. However, hospitality certainly leads the way according to the most recent report.

In particular, the news is wonderful for the restaurant and bar sector. Adding 61,000 jobs in September, “food services and drinking places” are back to February 2020 levels.

Put more simply, restaurants and bars are back to pre-pandemic employment numbers. It has taken more than three years, but we can finally breathe a collective (but cautious) sign of relief.

In fact, one in five jobs created in September was in a restaurant or bar. That’s incredible growth and welcome news.

But reaching this point hasn’t been easy. Operators, along with restaurant and bar workers, have clawed their way through the past several years.

The industry has changed, and operators need to avoid the temptation of regressing. Yes, employment levels are back to where they were before the pandemic. Worker and guest expectations will not return to where they were before February 2020. The changes are here to stay.

Lodging/Accommodation

Unfortunately, not every sector of hospitality is back to pre-pandemic employment levels.

First, the positive news. Lodging (or accommodation, if you prefer) did add jobs in September. Whereas restaurants and bars rose 61,000 jobs, lodging is up 16,000.

That’s good growth and reason to be optimistic regarding that sector. That’s where the good news ends when it comes to hard employment numbers.

On the negative side, lodging hasn’t yet returned to pre-pandemic employment levels. In fact, the sector is remains down by 217,000 jobs when compared to February 2020.

Should lodging/accommodation continue to add jobs at this pace, we could see a full recovery in Q4 2024.

However, the past few years have been an eyeopener for many lodging and accommodation operators. Many hotels, for example, have reduced the sizes of their teams.

It’s possible that as long as guest feedback remains positive, hotels and resorts will continue to operate with smaller teams. Indeed, technological innovations have made it simpler for mid- and large-scale properties to pare back labor.

Takeaway

While returning to pre-pandemic employment levels in restaurants and bars is great news, we must still be cautious.

This is a delicate situation, and one month of growth isn’t enough to shout, “We’re back!” There’s reason to be optimistic, to be sure, but adding jobs is just one part of an equation that features many variables.

For example, the unemployment level in the US remains unchanged at 3.8 percent.

So, be optimistic. Allow yourself to feel some hope. But be cautious. Continue to work toward empowering your teams, increasing traffic and revenue, mastering the guest experience, and achieving short- and long-term goals.

Image: George Pagan III on Unsplash

KRG Hospitality Start-Up Restaurant Bar Hotel Consulting Consultant Solutions Plans Services

by David Klemt David Klemt No Comments

Canadians Preparing for NHL Opening Week

Canadians Preparing for NHL Opening Week

by David Klemt

Vintage tabletop hockey game toy

Now nobody can accuse me of showing any NHL teams favoritism. Go Knights Go!

As one should expect, Canadian hockey fans are preparing for the 2023-2024 NHL season opener, and those preparations include on-premise visits.

On Tuesday, October 10, three teams will face off to start the regular season.

First, the Nashville Predators take on the Tampa Bay Lightning. Then, the Chicago Blackhawks will face the Pittsburgh Penguins.

Finally, after raising their brand-new, first-ever Stanley Cup championship banner, which they won just six seasons after their founding, the fastest an expansion team has accomplished this feat, the Vegas Golden Knights will welcome the Seattle Kraken to T-Mobile Arena in Las Vegas.

According to on-premise data from CGA by NIQ, Canadian hockey fans are planning to celebrate the start of the season at bars and restaurants. That means operators have less than two weeks to finalize plans to attract these guests to their venues.

In particular, operators in four provinces need to ensure their NHL opening week plans and promotions are good to go. Per CGA’s data, consumers in Québec are showing the greatest interest in watching this season’s opening games in bars and restaurants. Following and driving on-premise interest are British Columbia, Ontario, and Alberta.

Of course, operators throughout the provinces who serve sports fans should be ready to welcome hockey fans.

For our Canadian readers, the Montréal Candiens will take on Toronto Maple Leafs on Wednesday, October 11. On that same day, the Ottawa Senators face the Carolina Hurricanes; the Edmonton Oilers face off against the Vancouver Canucks; and the Winnipeg Jets will battle the Calgary Flames.

Click here for the full opening week schedule.

Why Does this Matter?

I may catch some flack for this but technically, any bar with televisions events can be a sports bar.

Yes, I understand that’s a very simplistic view. And yes, of course that comes with the caveat that sports should be authentic to a given concept. Also, showing sports should take into account the expectations of bar or restaurant’s guests.

In other words, most bars and restaurants can benefit from sports but they’d likely be a hindrance to some high-end cocktail bars and fine-dining concepts.

With that out of the way, operators who want to establish themselves as the go-to spot for sporting events need to nail opening week. That means having all of their ducks in a row.

Do they have the proper business TV packages in place? Will promotions and programming appeal to the target audience? Are the screens and audio system high quality for the best viewing experience? Does the menu offer sports fans what they want for great value? Is the team pulling out all the spots to make viewing fun?

Regarding the menu, CGA by NIQ has a couple of valuable insights. First, beer is the top beverage alcohol category among those planning to celebrate NHL opening week on-premise. Second, among those who plan to consume spirits, tequila is the top pick. Sounds like offering beer and tequila shot pairings could perform well.

However, operators should certainly take into account their own data. What F&B items are selling the best? Which items performed the best this same time last year?

Between 15 and 16 million Canadians follow hockey. That’s a vast pool of potential customers to convert to loyal guests. The importance of becoming their sports home base, their third spot, cannot be overstated.

This coming opening week, lay the groundwork to become the go-to place for hockey fans, fantasy sports competitors, and sports bettors.

Image: cottonbro studio via Pexels

KRG Hospitality. Gaming. Entertainment. Consultant. Food Service. Bowling Alley. Golf. Simulator. Arcades. Eatertainment.

by David Klemt David Klemt No Comments

Indies in the US & Canada: The Numbers

Independents in the US & Canada: The Numbers

by David Klemt

Canadian and America flags flying together

Operators who wonder how many independent restaurants there are throughout America and Canada finally have their answer thanks to Datassential.

The well-known food and beverage research and intelligence platform’s recent infographic reveals the state of indies in both countries.

For the purposes of their infographic, Datassential splits restaurants into two overarching categories. One major category is full-service restaurants, the other is limited-service.

From there, the platform organizes restaurants into five segments: casual, QSR, midscale, fast casual, and fine dining.

To my understanding, QSR and fast casual fall under Datassential’s limited-service designation. Casual, midscale, and fine dining are full-service restaurants.

To review the infographic yourself, please click here.

Number of Indie Restaurants: America

According to Datassential, there are 483,885 independent restaurants in the US.

Of those restaurants, 57 percent are full-service. It follows, then, that 43 percent are limited-service.

Close to half—44 percent—of full-service restaurants in the US boast more than five years of being open. Just a quarter of limited-service restaurants (26 percent) can claim the same.

This does, anecdotally, make some sense. QSRs and fast-casual brands have been on the rise over the past couple of years. In fact, some casual chains are developing and launching QSR brands off the strength of the category.

Finally, 21 percent of full-service restaurants in the US see annual sales under $500,000. That number climbs to 27 percent for limited-service restaurants.

Now, let’s take a look at independent restaurants in Canada.

Number of Indie Restaurants: Canada

Per Datassential, there are a total of 59,914 independent restaurants throughout Canada.

The split between full-service restaurants and limited-service restaurants is just about even. Fifty-one percent of indie restaurants in Canada are full-service. Forty-nine percent are limited-service operations.

A little under 40 percent of full-service independent restaurants in Canada (36 percent) can say they’ve been operating for more than five years. That number is 28 percent for limited-service restaurants.

Interestingly, just five percent of independent full-service restaurants in Canada bring in less than $500,000 in sales annually. That number jumps to 34 percent when we look at the limited-service category.

Indie Restaurants by Segment

The breakdown of the five Datassential independent restaurant categories is the same for America and Canada.

Most independent restaurants in either country are casual. Following, in descending order of number of restaurants, are QSR, midscale, fast casual, and fine dining.

For America, the numbers are as follows:

  • Casual: 37 percent
  • QSR: 34 percent
  • Midscale: 19 percent
  • Fast casual: 9 percent
  • Fine dining: 1 percent

And for Canada the breakdown is nearly identical:

  • Casual: 37 percent
  • QSR: 30 percent
  • Midscale: 18 percent
  • Fast casual: 14 percent
  • Fine dining: 1 percent

There are eight times as many independent restaurants in America as there are in Canada. But as you can see, the industry segmentation by country is nearly the same.

Future independent operators can look at this information a few different ways. They can choose to join the most popular segments and differentiate themselves from the competition. They can look for and fill a need for an indie fast-casual or fine-dining concept. Or they can shoot for the middle and go midscale, a segment that’s gaining traction across several hospitality industry sectors.

For you own copy of Datassential’s infographic, follow this link.

Image: chris robert on Unsplash

KRG Hospitality. Restaurant Business Plan. Feasibility Study. Concept. Branding. Consultant. Start-Up.

Top