Sales

by David Klemt David Klemt No Comments

Working with Local Influencers

Community Collaboration: Working with Local Influencers

by David Klemt
Photographer's hand holding DSLR camera by neon sign

One of the standout educational sessions from WSWA Access Live 2024 focused on finding and working with local influencers.

Natalie Migliarini, a.k.a. Beautiful Booze, and James Stevenson, a.k.a. Little Lane Media, presented “Successfully Engaging with Influential Content Creators in Your Community” in Las Vegas, Nevada, last week. The duo made the case for seeking to collaborate with influencers in your community.

“Local influencer” may give the impression of less popularity and less reach. After all, another designation for these people is “micro-influencer.”

However, there are several reasons why working with local or micro-influencers is a smart move for your bar, restaurant, nightclub, cafe, or hotel.

It helps to understand that some marketing experts categorize influencers by follower count:

  • Nano: 1,000 to 10,000 followers
  • Micro: 10,000 to 100,000 followers
  • Macro: 100,000 to 1,000,000 followers
  • Mega: 1,000,000-plus followers

I don’t know about you, but I think reaching a potential 10,000 followers local to my area of operation is an excellent value proposition. If you’re curious, Migliarini’s Beautiful Booze Instagram account falls into the macro category.

Of course, there are other appealing benefits as well.

Effective Marketing

What do You Want?

What are your goals when marketing your business? I’m willing to wager there are at least three:

  • To be discovered by new people.
  • Boosting traffic.
  • Increasing revenue.

And what’s one of your greatest concerns when it comes to your marketing efforts? I’ll bet that it’s budget.

Well, Migliarini and Stevenson believe local or micro-influencers (and I’d say nano-influencers, as well) can tick all of those boxes.

What do You Want to Spend?

Local influencers will likely be much more affordable than their macro or mega counterparts. There are celebrities—part of the mega-influencer category—that can make millions of dollars for a single promotional post. Macro-influencers can command five figures for just one post.

Now, think about social media. Depending on the platform (Migliarini and Stevenson favor Instagram), these pricey posts can have a lifespan as short as 15 minutes. That’s a lot of money to spend on marketing for just minutes or hours of relevancy.

Then consider engagement. According to Migliarini and Stevenson, engagement is more important than reach.

Who do You Want to Reach?

I’m sure the thought of people across the globe knowing your restaurant or bar is appealing. But would that really translate to more traffic and greater revenue?

Eventually, sure. But in the here and now, when building your brand and getting discovered, your local community is more important.

If you’re operating in the Chicago suburbs, will your revenue and margins improve because some social media users in Vancouver found your venue online? Or, would your business be better served by locals and people in the surrounding area visiting your spot on a regular basis?

I think you know the answer.

Well, this is where nano- and micro-influencers come into play. You want support from locals. Garnering that support via social media means you want influencers who are engaged with your community.

The partners you’re after are local influencers, not global (or national, until you’ve become a must-visit destination for tourists).

As Migliarini and Stevenson say, an influencer may be “micro” by follower count but “macro” in terms for their effectiveness in a particular market.

Effective Partnerships

How to Find Collaborators

The great news is that it’s not difficult to find local influencers. Let’s use Instagram as an example for finding collaborators.

When you pop open the app, you’ll see the search icon at the bottom of the screen. To make this very simple, it’s the magnifying glass to the right of the house icon.

Once you tap the magnifying glass icon, you’ll be able to search for basically anything in the search field. From this point, you’ll see several tabs to scroll through: For you, Accounts, Audio, Tags, Places, and Reels.

Of those fields, Tags will likely deliver some of the best results. Migliarini and Stevenson suggest following hashtags relevant to you and your business. From there, you’ll come across influencers local to your area of operation.

How to Select Collaborators

All engagement is not the same.

It’s going to be tempting to look for huge follower counts and tons of likes on posts. Well, Migliarini and Stevenson find a different metric far more effective in gauging an account’s engagement.

Instead of likes, look at comments. An influencer may have hundreds or thousands of posts. And those posts may have hundreds or thousands of likes.

Does that really mean much? If you use Instagram, think about your behavior on the app.

It’s likely that you scroll dozens of posts whenever you open Instagram. You probably hit the heart icon, liking a number of posts as you scroll.

Do you remember every post that you like? After liking posts, do you think about the account that posted it? Probably not.

Now, let’s say you liked a post so much that you felt compelled to take the extra steps of commenting on it. If that was a post about a dish or drink from a bar or restaurant, that comment may convert into a visit or delivery order.

When you’re looking for a local influencer and going through posts, look at the number of comments. Hundreds or thousands of likes with just a handful of comments may indicate there’s not much engagement. But dozens or hundreds of comments? That’s a great sign.

Of course, you should also sift through the comments. Doing so can show you if the posts are mostly attracting bots. Further, you want to make sure the comments are positive.

How to Engage Collaborators

It’s important to remember that this is going to be a professional relationship.

Stevenson says there’s nothing wrong with sliding into a potential marketing partner’s DMs. However, it’s wise to share your business email address when reaching out. This way, the conversation moves to a more professional platform, and important messages likely won’t get lost.

Once the conversation has turned to the business at hand, both sides need to be crystal clear regarding expectations. How many posts are expected? When will the influencer post them? What’s the budget? What will working on site look like?

Be as detailed as possible to avoid confusion, frustration, and disappointment; both sides will benefit when every expectation is understood.

There’s another key to these collaborations that Stevenson wants operators to understand. Social media influencers aren’t salespeople, they’re marketers. This is a marketing exercise; you’re paying them to communicate and help people discover your business.

Going deeper, there’s another difference. There are influencers, and there are content creators. An influencer is paid to influence, and a content creator is paid to create content for others.

Another way to look at it: Influencers are in front of the camera, content creators are behind the camera. The distinction is very important.

In their partnership, Migliarini is in front of the camera, operating Beautiful Booze. Stevenson is behind the camera, running Little Lane Media. Both partner with restaurants, bars, hotels, resorts, and brands. However, they do so in different ways.

Now that you know what to consider, go forth and find your local influencers.

Image: Max Bender on Unsplash

KRG Hospitality marketing support. Restaurant. Bar. Cafe. Lounge. Hotel. Resort.

by David Klemt David Klemt No Comments

Indies: Which Cities Lead the Way?

Independents: Which Cities Lead the Way?

by David Klemt

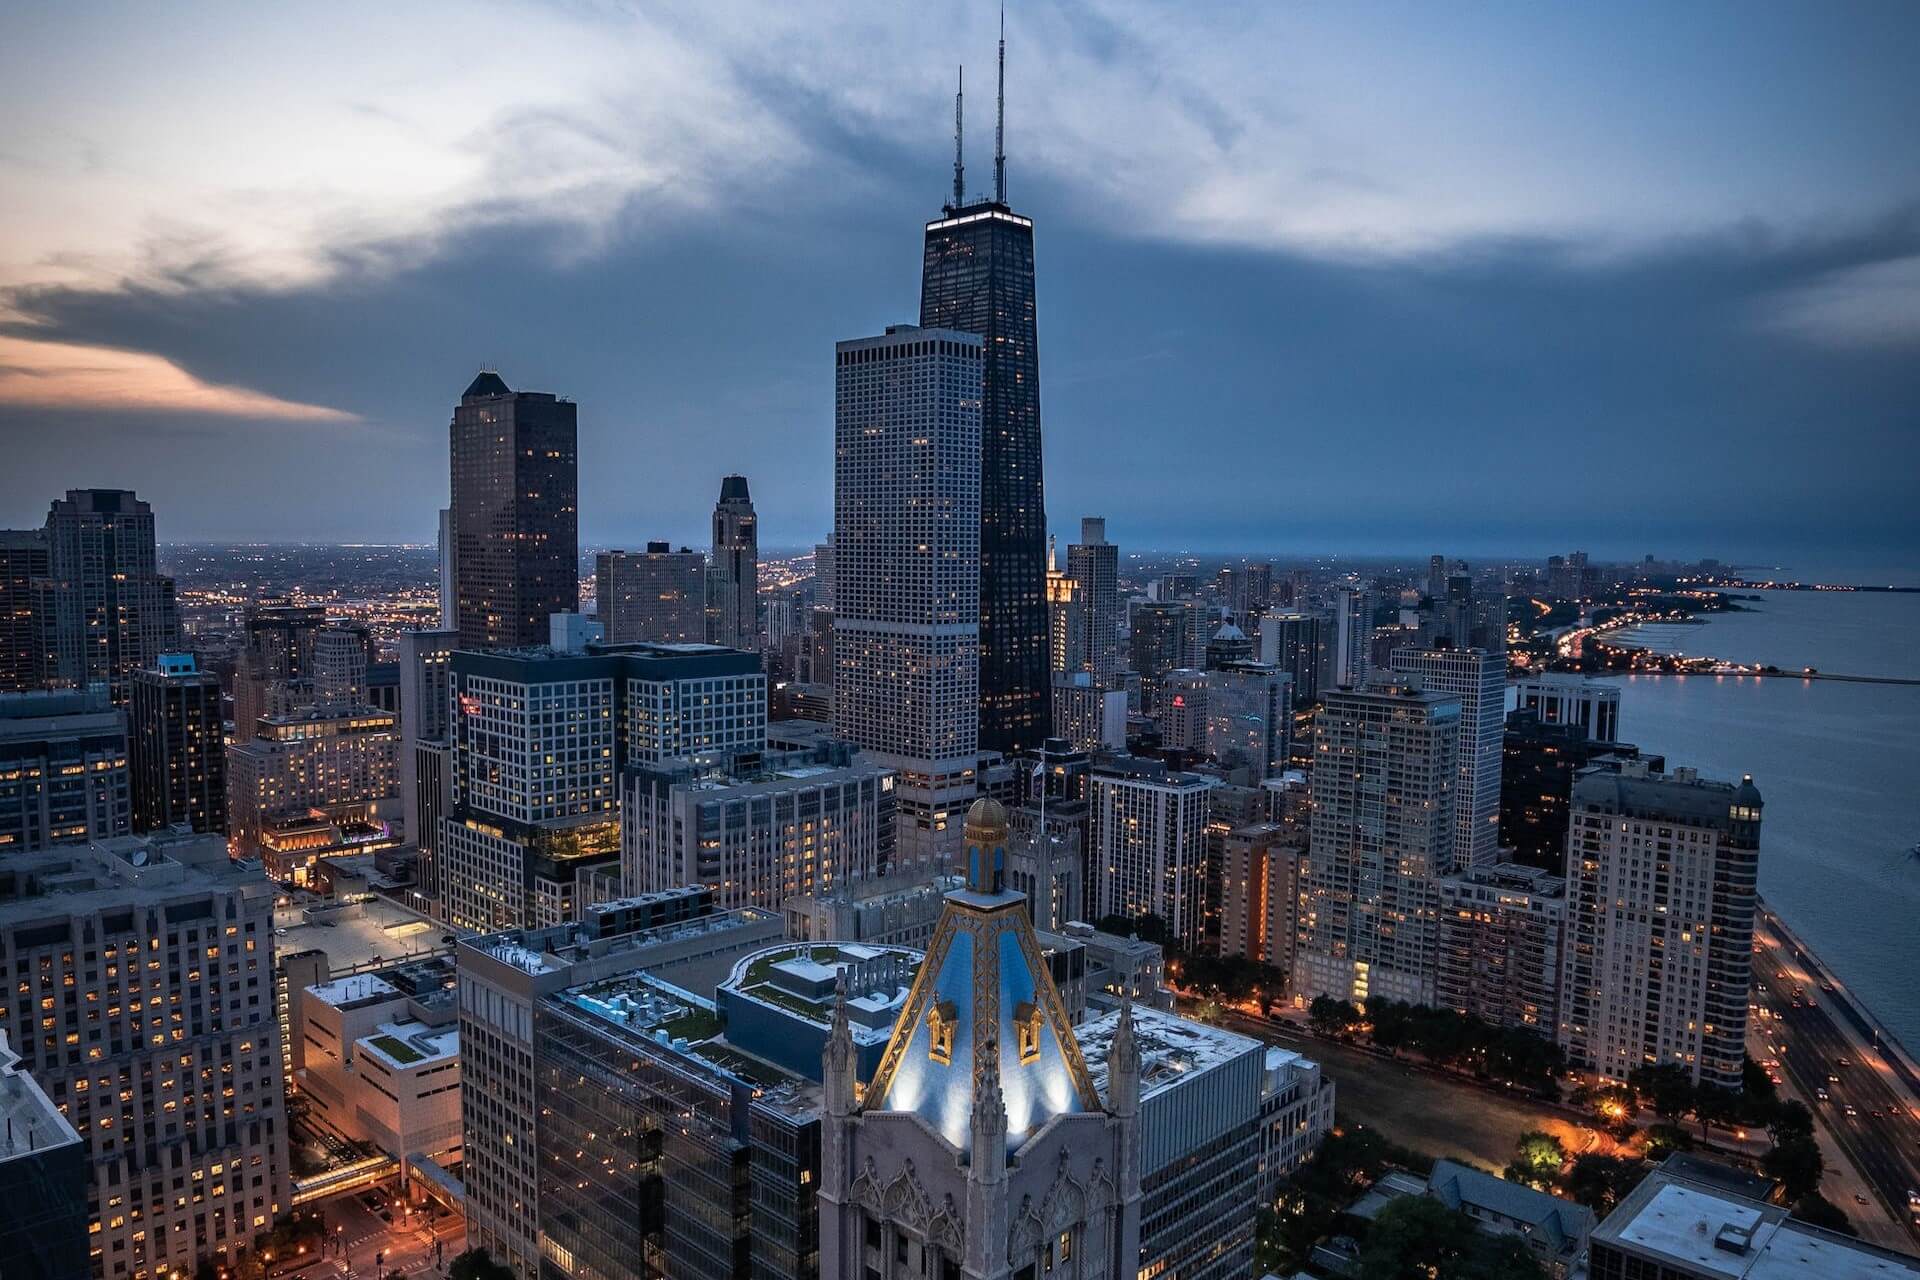
Aerial view of Chicago skyline and Lake Michigan coastline

The majority of the top ten indie restaurants on the Restaurant Business Top 100 Independents ranking are in two American cities.

Those two cities are Miami Beach, Florida, and Chicago, Illinois. While Miami Beach claims two spots among the top three, Chicago has the most restaurants in the top ten. However, the top three indies are all in Florida, with number two being the Boathouse in Orlando.

So, Florida and Illinois are home to nearly the entire top ten of Restaurant Business’ Top 100 Independents. That’s impressive.

What’s even more impressive is the combined annual sales figure of the top ten: $333.4 million. Now, let’s separate Miami Beach. The three indies in the Florida city generated nearly $114 million themselves. Chicago’s four indies among the top ten generated $118 million.

Taken together, the top 100 indies generated $1.95 billion.

All told, 14 of the top 100 indies as ranked by Restaurant Business are in Chicago. Five are in Miami Beach, and five are in Miami. Before I move on, no, Miami Beach and Miami aren’t the same city; they’re entirely separate municipalities. In total, 16 restaurants on this list are in Florida.

New York boasts 15 restaurants on the list. Four are in San Francisco, and just two are in Los Angeles. However, California claims 15 restaurants in total.

However, as you’ll see below, this Restaurant Business list consists of more than just the usual big cities.

Restaurant Business Top 100 Independents: The Top Ten

Below, the top ten independent restaurants, per Restaurant Business.

  1. Joe’s Stone Crab Restaurant (Miami Beach, Florida)
  2. The Boathouse (Orlando, Florida)
  3. Komodo Miami (Miami Beach, Florida)
  4. Maple & Ash Chicago (Chicago, Illinois)
  5. Mila (Miami Beach, Florida)
  6. Sierra Mar (Big Sur, California)
  7. Gibsons Bar & Steakhouse (Chicago, Illinois)
  8. Gibsons Italia (Chicago, Illinois)
  9. Alexxa’s (Las Vegas, Nevada)
  10. Alinea (Chicago, Illinois)

Alinea commands the highest average check among the top ten, at $650. The most reasonable is the Boathouse, averaging $45.

Interestinglyand perhaps logicallythese two restaurants find themselves in the inverse when it comes to annual meals served. The Boathouse serves the most: just over one million. And Alinea, among the top ten indies, serves the least: nearly 45,700.

Notably, when we move on to numbers 11 to 20, Las Vegas, Miami, and New York account for six restaurants.

However, it’s also notable that it’s not just the usual big cities with restaurants on this list. Smaller cities, such as Frankenmuth in Michigan, are home to some of America’s top-performing independent restaurants.

For some context, Frankenmuth has a population of less than 5,200 people. However, Michigan’s “Little Bavaria” draws three million tourists per year. So, it’s no surprise that Zehnder’s Restaurant generates more than $19 million in annual sales.

Restaurant Business Top 100 Independents: The Bottom Ten

Just for fun, let’s take a look at the bottom ten on the Restaurant Business list.

  1. Siena Tavern (Chicago, Illinois)
  2. Fleet Landing Restaurant & Bar (Charleston, South Carolina)
  3. Electric Lemon NY (New York, New York)
  4. Bar Siena (Chicago, Illinois)
  5. El Vez (Philadelphia, Pennsylvania)
  6. Mi Vida (Washington, DC)
  7. Scoma’s Restaurant (San Francisco, California)
  8. Mexican Sugar (Las Colinas, Texas)
  9. The Shed Barbecue & Blues Joint (Ocean Springs, Mississippi)
  10. Chef Adrianne’s Vineyard Restaurant and Bar (Miami, Florida)

Adding context, these ten restaurants have generated $114.6 million in annual sales. That’s roughly the same amount of annual sales as the three restaurants in Miami Beach in the top ten.

Each of the “bottom” ten has annual sales ranging from $11.2 million to $11.9 million.

Takeaway

We all know the following axiom: “Location, location, location.”

It’s tempting to assume this means a business must be in a major city. That’s a woeful oversimplification. Myriad considerations must be made when looking at a market, whether the population is in the hundreds or millions. Assuming a concept will drive traffic and generate millions of dollars solely because it’s in a major city is foolish.

Let’s take another look at Zehnder’s in Frankenmuth. The restaurant, number 47 on the list, generated $19.2 million in annual sales. Moreover, it’s in a town with a population under 5,200.

Number 46 generated $19.3 million and is in (on?) Waimea in Hawaii. Number 48 boasted annual sales of $19 million and is in a city with a population of almost 2.7 million: Chicago.

Clearly, tourism a key contributing factor to the success of Zehnder’s. Not population, not the demographics of the permanent residents, not big-city status.

So, what about check average? Alinea, number ten, has the highest at $650 and generated $28.3 million in sales. However, the Spot, number 85, has an average check of $18 and generated $12.3 million.

The success of any restaurant, bar, nightlife or eatertainment concept doesn’t come down to a single element. What sets a concept apart is a deep understanding of a specific market, the surrounding markets, “sister” sites and competitors, guest desires and expectations, and so much more.

How does an operator come to understand their operation and their market? A feasibility study to start. Then comes a thorough, coherent concept plan and a complete business plan, and an obsession with data.

Operators who put in the work to attain strategic clarity have the potential to earn their way onto the Top 100 Independents list.

Image: Cameron Casey on Pexels

Bar Pub Brewery Nightclub Club Nightlife Business Plan

by David Klemt David Klemt No Comments

Fantasy Sports, Sports Betting on the Rise

Interest in Sports Betting and Fantasy Sports Grows

by David Klemt

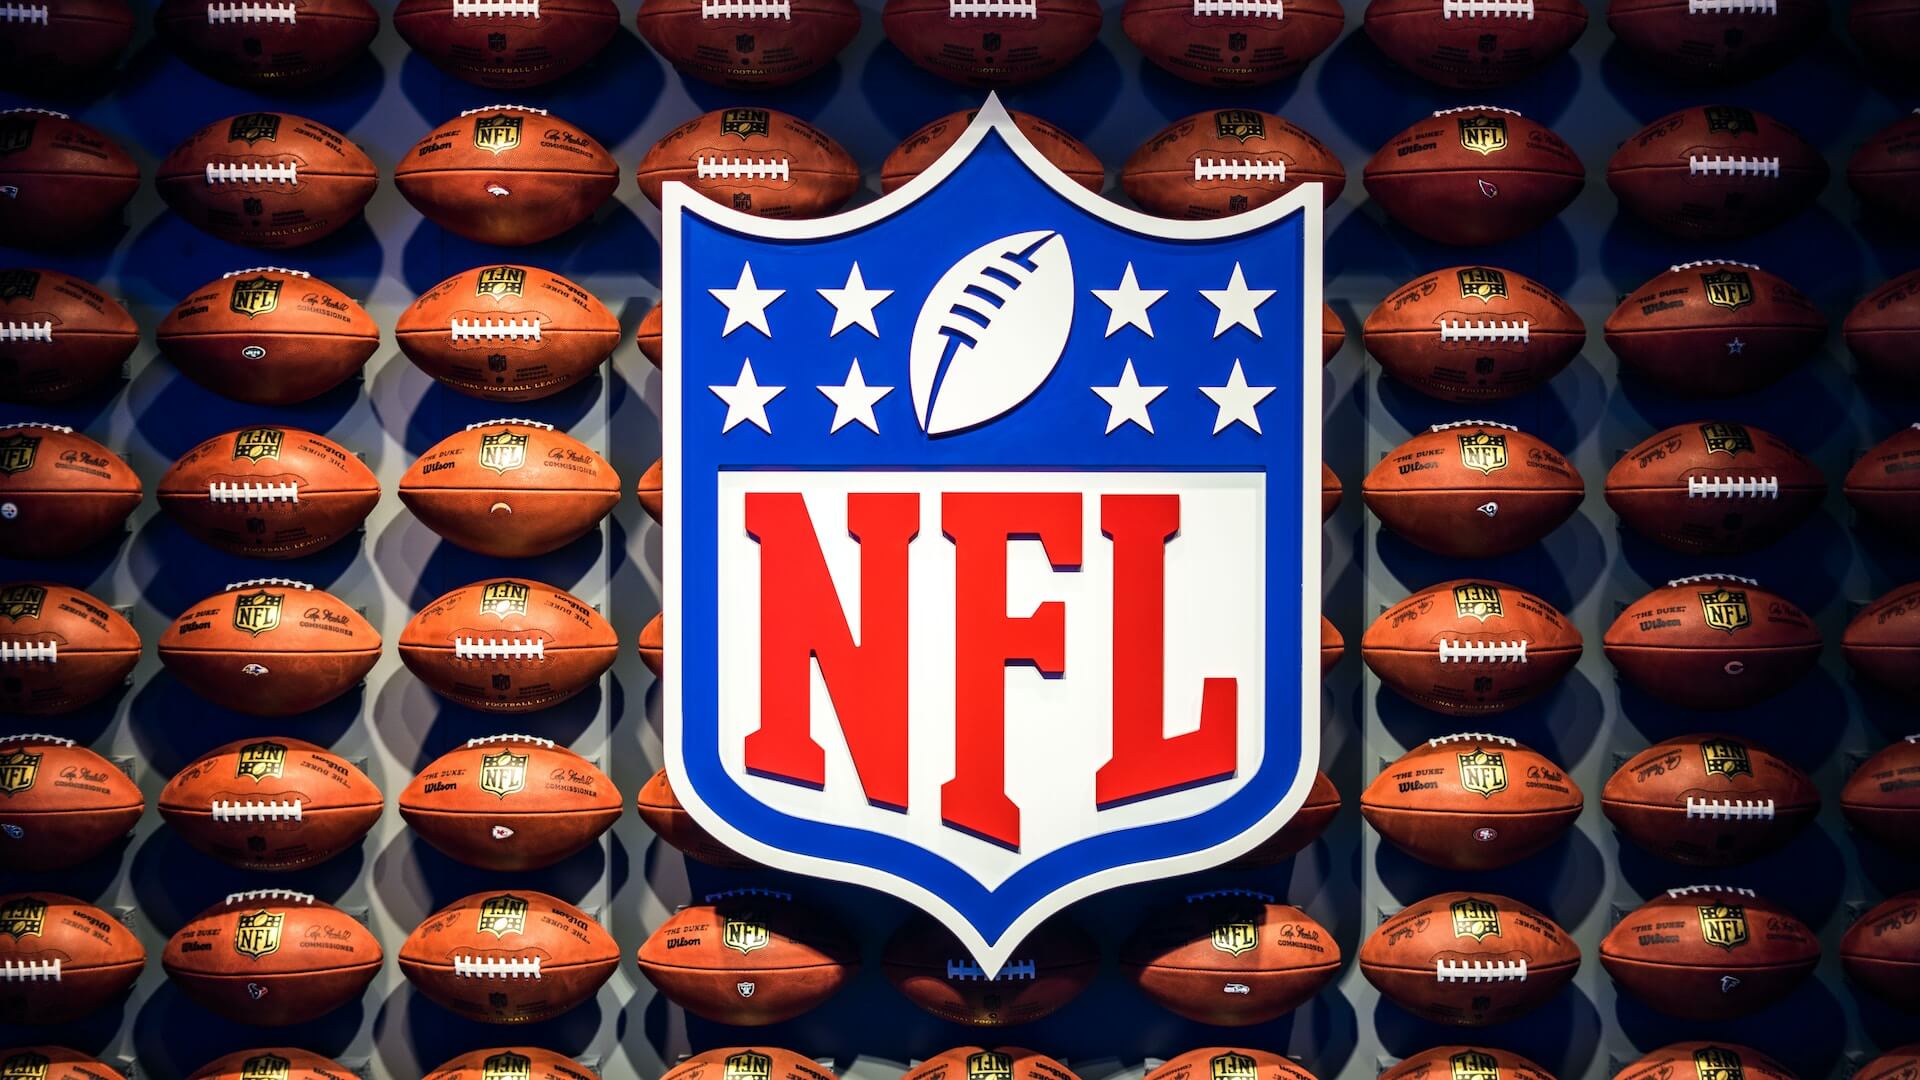
Wall full of American footballs behind large NFL logo

A recent CGA by NIQ On Premise Impact Report for August, 2023 reveals an interesting insight into consumer behavior and expectations.

To be clear, all the data on this new one-pager is useful. However, a particular revelation stands out from the rest, for me.

The CGA by NIQ US On Premise Impact Report for August 24, 2023 addresses:

  • total on-premise sales;
  • dining versus drinking occasions;
  • cost of living impact in the past month; and
  • consumer interest in fantasy sports and sports betting.

It’s that final bullet point that I find compelling. However, let’s check out the numbers for the first three points before we jump into sports.

To download your own copy, please click here.

August by the Numbers

In comparison to August 20, 2022, check value is up one percent to $50.09. Ticket count, however, is down one percent to 1,569.

As one would expect, dining occasions outweigh drinking occasions. Seventy percent of consumers have dined out in a restaurant or bar in the past two weeks.

Compared to July 2o23, that’s a two-percent increase in dining traffic.

Over the course of the same amount of time, 40 percent of consumers have gone drinking in a bar or restaurant. That’s a decrease of one percent in comparison to July 2023.

Considering that many families travel in the month of August before kids head back to school (or to drop them off at university), these numbers make sense.

Of course, cost of living may also be impacting dining and drinking occasion. Most consumers report no changes to the frequency with which they go out for drinks. Some consumers even report going out more frequently for drinks. But some are also cutting back.

For example, 28 percent of consumers have decreased how often they go out for drinks. Eleven percent are consuming lower quality drinks when they do go out, and nine percent are decreasing the “quality” of the establishments they visit.

That said, 20 percent of consumers are increasing drink quality and 21 percent are increasing establishment quality per visit. Seventeen percent are increasing how often they go out for drinks.

Fantasy Sports & Betting

This, as you may have guessed, is the statistic that I find most compelling.

Fantasy sports and sports betting has been on the rise for some time in the US. Who among us isn’t the target of sports-betting-app ads when streaming or watching sports?

Sports bar operators and operators who can position themselves as sports fans’ “third spot” will find this next number interesting.

According to CGA by NIQ’s latest report, 63 percent of consumers revealed they had plans for NFL week one. Those plans included participating in daily fantasy sports or sports betting.

So, it would be wise for operators who will air NFL games this season to ensure they’re catering to fantasy football and sports betting fans. Becoming the hub for fantasy sports groups in your area can increase traffic, sales, and loyalty. And, of course, it opens up the door to many traffic- and revenue-generating sport- and team-themed LTOs.

Again, to download this new report for yourself, please click here.

Image: Adrian Curiel on Unsplash

KRG Hospitality. Gaming. Entertainment. Consultant. Food Service. Bowling Alley. Golf. Simulator. Arcades. Eatertainment.

by David Klemt David Klemt No Comments

The Incredible Rise of Luxury Whiskeys

There are Luxury Whiskeys. Then There are These…

by David Klemt

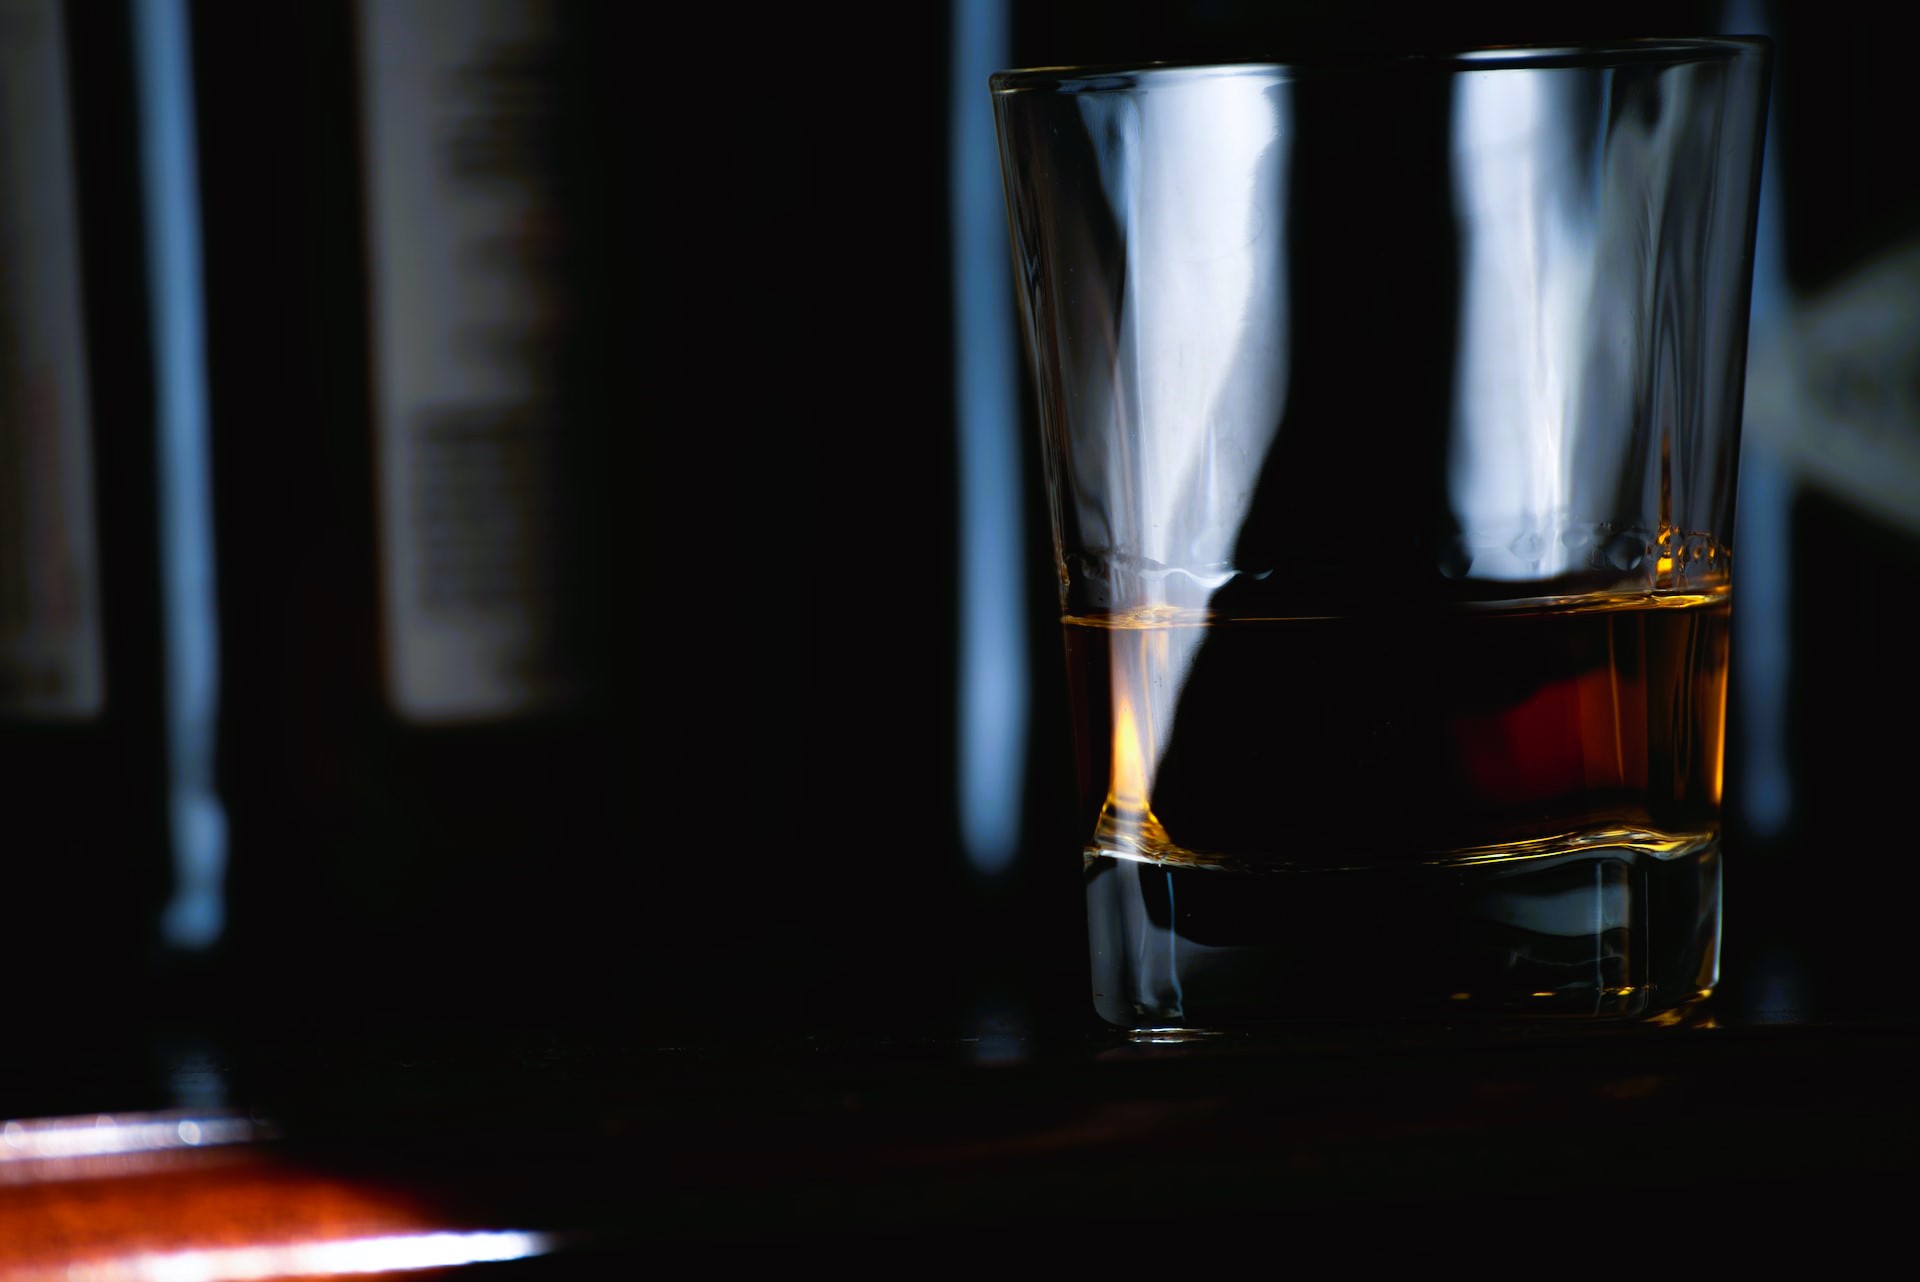
Closeup image of whiskey in a glass

Some investors look at whiskey as a luxury good worthy of parking their dollars, with some outperforming gold and the S&P 500 Index.

In fact, super- and ultra-premium whiskey has at times outperformed gold over the past decade. According to some reports, investments in whiskey casks performed better than gold, the S&P 500, and Bitcoin just a few years ago.

Of course, the hospitality and spirits worlds have long been reporting increased interest in luxury whiskey. Really, consumers have shown interest in premium, super-premium, and ultra-premium spirits across several categories.

In other words, it appears that the “drink better” movement continues to accelerate.

This is, of course, great news for operators. Premium and above spirits command higher prices on-premise, boosting revenue.

But there’s luxury, and then there’s luxury. There are ultra-premium spirits, and there are truly exclusive bottles. I suppose hyper-premium describes these incredibly rare expressions. After all, there are hypercars and hyperyachts, and the owners of such vehicles are the people who can afford hyper-premium spirits.

Two examples of such spirits made headlines recently, and wow—their prices are eyewatering.

The Highland Park 54 Year Old

Interested in a taste of the late ’60s? This Scotch was laid down back in 1968 by Highland Park.

And back in 2008, Highland Park master whisky maker Gordon Motion combined four refill butts and six refill hogsheads. That was also the year that Gordon Motion was named master whisky for the distillery. It seems Motion wasted no time in creating an awe-inspiring whisky for Highland Park.

Highland Park’s 54-year-old whisky is stunning, and just 225 bottles are available. This is, of course, a nod to the distillery’s big 2023 anniversary celebration. Highland Park was founded in 1798; 2023 is their 225-year anniversary.

So, what’s a 700ml, 46.9% ABV bottle of Highland Park 54 Year Old going for? Each one carries a price tag of £39,000, or nearly $47,000 USD. There is, of course, no telling what each bottle will be valued at in the future (or if they’ll appreciate, so be careful, investors).

As far as flavor profile, there are, of course, woody and peaty notes. However, there’s also camphor, pistachio, kiwi, and lychee. However, I’m sure whatever I write here will never do justice to experiencing a dram of 54 Year Old.

Gordon & MacPhail Generations 80-Years-Old

For once, I’m nearly speechless. This is the world’s oldest Scotch. And, until we learn otherwise, world’s oldest whisky.

Of particular note, this is Glenlivet liquid rested by father-and-son duo John and George Urquhart in a Gordon & MacPhail cask.

The liquid was laid down on February 3, 1940 and bottled on February 5, 2020. There are 250 decanters available, and these vessels are as stunning as the whisky they contain.

Architect and designer Sir David Adjaye OBE (knighted in 2017) designed the decanter and oak case. Glencairn Crystal Studio stepped up for production of the decanter. Wardour Workshops crafted the case from sustainably sourced oak.

As I stated above, Highland Park’s 54-year-old Scotch costs nearly $50,000. So, what does this Gordon & MachPhail 80-Years-Old Scotch cost?

Well, we won’t really know until October 7 of this year. That’s the date that Sotheby’s will auction off Generations 80-Years-Old Decanter #1.

The world-renowned luxury marketplace is estimating this lot will go for between $120,000 and $255,000. Although, that price could be driven higher should the auction heat up.

Some of the tasting notes from Charlie MacLean MBE include: almond oil, scented hand-soap, sandalwood, dates, salted plums, figs, dry Oloroso Sherry, and a menthol finish.

The Takeaway

I’m not suggesting that operators drop tens of thousands of dollars on hyper-premium bottles. While doing so could translate to hefty margins per ounce sold from such bottles, it’s not realistic for most restaurants and bars.

However, it’s clear that consumers are showing interest not only in learning about luxury spirits but also an inclination to splash out for a taste.

Are 50- to 80-year-old spirits extreme examples of luxury? Absolutely. Do they point to interest in more affordable examples of luxury? Again, absolutely.

Decades-old spirits are rare but not, if this makes sense, uncommon. While the two bottles above are generating headlines, there are others out in the world garnering interest. Examples are Morthlach 70-Year-Old and 75-Year-Old.

Moreover, these rare expressions generate interest in the distilleries that produced them. So, while the average guest may not be able shell out for a 50-year-old single malt, they could be persuaded to try one from that same distillery that’s half that age.

This is, of course, where storytelling comes into the guest experience. An educated, interested, and engaging front-of-house team can be a sales powerhouse.

Image: Anthony Torres on Unsplash

KRG Hospitality Beverage Programming

by David Klemt David Klemt No Comments

Do Super Bowl Ads Work on Consumers?

Do Super Bowl Ads Work on Consumers?

by David Klemt

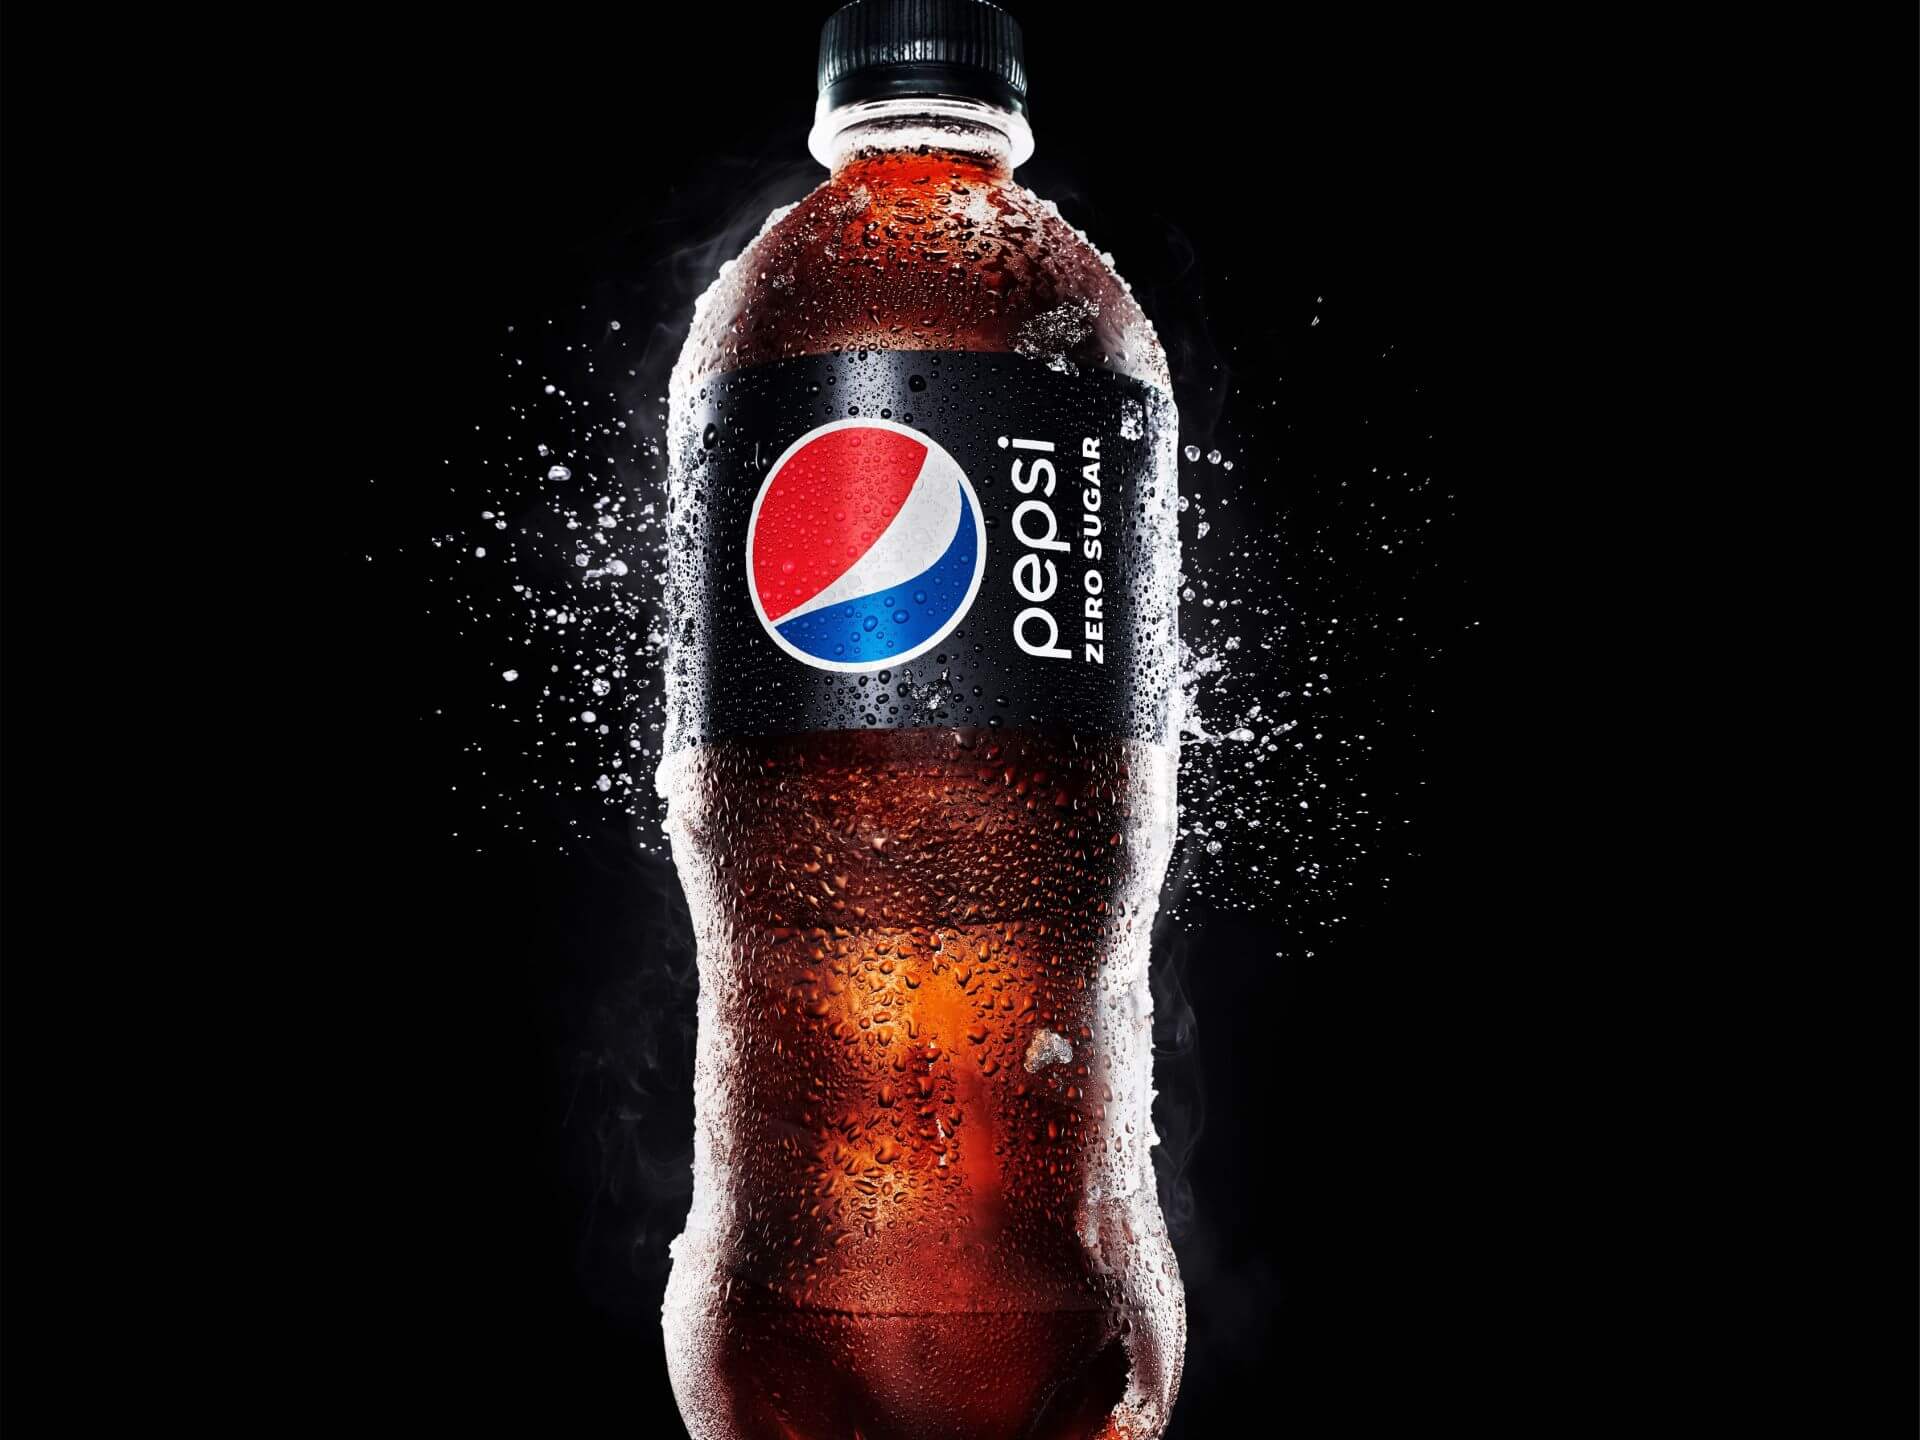
Pepsi Zero Sugar bottle

One of the biggest Super Bowl ad winners is Pepsi Zero Sugar.

Brands spent hundreds of millions of dollars to advertise during Super Bowl LVII, but do their ads actually translate to demand for their products?

A week ago we shared our ten favorite beverage-focused Big Game ads. Along with those ads we shared some numbers.

One of those numbers was $7 million, the cost of a 30-second Super Bowl ad on Fox. Other numbers? $500 million and $700 million, the range of revenue it’s estimated that Fox generated this year from Super Bowl ads.

At this point, these ads and the Halftime Show have essentially become their own entities. Some people watch the Big Game for the ads, some for the show halfway through. It stands to reason that brands are well aware of this development. So, they try to create the most impactful ad possible in the hopes of generating consumer demand.

In other words, these brands aren’t spending all this money just so they’re commercial can be deemed cool. Sure, brands want that buzz. But they also want an ROI on the millions they spend.

The big question is, then, are they seeing a return? Well, it just so happens that behavioral insight platform Veylinx has a data-driven answer to that question.

In short, the answer is yes. Of course, it’s a nuanced yes. For example, it appears Gen Z doesn’t care much about Super Bowl ads, as you’ll see below. Also, non-advertisers in the same categories as Super Bowl advertisers appear to see a benefit from the ads.

You’ll learn more from the Veylinx press release below. It’s an interesting read with valuable data for restaurant, bar, and hotel operators.

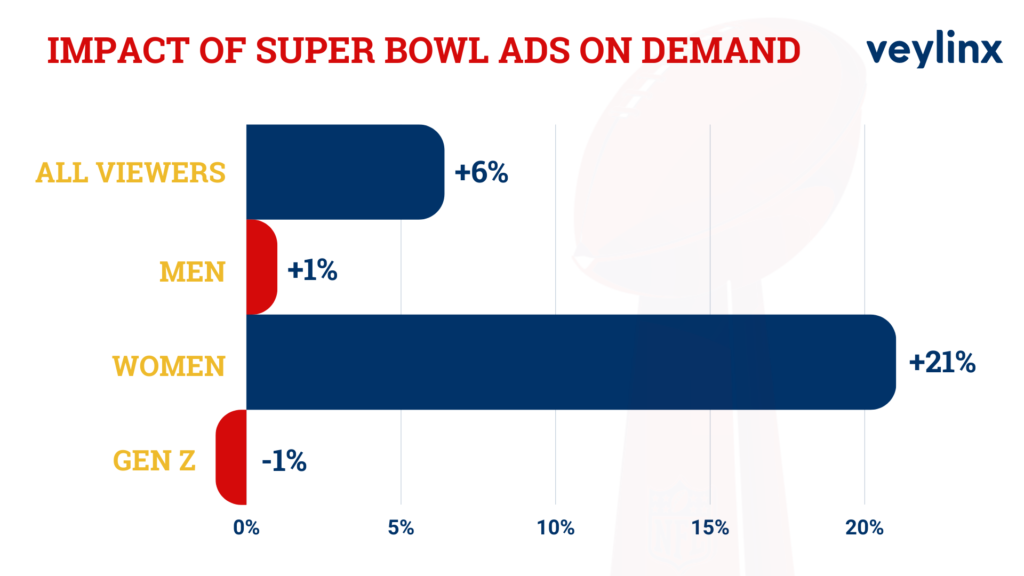
NEW YORK, Feb. 22, 2023 — A new study from behavioral research company Veylinx determined whether or not Super Bowl commercials boost consumer demand for the products advertised. The results show that 2023 Super Bowl advertising fueled a 6.4% increase in demand among viewers.

The overall increase in consumer demand was driven by women, who accounted for a 21% increase in demand growth. The commercials had minimal impact on men, yielding just 1% demand growth for the brands tested. Gen Z viewers were largely unimpressed by the Super Bowl ads, with demand among 18 to 25 year olds actually shrinking by 1%.

2023 Veylinx impact of Super Bowl ads on consumers chart

“It’s not really a surprise to see that Super Bowl ads improve sales, but the short term bump alone may not be enough to justify the $7 million price tag,” said Veylinx founder and CEO Anouar El Haji. 

Using Veylinx’s proprietary methodology—which measures actual demand rather than intent—the study tested purchase behavior during the week before the Super Bowl and again the week after. The research focused on measuring the change in consumer demand for eight brands with Super Bowl ads: Michelob Ultra, Heineken 0.0%, Hellmann’s Mayo, Downy Unstopables, Crown Royal Whisky, Frito-Lay PopCorners, Pringles and Pepsi Zero Sugar. 

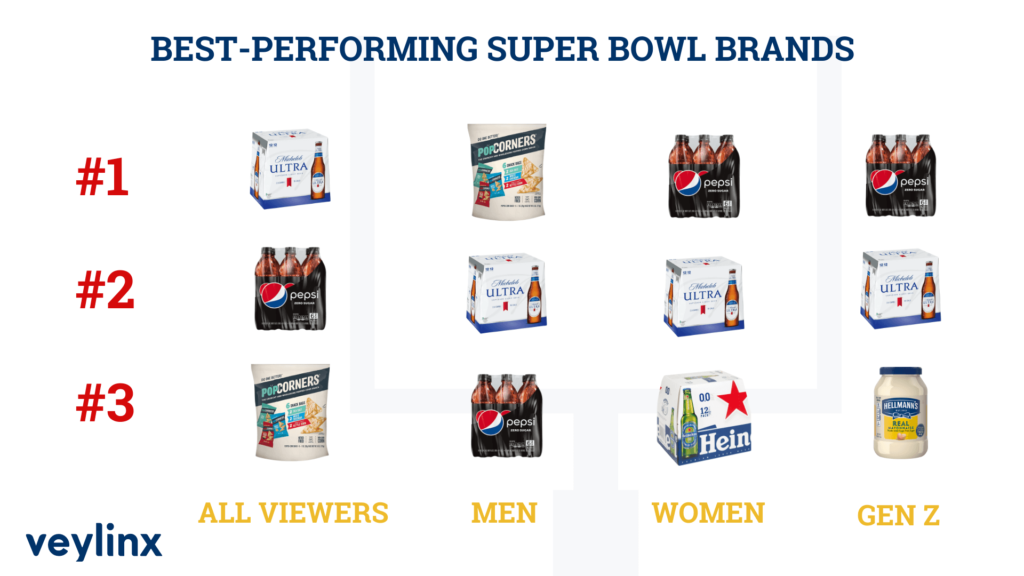
Super Bowl Advertising Winners Overall

Michelob Ultra – 19% increase in demand

Pepsi Zero Sugar – 18% increase in demand

Frito-Lay PopCorners – 12% increase in demand

Heineken 0.0% – 11% increase in demand

Super Bowl Advertising Winners Among Women

Pepsi Zero Sugar – 45% increase in demand

Michelob Ultra – 40% increase in demand

Heineken 0.0% – 40% increase in demand

Crown Royal Whisky – 26% increase in demand

Veylinx, top performing brands during 2023 Super Bowl

Halo Effect for Non-Advertisers

The biggest winners were arguably brands in the same product categories as Super Bowl advertisers. Non-advertisers in those categories appeared to benefit nearly as much as the advertisers: demand grew by 4.2% percent for the study’s control group of non-advertising competitors. Corona Extra, Kraft Mayo and Lay’s STAX were the greatest beneficiaries in a control group that also included Budweiser Zero, Arm & Hammer Clean Scentsations, Canadian Club Whisky, Popchips, and Coke Zero Sugar. Notably, every non-advertiser saw at least a slight increase in post-Super Bowl demand.

“The goal of our study was to look specifically at how consumer demand is affected by running a commercial during the Super Bowl,” El Haji said. “It’s possible that the non-advertisers deployed other marketing efforts to offset or take advantage of the Super Bowl advertising—or they simply benefited from increased exposure for their categories.” 

Additional Findings

Study participants also answered a series of follow-up questions about their preferences, perceptions and how they watched the Super Bowl. More than three-quarters watched at home through various platforms, the most popular being the live cable/satellite broadcast (38%), followed by YouTube TV (15%) and Hulu (10%). When asked why they watched, it’s no surprise that participants were all about the game (64%)—but the commercials were the next most popular reason for watching (39%), followed by halftime (35%), the social aspect (26%) and fear of missing out (13%). 

About the Research

Veylinx studied the behavior of 1,610 U.S. consumers pre- and post- Super Bowl LVII. Unlike typical surveys where consumers are simply asked about their purchase intent, Veylinx measures whether consumers will pay for a product through a real bidding process. Consumers reveal their true willingness to pay by placing sealed bids on products and then answering follow-up questions.

For more information about the study and the Veylinx methodology, visit info.veylinx.com/super-bowl

About Veylinx

Veylinx is the most realistic behavioral insights platform for confidently answering critical business questions during all stages of product innovation. To reliably predict demand, Veylinx captures insights through a Nobel Prize-winning approach in which consumers have real skin in the game. This is a major advance from traditional market research practices that rely on what consumers say they would hypothetically buy. Veylinx’s unique research methodology is trusted by the world’s largest and most innovative consumer goods companies.

Main article image: PepsiCo / Article body images: Veylinx

KRG Hospitality Bars & Lounges, 2023 icon

by David Klemt David Klemt No Comments

Datassential’s State of the Operator 2022

Datassential’s State of the Operator 2022

by David Klemt

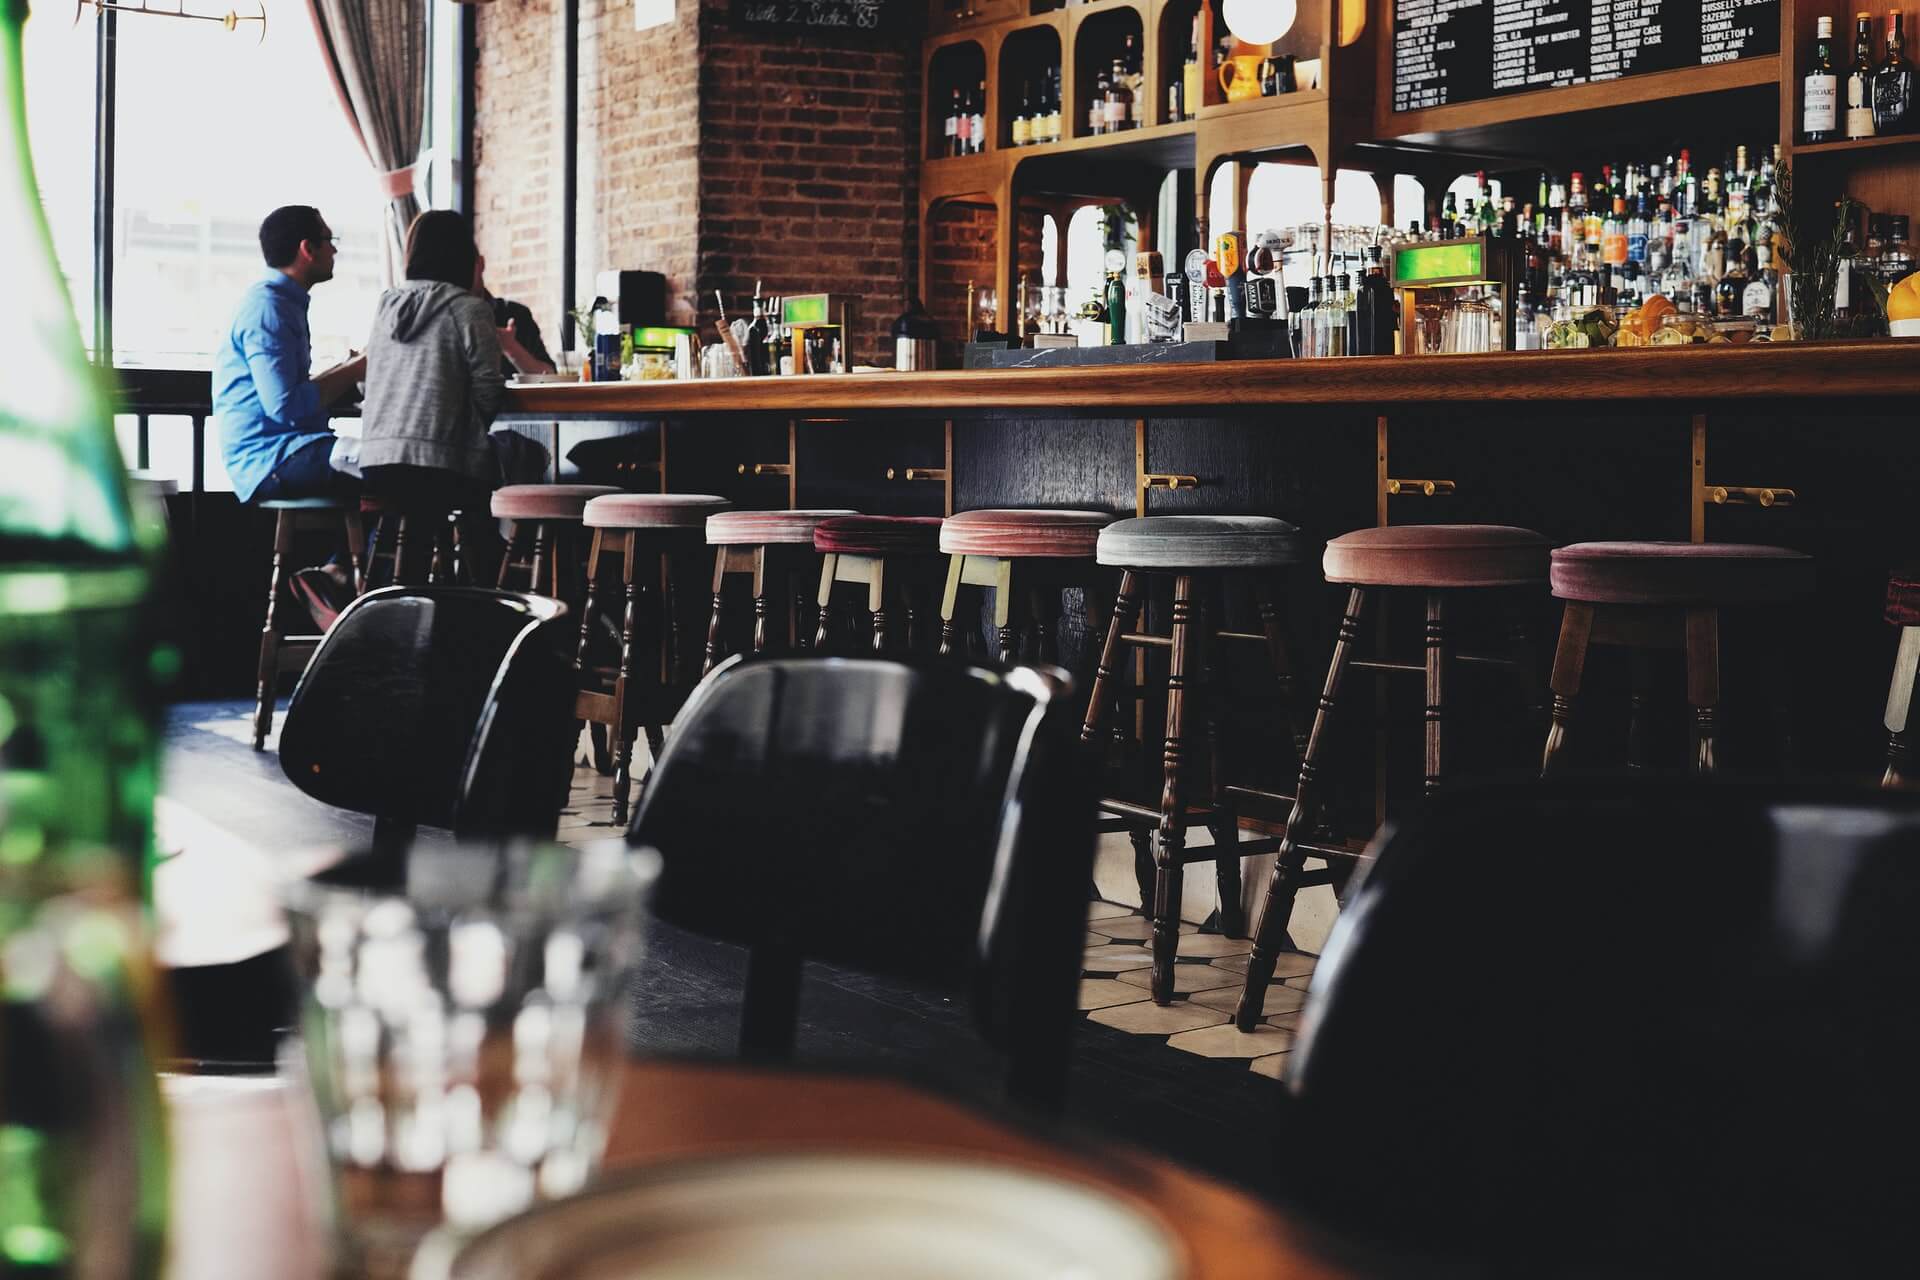
Guests sitting at the bar inside a restaurant

The latest addition to the Datassential FoodBytes research series shares insights into the top three challenges most—if not all—operators are facing.

Now, some of what the report reveals paints a bleak picture. Inflation, the labor shortage, and supply chain issues persist even past the midway point of 2022.

However, operators are a tenacious and innovative group of business owners. Of course, that tenacity seems to manifest in people thinking this industry can weather any storm. That perception can come at operators’ detriment. Exhibit A: The Inflation Reduction Act of 2022 not including replenishing of the RRF. But, I digress.

“The State of the Operator & the Road Ahead,” which you can download here, is helpful and informative. As you may be aware, we’re fans of Datassential and their FoodBytes reports. In fact, you can find our synopses of FoodBytes reports here and here.

Below are some key points that operators should be aware for consideration. I strongly urge you to download this free report today.

Operator Outlook

First, let’s take a look at traffic. As Datassential points out, some hospitality business segments are performing better than others currently.

In large part, this is due to two factors: People working from home, and people returning to travel. So, operators who rely heavily on commuters and in-person workers are struggling. On the other hand, operators inside or around hotels are, per Datassential, performing the strongest at the moment.

Interestingly, though, nearly half of operators (47 percent) are seeing an increase in traffic in comparison to pre-Covid levels. Fourteen percent of operators are reporting no change in traffic. Unfortunately, traffic is lower for 39 percent of operators.

Next, sales. In comparison to pre-Covid times, more than half (51 percent) of operators report an increase. Again, 14 percent of operators are experiencing no change. But 35 percent of operators are experiencing a decrease in sales.

Finally, profit margins. Half of operators may be seeing increases in traffic in sales, but profit margins are taking a hit. On average, the industry’s profit margin is now hovering at 13 percent. That’s an eight-percent drop in comparison to pre-Covid levels.

Segment Performance

The findings regarding profit margins are likely to be the most alarming to operators. Historically, our industry has operated on razor-thin margins for decades. Dropping from an average of 21 percent to 13 is concerning.

However, context is important. The segments seeing the lowest profit margins in 2022 are: Business & Industry (B&I), Healthcare, and Colleges & Universities (C&U). Again, remote work (and learning) are largely responsible for those particular segments watching their profit margins tumble.

The strongest performers are: Quick-Service Restaurants (QSR) at 17 percent; Fast Casual at 15 percent); and Midscale, Casual Dining, and Fine Dining, each at 13 percent. Lodging is just below the current average at 12 percent.

Operator Adaptation

Inflation, rising food costs, supply chain issues, labor shortages… Operators are finding ways to cope, and in some situation, thrive.

Unsurprisingly, the vast majority of operators are increasing menu prices. In the past 12 months, 77 percent of operators have raised menu prices at least once.

These increases range from one percent a staggering 30 percent. However, the majority have kept these increases to one to ten percent. Most (31 percent) have implemented increases of no more than five percent. Just one percent of operators boosted prices between 25 to 30 percent.

Of course, raising prices isn’t the only strategy operators have at their disposal. Forty percent of operators are streamlining their menu, reducing the sizes of their menus. However, it’s wise for operators to review their menus at least every three months to eliminate poor performers.

Other strategies include focusing on value for guests (27 percent); utilizing LTOs and launching new menu items (26 percent); eliminating a specific daypart or portion of the menu (25 percent); and making portion sizes small, or “shrinkflation” (18 percent).

There’s much more revealed in Datassential’s latest FoodBytes report. Download your copy today.

Image: Luca Bravo on Unsplash

by David Klemt David Klemt No Comments

Canadian Trends 2022: Technomic

Canadian Trends 2022: Technomic

by David Klemt

Yellow neon "butter" sign and scaffolding

Curious about what to expect in 2022 as a Canadian restaurant, bar or hotel operator?

Technomic has some predictions for next year.

Reviewing their “Canadian Trends: Looking Ahead to 2022” report, creativity and streamlining will be keys to success.

Let’s jump in!

Butter

Yes, this is why I chose the image above. Technomic is very specifically identifying butter as an important 2022 F&B trend.

And no, they don’t appear to be predicting the popularity a particularly rare or esoteric butter. The industry intelligence firm means butter will prove important in 2022.

In large part, Technomic is pointing to comfort food as a driver for butter.

Generally, the firm points to how versatile butter is in the kitchen. Browned and herb-infused butters, says Technomic, will find its way into cocktails.

Flavor and texture will play an important role, extending the butter prediction into buttery foods territory. For example, Technomic predicts butterscotch, buttermilk and ghee will see a boost in usage and demand.

Additionally, the plant-based movement will help nut butters grow more popular. In fact, Technomic says nut butters will find their ways onto burgers and into cocktails.

Interestingly, the firm’s butter prediction gives operators two larger trends to watch: comfort food and plant-based.

Cross-utilization

You don’t need me to tell you that North America—and the rest of the world—is facing supply chain issues.

I know you’re exhausted from just the past nearly two years of constant adaptation and pivoting. In 2022, you’ll have to continue with your creative problem solving.

The supply chain challenge (there’s an understatement) requires creativity in several areas. This includes the kitchen and menu.

Technomic suggests that one path forward through supply chain problems involves ingredient preparations:

  • Pickling
  • Candying
  • Salt-baking

The firm says these creative takes on ingredients operators already have will extend product life; add new flavors to dishes; and deliver new textures. Those last two offer guests new experiences.

In addition, getting creative with the ingredients you may be able to get more readily will help streamline and update 2022 menus. However, revising your menu will require careful consideration of your supply chain and cross-utilization, with a heavy helping of creative prep.

Running Lean

Smaller footprints. Shrunken staff. Streamlined menus. Smaller, shrunken, streamlined, optimized, leaner…

Call the process whatever you want, Technomic is predicting that operators will need to “optimize” (read: make smaller) their businesses.

Of course, there isn’t a one-size-fits-all solution. We’ve read and heard predictions since last year about what will need to shrink moving forward.

While some recent news reports say that ghost kitchens are out, Technomic seems to think that’s not the case. Technomic suggests ghost kitchens will remain viable for operators who want to expand without investing in real estate.

Additionally, Technomic’s report suggests something that should come as no surprise. In short, if it works for a brand or location, smaller may be better and here to stay.

Growth

Now, this is the most promising of Technomic’s predictions: Growth.

Per the firm, the foodservice industry in Canada was down 29 percent in Q1 of 2021. Pre-pandemic, sales reached $95 billion. That represents a loss of nearly $30 billion.

However, there’s reason to be optimistic in 2022, according to Technomic.

The firm expects growth of 21 percent in 2022 over 2021, or sales of $74.8 billion. Should this prediction prove accurate, 2022 would close just three percent under pre-pandemic sales.

Technomic identifies full-service as the foodservice segment to experience the most growth next year at 26.2 percent. In comparison, the firm predicts limited-service to grow 7.3 percent.

Next year won’t be easy. 2022 won’t be a magical return to normalcy. But there is room for optimism if Technomic’s predictions are correct.

Image: Jon Tyson on Unsplash

by David Klemt David Klemt No Comments

Sales Jump Shows Guests Will Pay More

Chipotle Sales Jump Shows Guests Will Pay More

by David Klemt

Close up of calculator buttons

Chipotle’s latest earnings report may show that guests are willing to pay more at their favorite restaurants.

In Q3, the fast-casual giant’s net sales grew by nearly 22 percent. Per reports, same-store sales rose by just over 15 percent.

Is it possible that Chipotle’s earnings—which exceeded Wall Street estimates—indicate that guests will tolerate price hikes?

Rising Costs

No, it’s not a “hot take” to state the obvious: Everything is more expensive.

All operators and managers are aware that costs are rising across the board. Beef, chicken wings, cooking oils… Prices are increasing and the trend is expected to continue.

Not that any of us need a real-world example, but Chef Brian Duffy shared on episode 53 of the Bar Hacks episode that he now has to price a pound of chicken wings at $13.

One reason that Chipotle made the choice to raise prices comes down to rising beef prices. Another is increased freight costs.

As every armchair economist knows, when a business’ costs rise that increase falls on its customers.

The reason is fairly simple: If prices remain the same while costs rise, the situation becomes untenable, the business doesn’t generate enough revenue, and doors close.

So, Chipotle’s decision was simple. The fast-casual chain announced in June that menu prices would increase by about four percent to defray rising costs.

Rising Wages

Chipotle’s June announcement followed one the company made in May.

Six months ago, Chipotle announced the hourly wage for their restaurant workers would increase to $15 by June.

How did the company afford to raise hourly wages, offset ingredient costs, and deal with rising freight rates? The aforementioned menu price hike.

Now, Wall Street didn’t seem to anticipate backlash toward Chipotle for increasing their prices. However, plenty of other people have said—and still say—that customers won’t support restaurants or bars that raise prices.

It appears that a significant percentage of brand-loyal customers will remain loyal and continue to support the businesses they like even through price hikes.

Is This the Way?

I’ll address a crucial detail: Chipotle is a fast-casual brand valued at close to $52 billion.

They’ve got incredible brand recognition and tremendous purchasing power. Reportedly, there are 2,857 Chipotle locations in the United States. In fact, the company announced in February of this year that it planned to open 200 more locations this year.

So, no, there’s not a direct comparison to be made between Chipotle and an independent restaurant or bar.

However, that doesn’t mean there’s no lesson to be learned here.

Chipotle was transparent about the reasons for their price hikes. The Great Resignation has shined a spotlight on wages, and Chipotle addressed that concern.

The pandemic has also unleashed havoc on supply chains. Again, Chipotle was forthcoming about the challenges the company was facing.

Moving forward, it may be wise for restaurant and bar owners to address menu price increases. There does seem to be some level of understanding among the more rational guests out there that if they support increased wages for hospitality workers; understand supply chain challenges; and know costs are up for everything, they’re going to see price hikes.

You very likely need to raise at least some of your prices. When you do so, consider telling your guests why. You may be surprised by the support you receive.

Image: fancycrave1 from Pixabay

by David Klemt David Klemt No Comments

Canadian On-premise Sales Stabilizing

Canadian On-premise Sales Stabilizing

by David Klemt

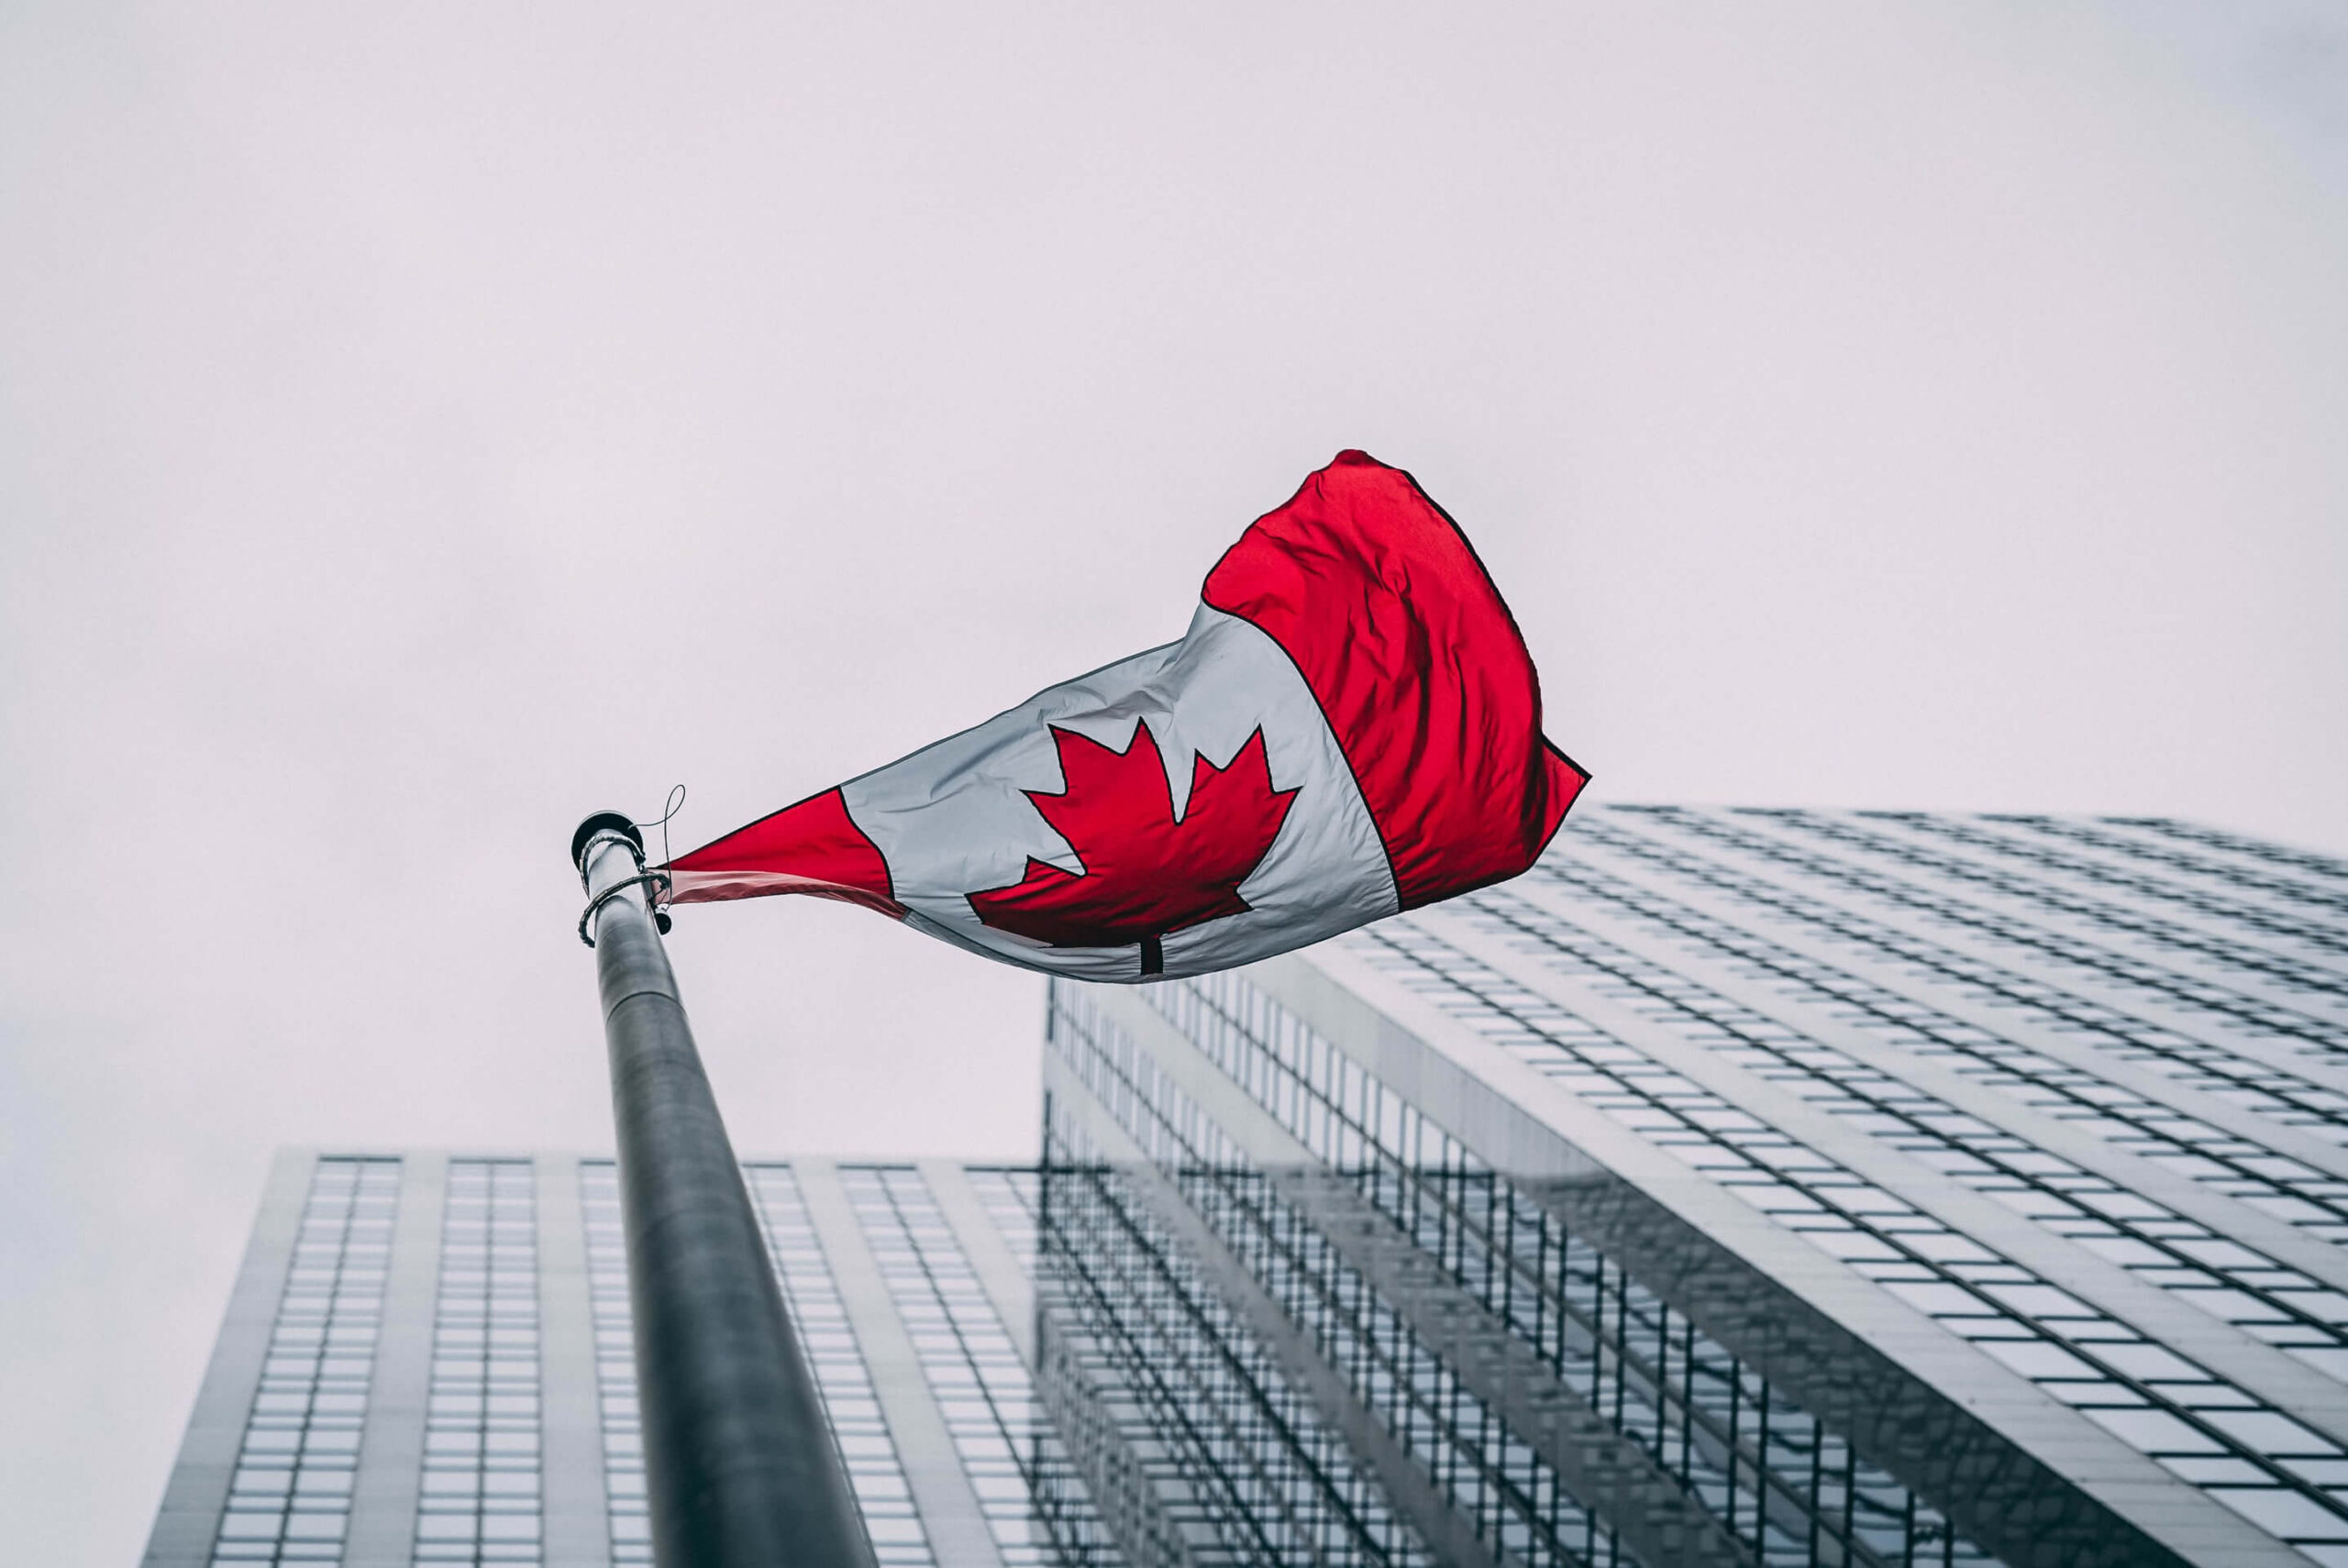
Canadian flag in downtown Toronto, Ontario, Canada

A report from Restaurants Canada and Nielsen CGA shows that on-premise sales are steadying and, in some provinces, growing.

In fact, with the exception of Alberta being slightly down, Canada’s nationwide sales velocity looks promising in comparison to 2019.

Overall, Canada’s on-premise velocity is on the rise. Let’s take a look at how the three main provinces KRG Hospitality services are performing.

Alberta

To say that Alberta is down is a tad misleading. The province’s performance is nearly on par with 2019.

In comparison to 2019, Alberta is just -1 percent below in velocity levels.

Now, in comparison to 2020, the province is +46 percent. However, 2019 is a far more accurate gauge of performance.

While being down one percent is on the surface negative, growth in Calgary and Edmonton is highly encouraging.

In the week to August 21, Calgary’s velocity rose +4 percent, while Edmonton grew +10 percent. Those two cities are responsible for overall growth in velocity in Alberta of +4 percent.

Should the upward trend continue, Alberta will match and surpass 2019 quickly.

British Columbia

Of the three key provinces in which KRG Hospitality operates, BC is the second-best performing in comparison to 2019. Against 2020, BC is the third top performer.

Per Restaurants Canada and CGA, BC velocity is up +12 percent in comparison with 2019’s sales. The province is up +33 percent when compared to 2020.

In Vancouver, velocity is flat rather than experiencing negative growth. Any negative trends, according to the Restaurants Canada and CGA report, is coming from Victoria. That city is down -6 percent.

Ontario

Of our key Canadian markets, Ontario is performing the best overall.

Compare velocity to 2020 and the province is up +48 percent. In comparison to 2019, Ontario’s velocity is up +13 percent.

One can attribute current growth to Toronto. The Ontario city’s performance in the week to August 21 is +4 percent.

Canada

According to the report, sales velocity in Canada is up +2 percent overall.

Compare the country’s overall performance against 2020 and 2019, and Canada is trending upward. The nation’s on-premise velocity is up +41 percent in comparison to 2020 and +11 percent against 2019.

Clearly, the expectation is for the country’s on-premise performance to experience further growth as consumers return to in-person dining and restrictions loosen.

However, it’s important for operators to not simply return to pre-pandemic operations. Consumer behaviors have changed and many pandemic-driven habits—delivery, for example—are now permanent.

Further, now’s the time for those considering proceeding with plans to open restaurants, bars and hotels to move forward. In fact, Travis Tober, the guest from our milestone 50th episode of Bar Hacks, believes there’s no better time than now to open a hospitality venue.

Image: Lewis Parsons on Unsplash

Top