Survey

by David Klemt David Klemt No Comments

Top-performing Menu Items in the US

Top-performing Menu Items in the US (So Far)

by David Klemt

Barbecue chicken wings, chili peppers, and chili flakes

Thanks to a recent mid-year report from F&B intelligence platform Datassential, we now know the top-performing menu items in the US.

For the low, low price of filling out a handful of fields, you can download a copy of Datassential’s “Foodbytes: 2023 Midyear Trend Report” for yourself.

There’s plenty of useful data packed into this short report. You may find some of the top food items a bit surprising.

But First…

Datassential does more than just list the top mid-year menu performers in their latest report. There are also a couple of interesting datapoints for operators to consider.

The first piece of information is an alarming statistic: 54 percent of consumers are of the belief that “tipping culture has gotten out of control.”

As we’ve reported earlier, it’s likely that a major driver of “tip fatigue” comes from retail. The expectation for consumers to tip at a restaurant, bar or nightclub is ingrained deeply in American culture.

However, consumers throughout America are being prompted to tip after just about every transaction they’re attempting to complete. In fact, it’s not just retail that has been encouraging (in some cases, guilting) people to tip. Some contractors are also adding tip lines when handing over tablets to clients so they can pay their invoices.

One result is that servers and bartenders are reporting lower tips; guests are so over tipping that they’re pushing back against the practice in venues where they’d traditionally have no problem doing so.

Of course, tip fatigue isn’t the only reason consumers are pushing back against tipping. Many people feel that operators should increase what they pay staff. Indeed, some people feel that operators are asking them to subsidize their employee pay. Whether they’d be happy to pay higher prices remains to be seen.

Fads Aren’t Bad?

Whenever we cover trends or discuss them with clients, we caution against chasing too many (or the “wrong” trends). And fads? It can be even riskier to hop on the bandwagon of something that may never even reach the trend stage of its lifecycle.

However, likely due to the ubiquity of TikTok, consumers expect restaurants to embrace fads. According to Datassential, 67 percent of consumers overall “want to see more fads at restaurants and retail.”

That number jumps to 74 percent when focusing on Millennials and Gen Z.

So, while we still caution operators about jumping on fads (or “micro trends”) and trends, that doesn’t mean be too cautious. If a fad or trend works with your brand and won’t cost much to feature, at least give it consideration.

Not sure you’re great at identifying fads that will work for your business? Ask your staff which fads and trends are hot at the moment.

Speaking of Hot…

Alright, let’s take a look at the F&B items Datassential identifies as popular at the midway point of 2023.

Again, I encourage you to download the report in its entirety. You can do just that by clicking here.

But for those who want instant gratification, check out these menu items:

  • Super Duper: Let’s kick things off with the hottest chain LTO, the Denny’s Super Slam. Per Datassential, restaurant chains have already featured in excess of 2,000 LTOs in 2023. The F&B intel agency tests them all, and the Super Slam is wearing the LTO crown at the moment.
  • Chef Chatbot: Datassential tapped ChatGPT to create a burger recipe and had Midjourney create an image for the resulting Caprese Avocado Burger. More than half of consumers surveyed—57 percent—want to try it at a restaurant.
  • Big Winner: Datassential asked consumers a simple question: Which would you rather eat for the rest of your life, a hamburger or a hot dog? A staggering 87 percent chose hamburgers, meaning just 13 percent of consumers would choose a hot dog over it’s burger buddy.
  • What a Pickle: Back in March we checked out Slice’s Slice of the Union report, and it predicted pickle pizzas would be a hot trend this year. Well, Datassential has crunched the numbers and says 40 percent of consumers are aware of this pizza style already. Looks like Slice may be proven right by the end of the year.
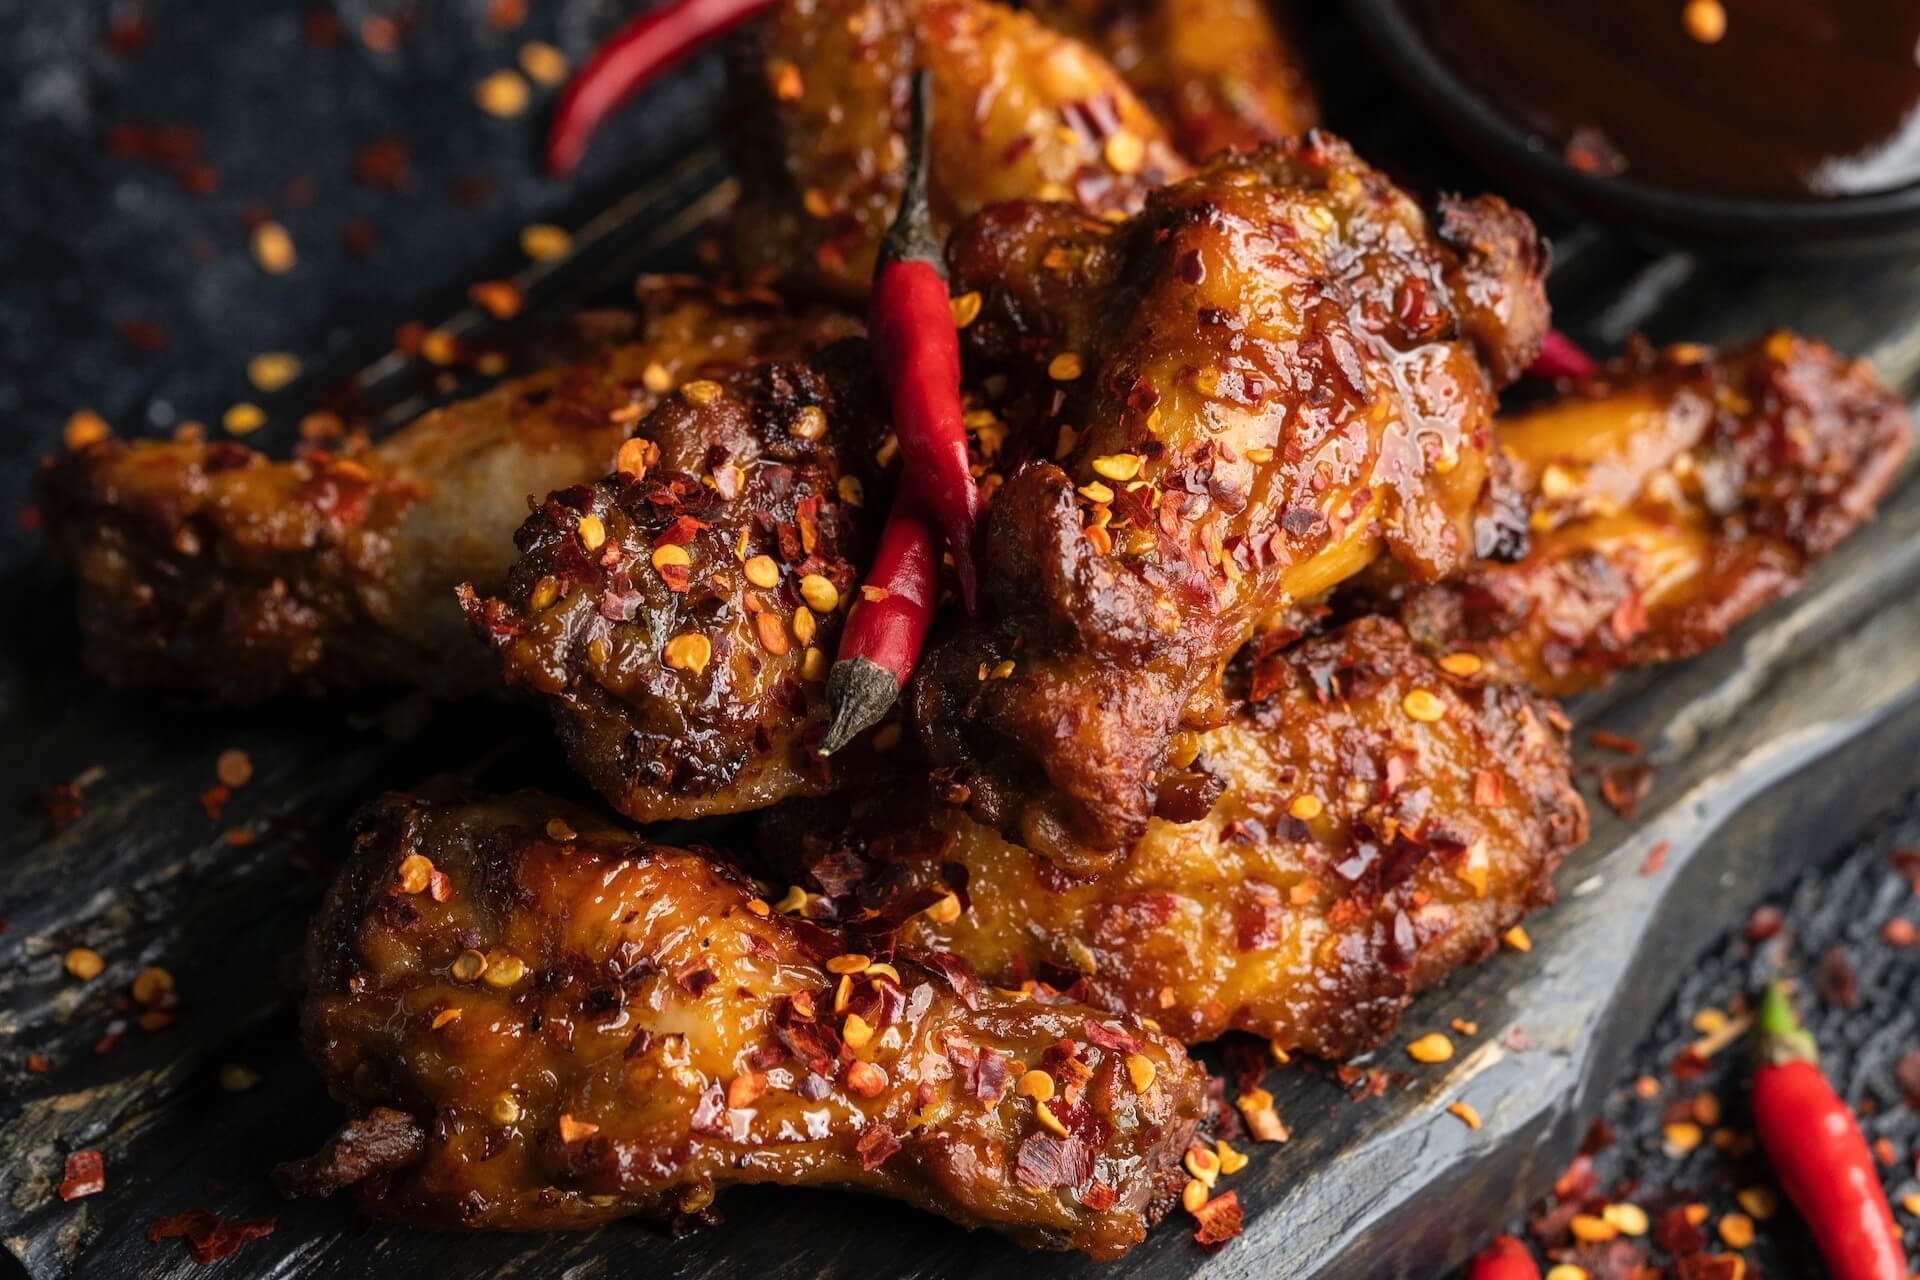
  • Speed Demon: Curious about the fastest-growing menu item on the US? Well, wonder no more: Datassential says it’s the barbecue chicken wing. Over the past year, they’ve grown 373 percent on menus across the States. Datassential posits the overall growth of chicken and the embracing of flavor trends like Carolina gold barbecue sauce are contributing factors.

There’s a lot to unpack here, so I’ll leave you to it. Just remember that when it comes to fads and trends, there’s a fine line between what’s hot, what’s not, and jumping on the wrong one. Good luck!

Image: Ahmed Bhutta on Pexels

KRG Hospitality Start-Up Restaurant Bar Hotel Consulting Consultant Solutions Plans Services

by David Klemt David Klemt No Comments

Should You Offer Your Guests Brunch?

Should You Offer Your Guests Brunch?

by David Klemt

Person with tattoos pouring coffee from French press

Is brunch on its way to becoming a lucrative daypart that can grow traffic, increase revenue, boost guest engagement, and promote loyalty?

If a report from Square is anything to go off, yes.

Owing in part to changes in consumer behavior from 2019 to now, brunch appears to be a solid traffic and revenue generator. The number of people working from home is impacting daypart spending, which makes sense. Traditional office workers will often pop into a QSR or cafe for coffee and breakfast on their way in to work. And when lunch rolls around, they tend to head out to restaurants nearby for their break.

Now, the data support the belief that more people are staying home on weekdays and unleashing pent-up demand for socializing and dining out on the weekends. And apparently that demand is rather voracious, because brunch appears to be on the rise.

In 2019, just over eight percent of all dining dollars were spent on Saturdays during traditional brunch hours. That has grown to just over ten percent this year.

In terms of engagement and bringing more brand awareness, the term itself is growing on social media platforms.

Along with revisiting hours of operation, it may be wise for operators to consider offering Saturday or Sunday brunch.

Bristory

Yes, that’s a brunch-style portmanteau of “brunch” and “history.” No, I’m not proud of myself but I’m leaving it in.

The portmanteau “brunch” is believed to have first been coined by a British writer named Guy Beringer in 1895. He included the word in an article he wrote for Hunter’s Weekly. Beringer was making the case for noontime meal that combined breakfast and lunch.

In arguing for what may be the world’s first hybrid meal, Beringer wrote that, “the arguments in favor of Brunch are incontestable. In the first place it renders early rising not only unnecessary but ridiculous. You get up when the world is warm, or at least, when it is not so cold. You are, therefore, able to prolong your Saturday nights…”

The word would appear a year later in a Pennsylvanian publication called the New Oxford. More than 30 years later, brunch was on its way to becoming “a thing” in the US.

Oh, and there are arguments that an American reporter, Frank Ward O’Malley, who should credit for the word “brunch.” Those who believe this is the case say O’Malley created the portmanteau some time between 1906 and 1919. As is the case with many classic cocktails, the origin of brunch is at least somewhat hazy.

By the 1970s, the stigma that once came with brunch—that drinking publicly during the day could harm one’s reputation—began to dissipate.

Brunch by the Numbers

According to Square, brunch is appealing for several reasons.

Let’s take a look at this infamous daypart by the numbers.

  • 9.8 percent: Growth in the number of restaurants in the US offering breakfast and brunch in 2022 alone.
  • 10 percent: Amount of overall spending in restaurants on Saturdays between the hours of 8:00 AM and 1:00 PM in 2023.
  • 35 million: Number of #brunch Instagram posts, and the number is growing.
  • 4.5 billion: Number of TikTok views of posts with #brunch.
  • 71 percent: Number of Americans who wish restaurants in the US would serve breakfast items all day.

To me, the most striking statistic is that brunch spending now accounts for ten percent of all restaurant spending.

That spend is logical when we think about who tends to enjoy brunch: people with time and money to spend on a leisurely, all-day meal.

As professor Farha Ternikar, author of Brunch: A History, has said, “Brunch continues to grow anywhere there is disposable income or time.”

So, operators who are considering offering brunch for the time or investing more into brunch have some questions to answer: Who is my target audience? What’s the population density of my market? Who has disposable income and time? Should I offer brunch on Saturday, Sunday, or both days? Does brunch work for my concept? Which venues near me are already offering brunch?

Answer those questions and speak with your staff before jumping feet first into this potentially lucrative daypart.

Image: Helena Lopes on Pexels

by David Klemt David Klemt No Comments

Ovation Reveals 5 Secrets for Growth

Ovation Reveals 5 Secrets for Growth

by David Klemt

Sign that reads "We hear you."

Restaurant guest feedback platform Ovation CEO Zack Oates reveals five secrets to what he calls the “digital table touch.”

The company touts itself as the number-one guest feedback platform. Ease of use is one reason the Ovation is viewed so favorably. Guests receive a two-question survey via SMS. Operators receive honest feedback they can use to improve guest retention and loyalty.

Those curious in learning more about the platform can check out several case studies on the Ovation website. Odds are, one of these studies matches closely with an operator’s own business.

For the purposes of this article, I’m going to focus on Oates’ 2023 Bar & Restaurant Expo education session. Getting even more granular, I’m going to drill down to Oates’ digital table touch approach to guest feedback and retention.

If Oates’ startling claim about first-time guests is true, guest retention is even more difficult than many operators would think. According to Oates, 70 percent of first-time guests don’t return to a restaurant. That number is, simply put, too damn high. Fifty percent is too high.

Feedback Reality

Let’s be honest about in-person feedback. While there are some honest guests out there, for some reason people tend to leave without being honest during their visits. In the moment, most of us will say “great” or “very good” when asked by a server or manager about our restaurant experience.

This is a compelling phenomenon. Per Oates, 15 percent of dine-in orders have issues. And yet most guests won’t say about an issue during their visit. That rate doubles to 30 percent for delivery orders, by the way.

Being totally transparent, Oates says he behaves the same in restaurants. He’s the CEO of a restaurant feedback platform and he’ll still say everything is fine during a visit even when it isn’t. So, while physical table touches are important, they’re likely not giving an operator an accurate picture of what’s going on in their dining room.

In fact, Oates says rather bluntly that “table touches are out of touch.” Further, they’re not scalable, off-premises, honest, or capable of fixing root issues, in his opinion.

Likewise, long-form surveys. According to Oates, long feedback surveys have an abysmal take rate: 0.01 percent. At that point, the rate may as well be zero. Online reviews, as may operators likely know, don’t really represent most guests.

The best solution to secure honest, actionable feedback appears to be Ovation’s SMS-based process.

Secret #1: Make Measurement Frictionless

Hot take: The easier a thing is to do, the more people will participate.

So, operators who want collect valuable guest feedback need to make it simple. If a guest orders delivery, operators should stuff carryout bags and top boxes with a call to action. For in-person dining, they should add a feedback CTA to table toppers. QR codes can make the process very easy. CTAs need to be visible and simple to complete.

The winning formula seems to be a two-question survey and collecting guest data. So, operators should consider enrolling guests who participate and leave feedback in a $100 gift card draw (or something similar).

Secret #2: Drive 5-star Reviews

Oates says that operators should push guests to rate their experiences on review sites. Doing so not only results in collecting valuable feedback, it can boost reviews and increase a restaurant’s visibility. The more discoverable a restaurant is, the more traffic it can potentially see.

Also, a note on actual five-star reviews: that’s not the best score. People tend to distrust perfect scores and one-star reviews. Per Oates, the best score is 4.7 stars, and operators should aim for at least a 4.0.

Secret #3: Respond to Feedback

This means good and bad feedback, and in a timely manner. Per Oates, one bad review reaches 30 potential guests. So, it’s best to address the situation as quickly as possible—if an operator can do so without losing their cool.

To ensure that emotions don’t prevail over rational responses, follow the Three Cs of Bad Review Recovery:

  1. Collected.
  2. Compassionate.
  3. Call to action.

Remember, people want to feel important. When they leave a bad review the underlying feeling driving the review is likely a sense that they’ve been disrespected. Operators attempting to recover from a bad review need to make the reviewer feel acknowledged and important.

Secret #4: Discover and Act on Trends

A business term that has been making the rounds for years now is “kaizen.” This is the concept of everyone in an organization working toward making incremental improvements to the business.

Savvy operators will set aside their egos, find trends within the feedback they receive, and work to improve on any shortcomings.

Secret #5: Text Guests to Bring Them Back

As I’ve said before, if you really want to meet guests where they are, reach them on the phones in their pockets. However, Oates has more advice than simply, “Text them surveys.”

To boost participation, tempt guests with an offer. Oates says to make the offer a good one. So, operators should consider the following:

  • Come up with an offer and put it first.
  • Make it a good offer: “The first X amount of people to complete this survey will receive 15 percent off their next visit.”
  • Track participation via a link.

While operators can leverage each of the above secrets on their own, Ovation’s digital table touch process is seamless and easy to implement. Either way, collecting honest guest feedback and acting on it is one of the most effective methods for improving guest retention.

Image: Jon Tyson on Unsplash

KRG Hospitality tech stack consulting. Tech. Technology. CRM. POS. Restaurant. Bar. Cafe. Lounge. Hotel. Resort.

by David Klemt David Klemt No Comments

4 Takeaways from Resy’s State of Dining

4 Takeaways from Resy’s State of Dining Report

by David Klemt

Guests enjoying an array of dishes at a restaurant

The State of Dining and What’s To Come in 2023 from Resy is an informative report that highlights several key developments to watch this year.

In fact, Resy’s report shines a light on ten trends and predictions for operators to consider. However, I’m going to address the four that stand out the most (to me).

For those who may be unfamiliar with Resy, the company is an online reservation platform. While Resy mostly serves major American cities, it does have a presence in Toronto, Canada, and London, UK.

Most importantly, the platform has a unique view of the industry. Resy looks at the industry through the lens of reservations, meaning they collect data concerning consumer behavior in real time.

So, let’s start with some compelling revelations based on reservation data. To view this report in its entirety, visit Resy via this link.

1. 5:00 PM

According to Resy, one reservation time is standing out from the rest. In comparison to 2019 and 2021, 5:00 PM reservations grew by two percent in 2022.

Now, two percent may seem like insignificant growth. However, given Resy’s reach and the platform’s number of active users, the opposite is true.

A two percent increase equates to hundreds of thousands of reservations.

Now, think about your restaurant or bar and consider your reservation distribution. Do you know which hour sees the most reservations? Not an assumption—do you have the data and therefore know the time?

If not, that’s information you need. Not only is this important for scheduling and controlling costs, it’s the benchmark you need to know if you have any chance of tracking change.

2. The Return of In-person Dining

This is one prediction that multiple industry (and even non-industry) publications are making for 2023. It’s the same for hospitality industry platforms: Companies see 2023 as the year restaurants and bars really come roaring back.

But when Resy makes this prediction, they’re using their reservation data to back it up.

First, last summer represents the single busiest season in the platform’s nine-year history. Second, a specific event, a dinner with chef-operator Massimo Bottura, sold out via Resy in a minute.

Third, October 2022. Why is this month worth pointing out in particular? By October, more Resy users had visited restaurants in 2022 than they had during the entirety of 2021.

Clearly, Resy expects this trend to continue and strengthen in 2023. Given their access to reservation data, this seems like a well-informed prediction.

3. Miami

In December of last year we checked out the best states in America for starting a business. Pennsylvania stood out to us for obvious reasons: our Northeastern office is in Philadelphia, with Kim Richardson at the helm.

Overall, Pennsylvania holds the number four spot on the Forbes list. For comparison, Florida slots in at number 45.

However, Miami appears to be an outlier for restaurant and bar entrepreneurs when it comes to Florida.

Per Resy, the restaurant footprint in Miami grew fourfold from 2017 to 2022. Moreover, Resy is seeing continuous growth in Miami. Going even further, this growth is coming from local and outside operators.

In fact, Resy describes South Florida as “white hot for high-profile sequels.” An operator has a top-tier concept? They’re likely to expand into Miami.

4. TikTok

Last week I addressed Datassential weighing in on photos versus videos. According to the F&B research firm, video is now dominating social media engagement.

And also last week, I explained the importance of discovery functionality. Operators who are considering adding a platform to their tech stack should consider whether it will help people discover their restaurant, bar, or hotel.

Resy is a platform that doesn’t just offer discoverability, it’s a core feature. So, when they say that TikTok appears to be a powerful discovery tool for restaurants and bars, that’s likely true.

Now, a poll Resy cites in their report reveals that traditional word of mouth is the top method of discovery. However, the same poll cites that TikTok is the top discovery platform for 43 percent of Gen Zers. Or, in other words, video, or digital word of mouth.

Should operators jump on TikTok? That’s something only individuals can determine is good for their business.

But if they’re courting Gen Z, well…they may need to add TikTok to their social media toolbox.

KRG Hospitality Success Session, 2023 icon

Image: Meredith Jenks for Resy

by David Klemt David Klemt No Comments

Picture vs. Video: Datassential Weighs In

Picture vs. Video: Datassential Weighs In

by David Klemt

Vintage Rolleiflex camera

If you want to meet guests—both regular and new—where they are, it helps to know how they prefer to consume social media content.

However, I’m not talking about which platforms are the most popular. We’ll get to that, but I’m talking about the content itself.

It appears that two camps are emerging: Team Picture and Team Video. And yes, they appear to follow demographic delineations.

Veteran operators and front-of-house teams know the drill. It’s standard for a server to drop food off and phones to hover over dishes immediately.

Bartenders, of course, also know the routine. In fact, bartenders working behind the stick across the globe know chronically online guests will come seeking specific drinks because they’re “Instagrammable.”

Hey, I’m not above it—I’ve snapped pics at bars and restaurants known for their innovative drink presentations. The same can be said about certain dishes at particular restaurants.

But is that camera just rapid-fire snapping photos? Or is it becoming more common for the guest holding the phone to record video?

Luckily, F&B market research agency Datassential has data-driven answers to those questions.

Still Photography vs. Moving Pictures

Okay, I’ll admit that this subheading title is a bit lame. Whatever—I’m keeping it in.

At any rate, you know what I’m talking about here, pictures versus videos. Interestingly, Datassential suggests that our industry is already at least a bit behind in this debate.

As they say in their latest Foodbytes report, 2023 Food Trends, “It seems like the food industry only just figured out how to cater to the importance of photography and Instagram and now it’s all being replaced by video.”

Specifically, Datassential speaks about short-form video in this report. Essentially, the agency is saying that guests (younger generations, in particular) are “over” still or static images of F&B items.

Today, just like video killed the radio star, video is on a still photography killing spree. And as I mention above, Datassential’s data reveals what people expect regarding this topic when it comes to age groups.

Unsurprisingly to some, Gen Z is most likely to consume video content. It follows, then, that 67 percent of this group has taken video of food at a restaurant or at home.

Next up, at 54 percent, is Millennials. Forty percent of Gen X says they’ve taken video of food at a restaurant at home. Just 18 percent of Baby Boomers have done so.

Where are People Consuming Video Content?

So, that’s the “who.” Now for the “where.”

According to Datassential, these are the top platforms for video consumption:

  1. BeReal: 11 percent
  2. TikTok Live: 25 percent
  3. Twitter video: 27 percent
  4. Snapchat video: 35 percent
  5. Instagram Reels: 38 percent
  6. TikTok: 41 percent
  7. Facebook Live: 41 percent
  8. Instagram videos: 44 percent
  9. Instagram Stories: 45 percent
  10. Facebook Stories: 48 percent
  11. YouTube: 77 percent

Does this mean you need to create content for each platform? Well, unless you somehow have the time or a digital marketing team, probably not.

Instead, you’ll want to pick the platforms that make the most sense for your brand and audience. There are also cross-posting tools that can save you time and simplify the process.

Takeaway

It’s up to individual operators to choose their social channels. The same is true for what they plan to post, photos or videos.

There’s a different consideration I want operators to keep top of mind. If video continues to dominate social, think about what could happen to dining rooms. It won’t be unusual for “influencers” to break out handheld lighting equipment to create videos. And I think we all know what that will do to the atmosphere in restaurants, bars, and lounges.

As strange as it may seem, operators may need to post signs banning flash photography and lighting for videos. Otherwise, the guest experience will diminish. Who pays the price for that negatively impacted experience? Not the influencer; the operator takes the hit in their reviews and traffic.

If video is here to stay, operators need to observe their dining rooms and adjust accordingly. That doesn’t just mean crafting video-worthy interiors and menu items. Now, it also means protecting the guest experience.

Image: Alexander Andrews on Unsplash

KRG Hospitality, Intro to Garnishes

by David Klemt David Klemt No Comments

Top 10 US Metro Areas by Inflow, Q3 2022

US Metro Areas with Greatest Outflow and Inflow, Q3 2022

by David Klemt

Tower Bridge in Sacramento, California

Real estate brokerage Redfin identifies the top ten American cities in terms of inflow and outflow, according to Q3 data.

Interestingly, a quarter of people appear to be searching for homes in cities different from where they currently live. Also compelling: one state, per the brokerage’s data ending in the month of October, is a clear favorite.

Obviously, this is important data for operators to have. When it comes to labor and guest pool changes, inflow and outflow information can be quite useful.

Top Inflow Cities: August to October 2022

Review the list below to see the metro areas experiencing the greatest inflow.

  1. Orlando, Florida
  2. Dallas, Texas
  3. North Port, Florida
  4. Cape Coral, Florida
  5. Phoenix, Arizona
  6. Tampa, Florida
  7. San Diego, California
  8. Miami, Florida
  9. Las Vegas, Nevada
  10. Sacramento, California

Did you spot the big trend? The state of Florida represents 50 percent of the list. Per Redfin‘s interpretation of the data, home buyers want leave expensive coastal cities behind.

Interesting to us in particular, two cities—Las Vegas and Orlando—are key KRG Hospitality markets. Also interesting is that Nevada and Florida are on the back half of Forbes’ best cities for starting a business in 2023.

However, we’ve seen strong hospitality industry recovery in Las Vegas this year. In fact, even the entertainment industry in Las Vegas is exploding. Additionally, we continue to gain clients in Orlando.

Top Outlow Cities: August to October 2022

Below are the metro areas seeing the greatest outflow.

  1. Philadelphia, Pennsylvania
  2. Seattle, Washington
  3. Denver, Colorado
  4. Detroit, Michigan
  5. Chicago, Illinois
  6. Boston, Massachusetts
  7. Washington, DC
  8. New York, New York
  9. Los Angeles, California
  10. San Francisco, California

If we compare Redfin’s Q2 data to the list above, it’s mostly the same. In fact, the top four outflow cities are identical. Spots five through nine are simply a reshuffling of Q2 and Q3 data.

However, Minneapolis, number ten in Q2, is replaced by Philadelphia in Q3. According to Redfin data, those Philly residents searching for homes elsewhere are showing interest in Salisbury, Maryland.

Consider how expensive it can be to move to and live in LA and San Francisco. It makes sense that California is the only state with two cities on the list above, doesn’t it?

Per Redfin, San Francisco residents are searching Sacramento and Seattle. Those in LA are looking at San Diego and Las Vegas.

Takeaway

It’s important to know where people are moving to and what cities they’re leaving behind. And it’s interesting to get a data-driven view of which states may be best for starting a business.

However, it’s far more useful to know how feasible a given ZIP code may be for a specific concept. So, while these types of lists are helpful, they’re not as practical as a targeted feasibility study.

Moreover, the dust doesn’t appear to have settled when it comes to migratory patterns of home buyers. It’s quite possible that Redfin’s 2023 inflow and outflow data will change once again in Q1 and Q2.

Image: Stephen Leonardi on Unsplash

by David Klemt David Klemt No Comments

Traffic Up but Margins Thinner

Traffic Up but Margins Thinner

by David Klemt

Chef checking tickets

The One Table 2022 report from Datassential focuses on the state of the operator and what the industry can expect moving forward.

This informative report shares survey results from 801 operators across America. While some of the findings are positive, it’s clear many operators are enduring significant challenges.

For some, traffic and sales are up. However, that’s not the situation others find themselves in.

To download and review the Datassential One Table 2022, please click here.

The Respondents

For this report, Datassential shares the survey answers from 801 respondents.

Most survey respondents are independent operators. In fact, they account for 71 percent of the participants. Making up the rest of the field are chain operators (15 percent) and franchise operators (14 percent).

As far as segment types, the majority of survey participants operate in the fast-casual space (18 percent). Unsurprisingly, fine dining is the smallest group of respondents at six percent. Thirteen percent operate midscale restaurants, and 12 percent are at the helm of casual-dining concepts. Somewhat surprisingly, just ten percent of participants operate QSRs.

Interestingly, the service format is fairly even among survey participants. Fifty-three percent of operators are full-service and 47 percent are limited-service.

Similarly, survey respondents represent the country’s regions pretty evenly:

  • South: 30 percent
  • Midwest: 29 percent
  • Northeast: 21 percent
  • West: 20 percent

In terms of market type, most respondents operate in the suburbs (49 percent). Following somewhat closely are urban-market operators, at 31 percent. Just 20 percent of survey participants operate in rural markets.

Traffic, Sales and Margins

At first glance, Datassential’s survey reveals positive news.

Now, I’m sure people find the terms “pandemic, “pre-pandemic,” and “post-pandemic” exhausting at this point. However, there’s no denying we continue to feel the aftershocks sent through the industry by the pandemic.

So, how do things look now in comparison to pre-pandemic traffic and sales levels?

First, the positives. Nearly half of survey respondents—47 percent—say their traffic is up in comparison to where it was pre-pandemic. Add to that the 14 percent who say their traffic is the same and 61 percent of operators appear to be in good shape.

In terms of sales, 51 percent of survey participants have good news. That news is that their sales are higher in comparison to pre-pandemic levels. Again, add the 14 percent who don’t see any change. So, that’s 65 percent of operators who appear to be performing well.

But with the good there’s bad. Unfortunately, 39 percent of respondents report lower traffic than pre-pandemic levels. And sales are lower than they were before the pandemic for 35 percent of survey participants.

Operator margins are lower for all respondents. Generally speaking, the profit margin for operators before the pandemic sat at 21 percent. Now, the average is 13 percent. QSRs and fast-casual restaurants are a bit higher among survey respondents: 17 percent and 15 percent, respectively.

On paper things do look up for many operators. However, the industry is still suffering, with a third struggling to rise to even pre-pandemic levels of traffic and sales.

Image: Daniel Bradley on Unsplash

by David Klemt David Klemt No Comments

These are the Happiest Provinces in Canada

These are the Happiest Provinces in Canada

by David Klemt

Newfoundland and Labrador during daytime

If you’re wondering which province in Canada is the happiest, Statistics Canada has the answer—and the happiest may surprise you.

Of course, those who live and work in the happiest province won’t find it shocking. After all, they’re largely happy to be there.

However, if you expect the happiest province to be the home of Toronto, Vancouver, Montreal or Canada… Well, you’re in for a surprise.

Earlier this week we took a look at the happiest cities and states in America. Congratulations Fremont, California, and Hawaii, respectively. To learn where 181 other cities and 49 states rank, please click here.

The Happiness Survey

Or more accurately, the “life satisfaction” survey. For this survey, that’s what Statistics Canada reveals: life satisfaction.

Interestingly, the survey is very simple. Apparently, Statistics Canada simply asked participants to rate the satisfaction of living in their province, zero through ten. For this survey, zero is least satisfied, ten is most.

Ages 15 through 75 (and older) were able to participate. The survey was also broken down to gauge the satisfaction of men and women.

Before we jump into the breakdown of province satisfaction or happiness, some good news. Reviewing the Statistics Canada data, most participants across all age groups are happy. In fact, age groups 65 to 74 and 75-plus appear to be happiest.

On the other side, ages 15 to 54 had the most people who rated their life satisfaction between zero and five. Even so, just over 20 percent of survey respondents rated their satisfaction a five or less.

So, on the whole, Canadians seem satisfied or happy with their lives, regardless of the province in which they live. Personally, I find that to be great news.

The Happiest Province

Okay, let’s dive into the reason you’re here: to learn which province is the happiest.

  1. Newfoundland and Labrador
  2. Prince Edward Island
  3. Quebec
  4. New Brunswick
  5. Manitoba
  6. Alberta
  7. Saskatchewa
  8. Nova Scotia
  9. Ontario
  10. British Columbia

The above rankings are determined by the percentage of survey respondents who rated their life satisfaction eight, nine or ten. So, if you’re in Newfoundland and Labrador, Prince Edward Island or Quebec, wow—you’re apparently one incredibly happy person.

Conversely, below you’ll find the rankings as determined by the largest percentage of respondents who rated their satisfaction a five or lower. As you’ll find, the list below isn’t simply the inverse of the one above.

  1. Ontario
  2. British Columbia
  3. New Brunswick
  4. Alberta
  5. Nova Scotia
  6. Prince Edward Island
  7. Manitoba
  8. Saskatchewa
  9. Quebec
  10. Newfoundland and Labrador

As far as Canada overall, the results of this particular survey are positive. Just 19.4 percent of survey respondents rated their satisfaction or happiness zero through five. And only 28.9 percent provided a rating of six or seven.

More than half of Canadians, 51.7 percent, rate their lives an eight, nine or ten. That’s some great and welcome news.

Image: Erik Mclean on Unsplash

by David Klemt David Klemt No Comments

Which Cities and States are the Happiest?

Which US Cities and States are the Happiest?

by David Klemt

Yellow smiley face ball

As an entrepreneur and operator evaluating a market for a first location or expansion, it can help to know where people are happiest.

Equally as helpful: Knowing the cities and states that are the least happy. Not, necessarily, so an operator can avoid these markets.

Rather, one’s concept may be a ray of stress-free sunshine for a given community. Providing a great workplace with a positive culture can work wonders for both the happiest and least-happy places. And as the cornerstones of the communities they serve, restaurants and bars can improve their guests’ quality of life.

We’ve looked at the US cities with the greatest inflow and outflow (which can reveal happiness levels), as identified by Redfin. And we’ve checked out the best US retirement cities, researched by Clever.

Now, we’re taking a look at which US cities and states are the happiest and least happy, according to WalletHub. In case you’re unaware, personal finance site WalletHub researches a vast array of topics. You can browse them here.

Happiest Cities

While determining which are happiest, WalletHub identified the happiest 182 cities. Obviously, that’s a far cry from how many cities are in the US.

According to one source, there 19,495 cities, towns, and villages across the country (per data from 2018). Of those, 4,727 cities have populations of 5,000 or more. A total of 310 cities have populations of at least 100,000, and only ten are home to one million people or more.

So, living in any of the 182 cities WalletHub suggests one is pretty happy. However, these are the ten happiest cities, in descending order:

  1. Fremont, California
  2. Columbia, Maryland
  3. San Francisco, California
  4. San Jose, California
  5. Irvine, California
  6. Madison, Wisconsin
  7. Seattle, Washington
  8. Overland Park, Kansas
  9. Huntington Beach, California
  10. San Diego, California

As you can see, six of the 10 cities are in California. In fact, 29 of the 182 cities on this list are located in the Golden State.

To create their list, WalletHub analyzed several metrics that make up three main categories: emotional and physical well-being; work environment; and community and environment.

Fremont, CA, is number one for emotional and physical well-being. The top spot for work environment goes to San Francisco, CA. And the number-one city for community and environment is Casper, Wyoming, which is number 79 on the list overall.

Least-happy Cities

Again, understanding that there are more than 19,400 cities, towns, and villages in the US alters the context of this list a bit.

Living and operating in one of these 182 cities indicates a person is living in a happy city. Basically, it isn’t the worst place to live if it’s on this list.

At any rate, let’s look at the 10 cities that make up the bottom of WalletHub’s list. Or, the “least-happy” cities, at least as far as these rankings are concerned.

  1. Detroit, Michigan
  2. Gulfport, Mississippi
  3. Memphis, Tennessee
  4. Huntington, West Virginia
  5. Montgomery, Alabama
  6. Cleveland, Ohio
  7. Augusta, Georgia
  8. Fort Smith, Arizona
  9. Mobile, Alabama
  10. Shreveport, Louisiana

Happiest States

WalletHub also ranked 50 states to determine the happiest and least happy. I checked, and, yep, that’s all of ’em! I will say it’s a bit disappointing they didn’t include Puerto Rico, but it isn’t the 51st state (yet).

WalletHub focused on 30 metrics to rank the states, which make up three main categories: emotional and physical well-being; work environment; and community and environment.

In descending order, the happiest states in America are:

  1. Hawaii
  2. Maryland
  3. Minnesota
  4. Utah
  5. New Jersey
  6. Idaho
  7. California
  8. Illinois
  9. Nebraska
  10. Connecticut

Hawaii doesn’t just take the top spot overall, it also claims number one for emotional and physical well-being. Utah takes first for work environment, and community and environment.

Rounding out the “happiest half” of the US are:

  1. Virginia
  2. South Dakota
  3. North Dakota
  4. Massachusetts
  5. New Hampshire
  6. Iowa
  7. Delaware
  8. Florida
  9. Georgia
  10. North Carolina
  11. Wisconsin
  12. Washington
  13. New York
  14. Maine
  15. Wyoming

Least-happy States

Conversely, the following are the least-happy states, starting with the unhappiest:

  1. West Virginia
  2. Louisiana
  3. Arkansas
  4. Kentucky
  5. Alabama
  6. Mississippi
  7. Oklahoma
  8. Tennessee
  9. New Mexico
  10. Missouri

Filling out the least-happy half of the country are:

  1. Alaska
  2. Michigan
  3. Ohio
  4. Indiana
  5. Texas
  6. Nevada
  7. Vermont
  8. South Carolina
  9. Kansas
  10. Arizona
  11. Colorado
  12. Montana
  13. Rhode Island
  14. Pennsylvania
  15. Oregon

In terms of the three metrics WalletHub analyzed, West Virginia is ranked last for emotional and physical well-being. Unfortunately, Mississippi is last for work environment. And Texas comes in last for community and environment.

Image: chaitanya pillala on Unsplash

by krghospitality krghospitality No Comments

2023: Year of the POS Systems?

2023: Year of the POS Systems?

by David Klemt

SpotOn POS system on laptop

Image from SpotOn press release

According to SpotOn, the industry could be in for a tech revolution next year as independent operators pursue more powerful POS solutions.

The results of a survey conducted by the cloud-based POS platform are rather revealing. In an effort to better understand where the industry is heading, SpotOn surveyed 300 independent and small-chain restaurant operators.

Both full-service and limited-service (LSR) concept operators participated in this SpotOn survey. Intended to identify the challenges operators face currently, the results reveal much more.

Below, the picture these survey results paint for the industry.

Legacy vs. Innovation

This isn’t the first time I’ve stated the following: Our industry hasn’t been the fastest to implement new technology.

However, we did appear to turn that around in 2021. Now, heading into 2023, our industry may be pursuing cutting-edge tech solutions even more fervently. Today’s guest expects more tech, and your team likely wants access to more modern tech that makes their jobs easier.

Per SpotOn’s survey, 81 percent of independent operators still use so-called “legacy” POS systems. These are “traditional” systems from companies that have been around for quite some time.

It’s not difficult to understand why the vast majority of independent operators continue using legacy systems:

  • Investing in a new platform requires expenditures of money and time.
  • Introducing a new POS platform requires staff training.
  • Staff need to grow adept at using the new system.
  • It can be daunting to research the available platforms and implementing change.

So, independent and small-chain operators have a choice to make: Stick with the familiar or invest in the future. Change can not only be intimidating, it can be expensive.

However, it seems that most operators are ready to throw comfort to the wayside and embrace innovation.

State-of-the-art Benefits

Should the SpotOn survey prove to be accurate snapshot of the industry, 75 percent of operators will implement new tech next year. According to SpotOn, this is largely in response to growing labor challenges, such as scheduling and retention.

The restaurant, bar, nightclub, and food truck platform found that operators are spending as much as 20 hours per week on administrative tasks. State-of-the-art POS systems can slash those hours by:

  • streamlining operations;
  • making scheduling simpler;
  • calculating tips and payout for payroll; and
  • managing overtime, an increasingly common task.

More modern POS platforms can automate labor management tasks, saving operators time, money, and frustration. Automation and streamlining give operators something invaluable: time.

In particular, innovative and helpful tech solutions provide an operator with time to focus on growing their business. When weighing whether to keep a familiar but less feature-rich POS system or invest in a modern platform that seamlessly integrates many solutions, ask yourself a couple important questions:

  • What’s my time worth?
  • What am I focusing on every day?
  • Am I growing my business or stagnating?
  • Is my current POS system helping or hindering my team?
  • Does my POS system streamline and automate any tasks?

Image: SpotOn

Top