Notice: Function _load_textdomain_just_in_time was called incorrectly. Translation loading for the smart-post-show-pro domain was triggered too early. This is usually an indicator for some code in the plugin or theme running too early. Translations should be loaded at the init action or later. Please see Debugging in WordPress for more information. (This message was added in version 6.7.0.) in /var/www/wp-includes/functions.php on line 6114
Menu trends | KRG Hospitality - Part 2

Menu trends

by David Klemt David Klemt No Comments

F&B in Canada: Top Menu Items

F&B in Canada: Top Menu Items

by David Klemt

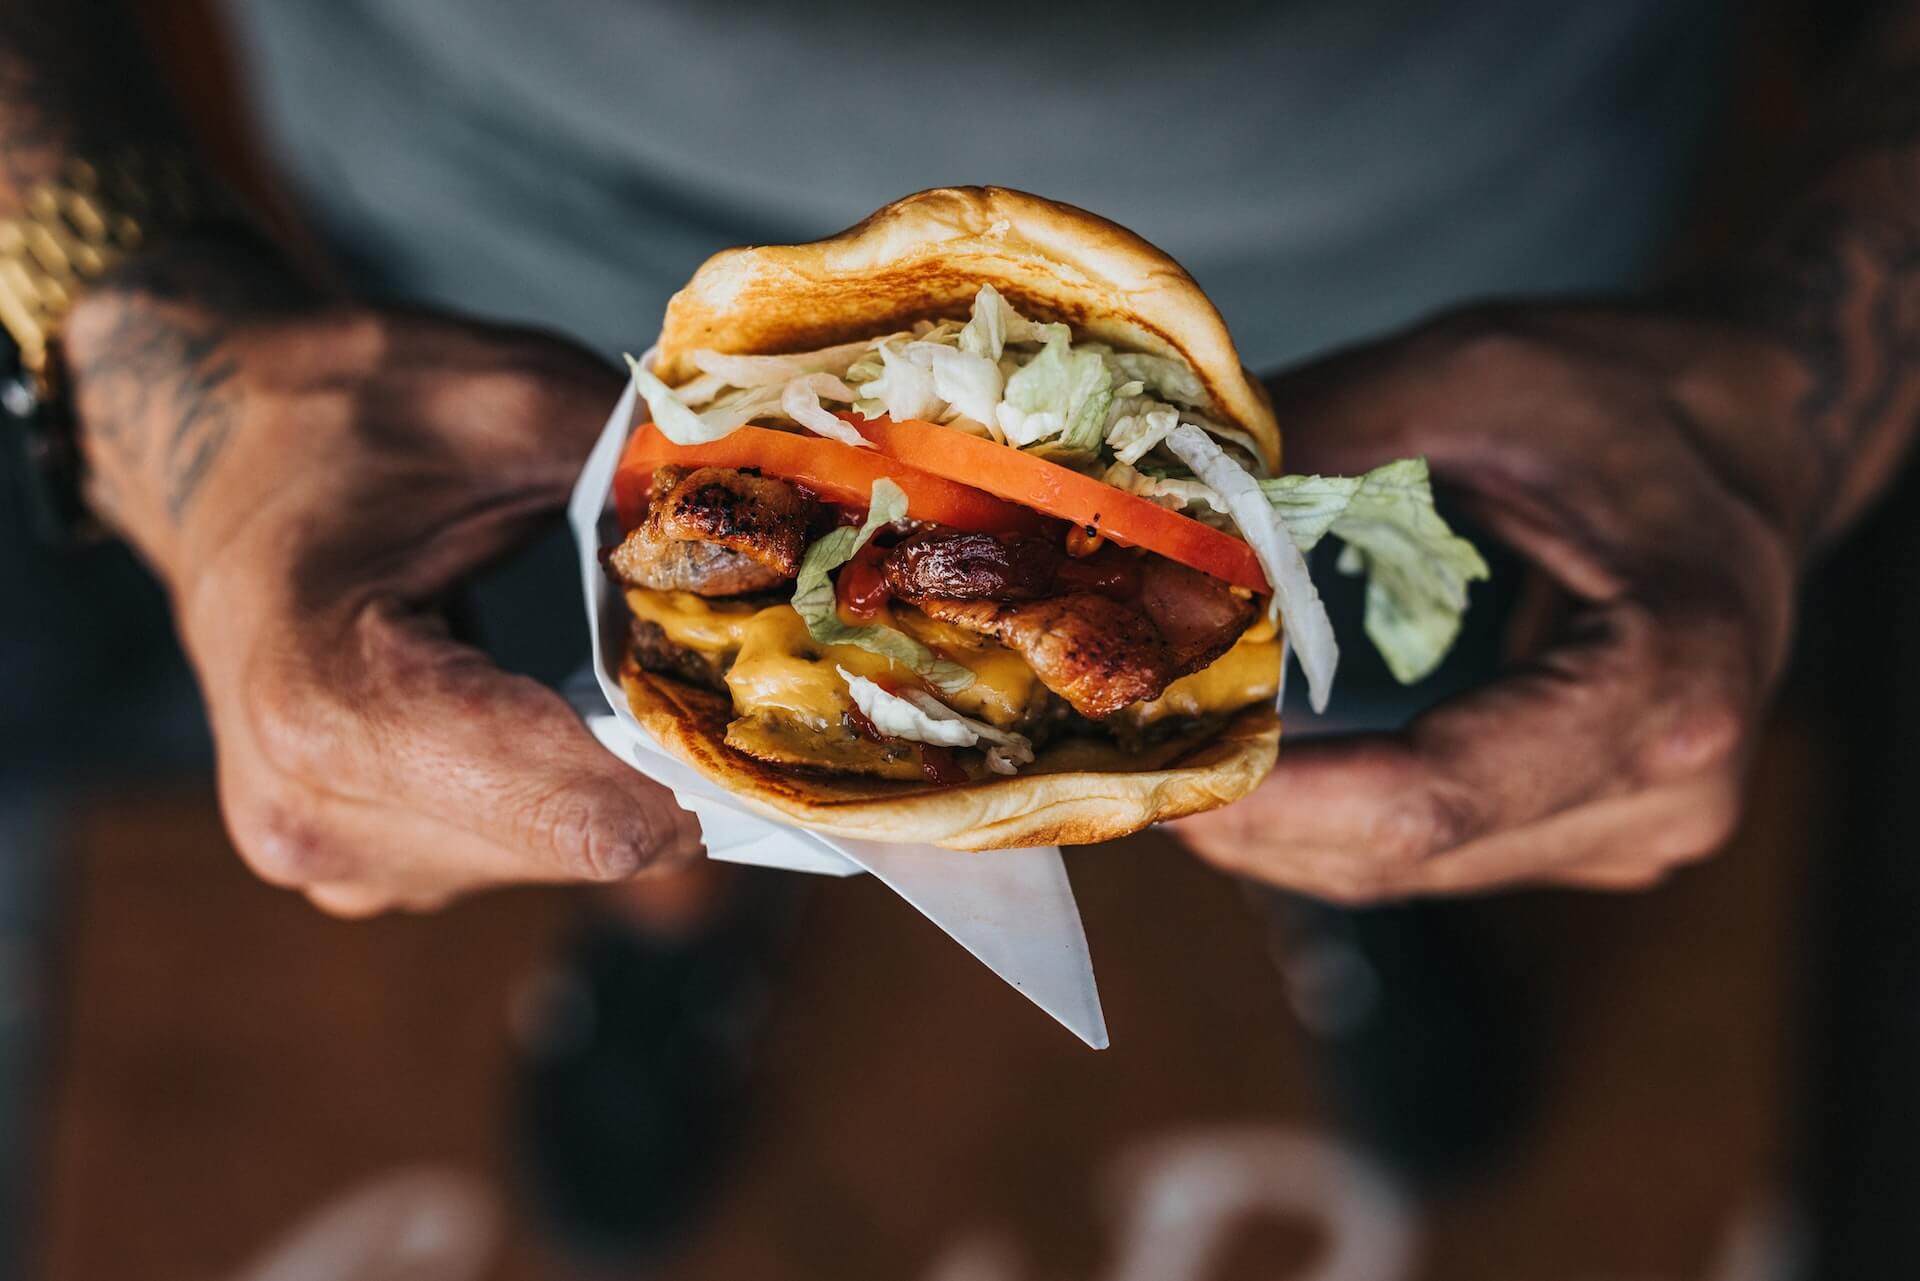
Closeup of hands holding burger

Those wondering what food and beverage menu items are performing best among consumers throughout Canada need wonder no more.

And why is that? Well, Restaurants Canada has the answers, revealing the top ten food and top ten beverage items.

Further, the organization compares each item’s performance. In this instance, Restaurants Canada analyses the percentage of orders that contained each food or beverage item from January to April 2022 in comparison to 2019.

These insights (and many more) are available in Restaurants Canada’s 2022 Foodservice Facts report. In fact, you can find our reviews of several of the restaurant advocacy group’s report topics via the links below:

For your own copy of this year’s Foodservice Facts report, click here.

Top 10 Canadian Drink Menu Trends

As you’ll see below, coffee is outperforming nearly every other beverage category. Specifically, Hot coffee is at the top, while Iced or frozen coffee is ranked third.

Unsurprisingly, Carbonated soft drinks / Pop / Soda split the two coffee categories. According to Restaurants Canada, the Carbonated soft drink category can credit its performance in large part to QSRs.

  1. Milk: 1.8% (2019) to 1.8% (2022)
  2. Iced tea: 2.9% (2019) to 1.6% (2022)
  3. Milkshakes / Smoothies: 2.1% (2019) to 2.0% (2022)
  4. Fruit juice: 3.8% (2019) to 3.0% (2022)
  5. Hot tea: 5.5% (2019) to 4.5% (2022)
  6. Alcohol beverages: 5.1% (2019) to 5.7% (2022)
  7. Water: 6.6% (2019) to 5.0% (2022)
  8. Iced or frozen coffee: 5.3% (2019) to 7.5% (2022)
  9. Carbonated soft drinks / Pop / Soda: 19.7% (2019) to 20.2% (2022)
  10. Hot coffee: 40.9% (2019) to 41.9% (2022)

Compellingly, Alcohol beverage performance in restaurants fluctuated by age group between 2021 and 2022. Alcohol order shares in restaurants, per Restaurants Canada:

  • Legal drinking Age (LDA) to 34: 46% (2021) to 43% (2022)
  • 35 to 49: 17% (2021) to 21% (2022)
  • 50-plus: 37% (2021) to 36% (2022)

Alcohol order shares in bars, according to Restaurants Canada:

  • LDA to 34: 35% (2021) to 35% (2022)
  • 35 to 49: 17% (2021) to 19% (2022)
  • 50-plus: 49% (2021) to 47% (2022)

Overall, the 35 to 49 age group appears to be consuming less alcohol in bars and restaurants in comparison to the LDA to 34 and 50-plus cohorts.

Top 10 Canadian Food Menu Trends

As Restaurants Canada notes, the Sandwich / Sub category has grown in 2022. Interestingly, the category just below it in growth, Chicken, is partially responsible for boosting Sandwich / Sub performance.

As far as entrees or “main attractions,” the Burger category remains at the top, beating out Breakfast, Sandwich / Sub, Chicken, and Pizza menu items.

  1. Cake / Squares / Muffins: 3.7% (2019) to 3.3% (2022)
  2. Salad: 4.3% (2019) to 3.8% (2022)
  3. Donuts / Beignets: 3.0% (2019) to 3.8% (2022)
  4. Breads: 4.3% (2019) to 3.4% (2022)
  5. Pizza / Panzerotti / Calzone: 4.1% (2019) to 4.3% (2022)
  6. Chicken: 7.6% (2019) to 8.5% (2022)
  7. Sandwich / Sub: 8.0% (2019) to 8.5% (2022)
  8. Breakfast: 10.8% (2019) to 11.4% (2022)
  9. Burger: 9.0% (2019) to 10.9% (2022)
  10. French fries / Potato / Sweet potato / Onion rings: 15.0% (2019) to 16.1% (2022)

Image: Nathan Dumlao on Unsplash

by David Klemt David Klemt No Comments

Canadian Trends 2022: Technomic

Canadian Trends 2022: Technomic

by David Klemt

Yellow neon "butter" sign and scaffolding

Curious about what to expect in 2022 as a Canadian restaurant, bar or hotel operator?

Technomic has some predictions for next year.

Reviewing their “Canadian Trends: Looking Ahead to 2022” report, creativity and streamlining will be keys to success.

Let’s jump in!

Butter

Yes, this is why I chose the image above. Technomic is very specifically identifying butter as an important 2022 F&B trend.

And no, they don’t appear to be predicting the popularity a particularly rare or esoteric butter. The industry intelligence firm means butter will prove important in 2022.

In large part, Technomic is pointing to comfort food as a driver for butter.

Generally, the firm points to how versatile butter is in the kitchen. Browned and herb-infused butters, says Technomic, will find its way into cocktails.

Flavor and texture will play an important role, extending the butter prediction into buttery foods territory. For example, Technomic predicts butterscotch, buttermilk and ghee will see a boost in usage and demand.

Additionally, the plant-based movement will help nut butters grow more popular. In fact, Technomic says nut butters will find their ways onto burgers and into cocktails.

Interestingly, the firm’s butter prediction gives operators two larger trends to watch: comfort food and plant-based.

Cross-utilization

You don’t need me to tell you that North America—and the rest of the world—is facing supply chain issues.

I know you’re exhausted from just the past nearly two years of constant adaptation and pivoting. In 2022, you’ll have to continue with your creative problem solving.

The supply chain challenge (there’s an understatement) requires creativity in several areas. This includes the kitchen and menu.

Technomic suggests that one path forward through supply chain problems involves ingredient preparations:

  • Pickling
  • Candying
  • Salt-baking

The firm says these creative takes on ingredients operators already have will extend product life; add new flavors to dishes; and deliver new textures. Those last two offer guests new experiences.

In addition, getting creative with the ingredients you may be able to get more readily will help streamline and update 2022 menus. However, revising your menu will require careful consideration of your supply chain and cross-utilization, with a heavy helping of creative prep.

Running Lean

Smaller footprints. Shrunken staff. Streamlined menus. Smaller, shrunken, streamlined, optimized, leaner…

Call the process whatever you want, Technomic is predicting that operators will need to “optimize” (read: make smaller) their businesses.

Of course, there isn’t a one-size-fits-all solution. We’ve read and heard predictions since last year about what will need to shrink moving forward.

While some recent news reports say that ghost kitchens are out, Technomic seems to think that’s not the case. Technomic suggests ghost kitchens will remain viable for operators who want to expand without investing in real estate.

Additionally, Technomic’s report suggests something that should come as no surprise. In short, if it works for a brand or location, smaller may be better and here to stay.

Growth

Now, this is the most promising of Technomic’s predictions: Growth.

Per the firm, the foodservice industry in Canada was down 29 percent in Q1 of 2021. Pre-pandemic, sales reached $95 billion. That represents a loss of nearly $30 billion.

However, there’s reason to be optimistic in 2022, according to Technomic.

The firm expects growth of 21 percent in 2022 over 2021, or sales of $74.8 billion. Should this prediction prove accurate, 2022 would close just three percent under pre-pandemic sales.

Technomic identifies full-service as the foodservice segment to experience the most growth next year at 26.2 percent. In comparison, the firm predicts limited-service to grow 7.3 percent.

Next year won’t be easy. 2022 won’t be a magical return to normalcy. But there is room for optimism if Technomic’s predictions are correct.

Image: Jon Tyson on Unsplash

by David Klemt David Klemt No Comments

Global Cuisine Performance

Global Cuisine Performance

by David Klemt

Cook making handmade pasta noodles

We don’t have a crystal ball to help us see which cuisines will be most popular. Obviously, the same holds true for knowing which are just now getting recognition.

However, we do have the next-best thing: data from Datassential.

Recently, the food and beverage analytics firm ranked dozens of global cuisines according to their current state of popularity among diners.

Then, they shared that information in October during their “Around the World in 80 Trends” webinar.

“Ubiquity”

When analyzing food and beverage trends, Datassential funnels them into four distinct designations: Inception, Adoption, Proliferation, and Ubiquity.

Arguably, once a trend reaches Proliferation and Ubiquity it becomes a mainstay. So, we can more than likely stop referring to it as a trend.

Now, the two most precarious stages for a trend are Inception and Adoption. Plenty of trends die on the Inception vine. Several won’t make it out of Adoption.

When you see Datassential’s list of global cuisines that fly under the Ubiquity banner, I doubt there will be much surprise:

  • Italian
  • Southern
  • Mexican
  • Creole/Cajun
  • Tex Mex
  • Chinese

So, any shocks to your system there? Most likely not.

“Proliferation”

Another to label this Datassential designation is “second most popular.” Each of these cuisines has a clear shot at reaching Ubiquity.

In fact, I find one of the global cuisines in this category surprising. It’s the first one in this list:

  • Japanese
  • Regional Italian
  • Regional Mexican
  • Greek
  • Mediterranean
  • Regional US
  • Southwestern
  • Cuban

As you’ll see, the lists grow longer steadily as we move down from Ubiquity.

“Adoption”

For me, it’ll be interesting to review follow-up data from Datassential regarding global cuisines.

As such, I’m eager to learn which cuisine from the list below reaches Proliferation in 2022:

  • Caribbean
  • Indian
  • French
  • Regional Chinese
  • Oaxacan
  • German
  • Middle Eastern
  • Korean
  • Ashkenazi
  • Hawaiian
  • Vietnamese
  • Venezuelan
  • Spanish
  • Sicilian
  • Jamaican
  • Israeli
  • Thai
  • British

To be honest, my first reaction to seeing French cuisine under the Adoption banner was surprise. Of course, I then thought back to how many French restaurants we have here in Las Vegas.

Sure, this little city in the desert is a foodie destination. However, French restaurants don’t dot the landscape like those that focus on other cuisines.

“Inception”

That brings us to the first stage of any trend: Inception.

Now, the first thing you’ll notice is that this category contains the most global cuisines. Whereas Adoption features 18, Proliferation lists eight, and a mere six have reached Ubiquity, Inception identifies two dozen.

They are as follows:

  • Brazilian
  • Mizrahi
  • Russian
  • Malaysian
  • Croatian
  • Moroccan
  • Lebanese
  • South African
  • Native American
  • Central American
  • Argentinian
  • Peruvian
  • Filipino
  • Appalachian
  • Sephardic
  • Ethiopian
  • Senegalese
  • Scandinavian
  • Sonoran
  • Nigerian
  • Iranian
  • Persian
  • Turkish
  • Polish

Again, there are some surprises here, at least for me. For example, I expected Ethiopian cuisine to have reached Adoption by now.

Takeaways

Of course, there are multiple ways to interpret this data.

First, you can embrace Ubiquity, leveraging their incredible popularity. However, standing out and building traffic will be challenging.

Second, you can feature Proliferation cuisine. Sure, these have yet to reach the Ubiquity stage. But they’re close to doing so, and you’ll also face stiff competition.

Third, focusing on cuisine from the Adoption designation involves taking a risk but mitigating it somewhat. These cuisines are developing a following and guest demand.

Finally, the riskiest move, depending on location: featuring Inception cuisines. But with risk comes reward. Identify a gap in a certain area—something we can do with our signature feasibility studies—and you may realize staggering success.

So, what do you think? Did you find any of Datassential’s designations surprising for certain cuisines? Let us know on our Instagram, Facebook, Twitter or LinkedIn pages!

Image: Jorge Zapata on Unsplash

by David Klemt David Klemt No Comments

How is Plant-based Performing?

How is Plant-based Performing On-premise?

by David Klemt

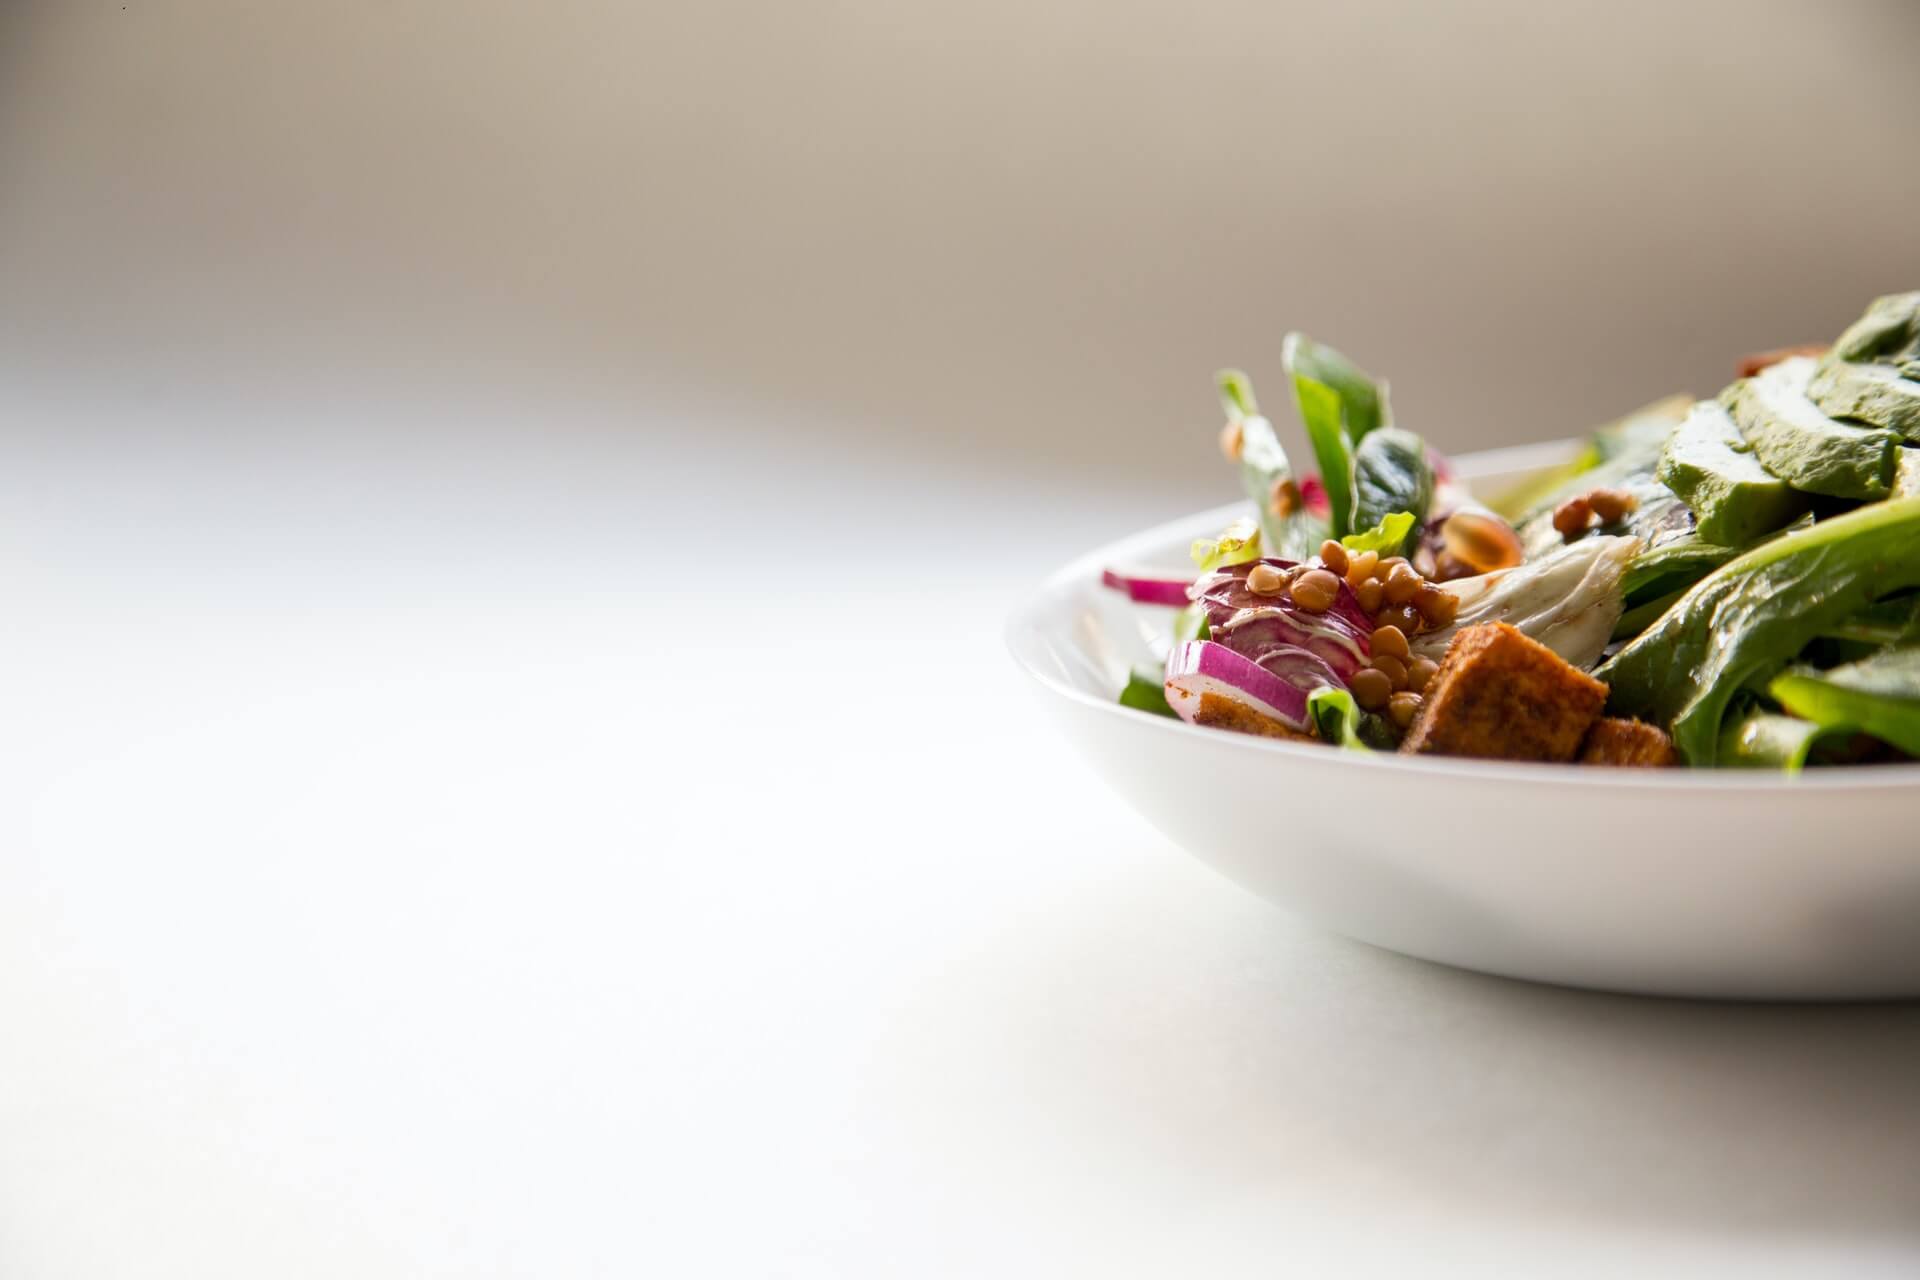
Plant-based food bowl

With plant-based food options making their way to global fast food chains, it’s clear the category is continuing to heat up.

In fact, it’s likely time to stop referring to plant-based menu items as a trend. Obviously, they’re here to stay.

But how are these items actually performing on-premise? Is the category experiencing real growth or barely noticeable?

“Proliferation”

We’re full throttle into the holiday season. People are focusing on spending time with family and friends.

And what does that mean? Gathering for meals.

So, if restaurant traffic is going to tick up, it makes sense to see if plant-based should be more prevalent on menus.

To that end, Datassential revealed data on this category two weeks ago during their “Holidays Ahead!” webinar. Of four trend-tracking designations—Inception, Adoption, Proliferation, Ubiquity—Datassential notes plant-based menu items are in the Proliferation stage on-premise.

Analyzing data from 2011 to 2021, Datassential showed that the category started growing in terms of menu placement in 2018. As of this year, plant-based items are on nearly five percent of restaurant menus.

That may not seem like impressive growth. However, there was zero-point-zero-percent growth between 2011 and 2014. In 2015 and 2016, Datassential shows that only 0.1 percent of restaurants offered plant-based menu items. That growth doubled in 2017 (0.2 percent), then doubled again in 2018 (0.4 percent).

In 2019, the category quadrupled to inclusion on 1.6 percent of restaurant menus. Last year, that growth more than doubled to 3.5 percent.

According to Datassential, 28 percent of consumers like or love plant-based menu items. Interestingly, the research agency finds that all types of consumers like plant-based items, not just vegetarians or vegans.

The Datassential breakdown of plant-based menu proliferation by restaurant category is as follows:

  • Fast Casual: 11.5%
  • Casual Dining: 5.4%
  • Midscale: 3.9%
  • Quick Service: 3.4%
  • Fine Dining: 1.8%

Chains are more likely, at this time, to feature plant-based menu items.

Upscale Options

Wanting to include plant-based options and knowing where to start are two different things.

As it happens, Datassential featured a timely real-world menu to that should inspire operators this season.

Watercourse Foods in Denver, Colorado, offers mains and sides that will resonate with holiday diners:

  • Seitan Roast (wheat, soy, blend of herbs) which stands in for roast turkey.
  • Pot Pie consisting of carrots, celery, onions and mushroom.
  • Root Vegetable Stuffing made with root veggies (obviously), savory herbs, and housemade bread.
  • Mac and Cheese featuring shells tossed in cheese fondue and topped with shiitake “bacon” bits and breadcrumbs.

As you’ll notice, you don’t need to limit your menu to products from Beyond or Impossible. Obviously, you can leverage their brand recognition but you can also utilize your current plant-based inventory to create housemade menu items.

If you’re ready to embrace plants at your restaurant or bar, activate your kitchen team. With a bit of creativity you can take advantage on the rise in popularity of everything plant-based.

Image: Hermes Rivera on Unsplash

Top