Report

by David Klemt David Klemt No Comments

Are “Substituters” Leading NA Growth?

Are “Substituters” Leading NA Growth?

by David Klemt

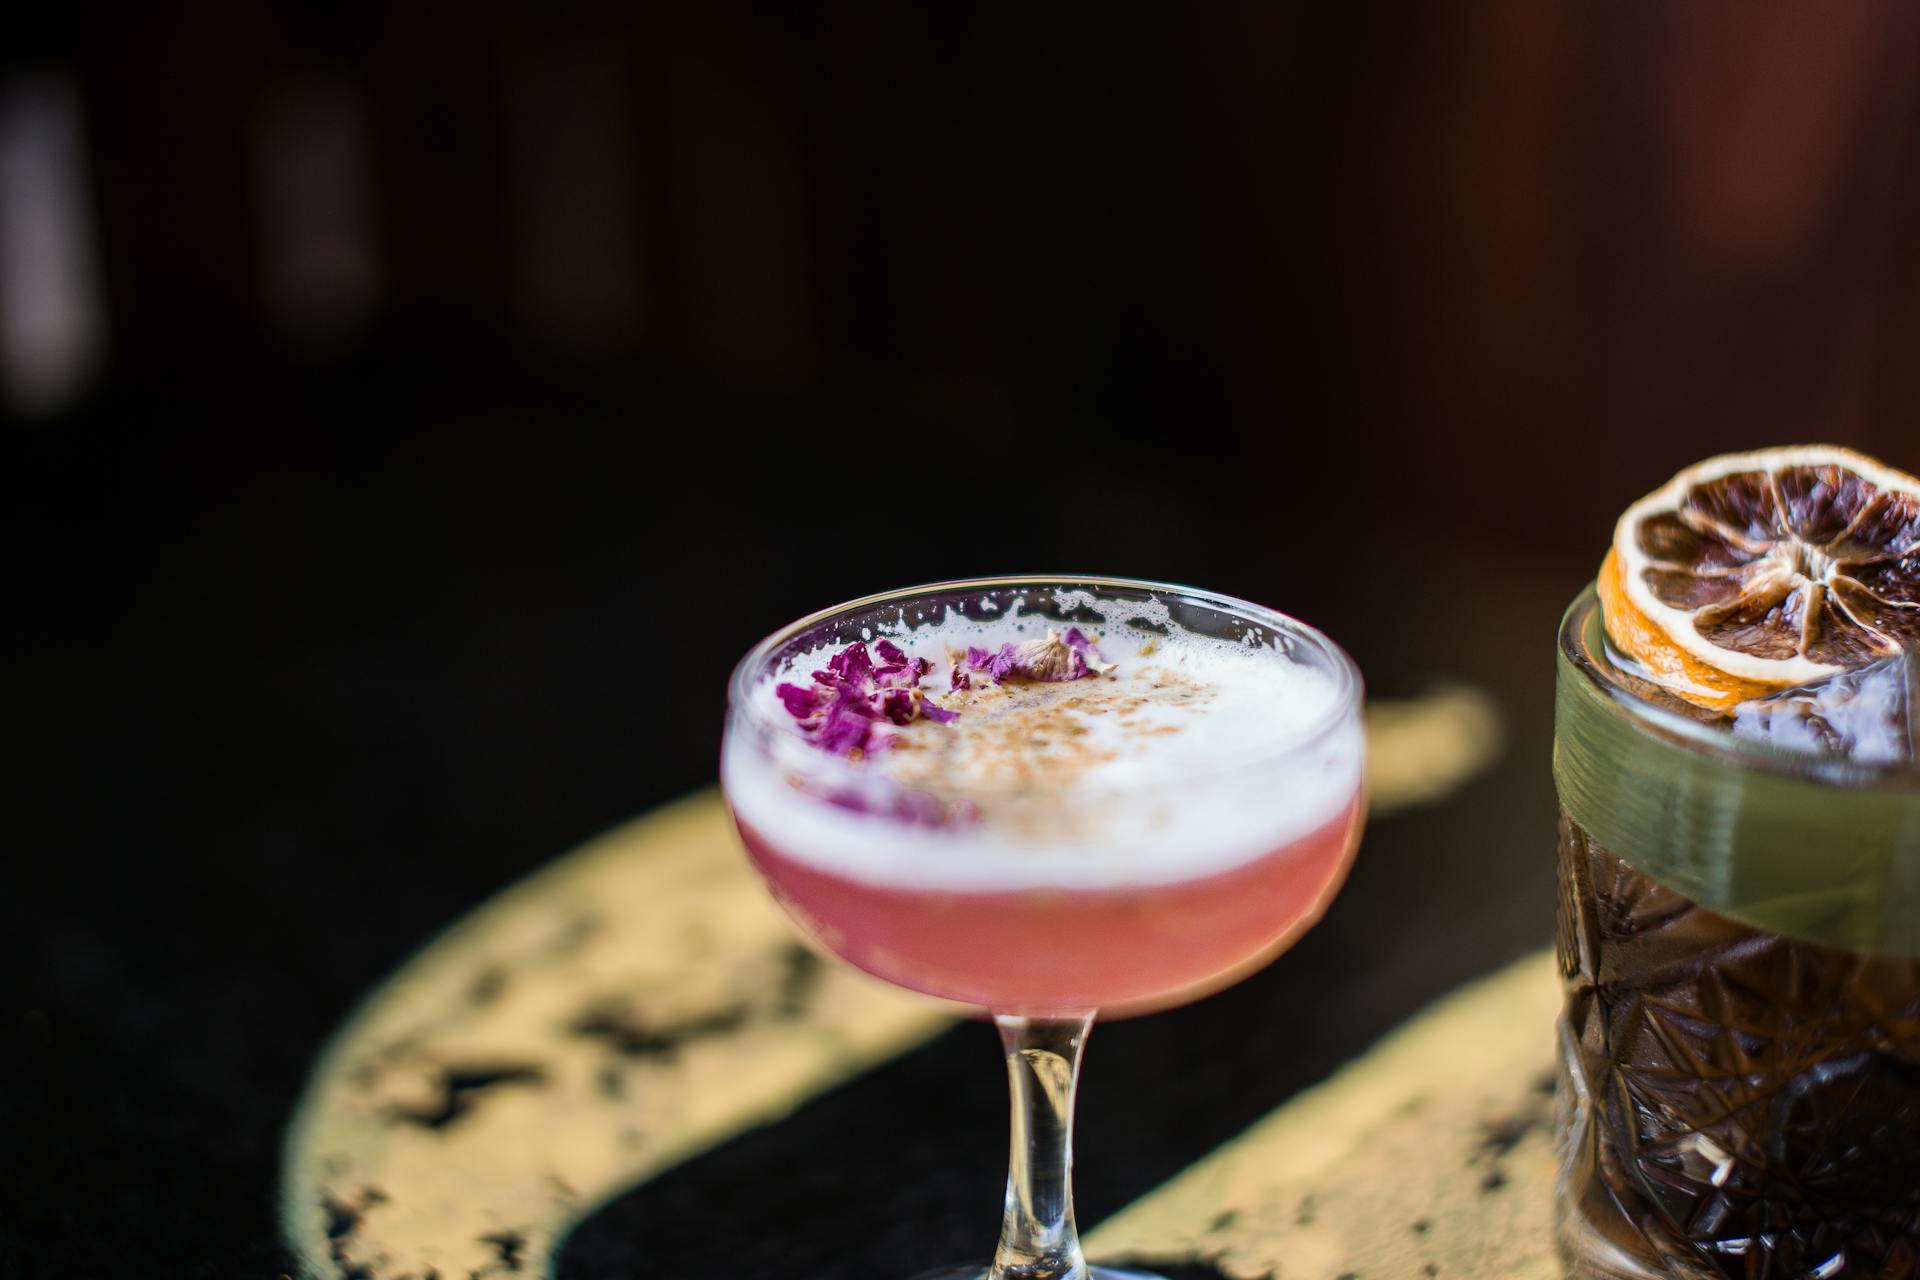
Cocktails with edible flowers and dehydrated fruit for garnishes

No-ABV, low-ABV, or full strength?

Revelations shared by the IWSR recently suggest that the very generation driving non-alcohol growth may also be driving traditional beverage alcohol growth.

At least, according to the IWSR, a particular generation is over-indexing in the non-alc category and “full-strength” categories such as rum, whisky, Champagne, brandy and Cognac, and RTDs.

This is because Millennialsthere it is, the big reveal—appear to be “substituters.” That is, as explained by the IWSR, much of this cohort consumes alcohol on some occasions, and non-alc beverages on others.

Now, before we proceed, let me get this out of the way: No generation is a monolith. While there’s value in understanding a given generation’s behavior, it’s important to understand that we can really only do so in broad terms.

That said, broadly speaking, members of the Millennial generation appear to be driving the growth of non-alc overall. In comparison to other generations, Millennials are consuming more non-alc spirits, more non-alc beer, and more non-alc wine.

Of course, there’s another caveat I must address: Less than half of Gen Z is of legal drinking age. So, when compared to that generation, the numbers are a bit skewed.

Generally speaking, non-alc is growing across the board in the US. What was once relegated to two or three low-alc beers and barely considered “mocktails” for many, many years is now a viable category. The category has gone from an afterthought to inspiring entire alcohol-free bar concepts, and it hasn’t taken long to achieve this growth.

Numbers

When I say Millennials are consuming more non-alc than other generations, what does that mean? Is the difference subtle, or is it eyebrow raising?

Per IWSR data, it’s the latter.

Last year, 45 percent of all non-alc beer drinkers in the US were Millennials. That number has jumped to 61 percent in 2024. Change focus to non-alc spirits and Millennials make up 66 percent of overall US consumers. That number is 59 percent when we look at who’s drinking non-alc wine.

For some context, just 22 percent of non-alc beer drinkers in the US are Gen X. Take a look at legal-drinking-age Gen Z and that number shrinks to seven percent. Again, though, most of Gen Z isn’t yet LDA.

So, back to substituters. Just under half of all Millennials, according to IWSR findings, vacillate between non-alc and full-ABV. It would appear, then, that Millennials are the most interested in exploring and experimenting with non-alc beverages.

For obvious reasons, this makes it clear that operators need to do more than just toss a couple of alcohol-free beers and sugary zero-proof cocktail concoctions on their menus.

Further, and I know I’m repeating myself, operators need to ensure they deliver the same level of service and guest experience for those abstaining from alcohol as those ordering traditional adult beverages. Failing to do so can alienate guests who choose to not consume alcohol but want to visit and socialize at a bar or restaurant. Why would they return if they receive what they perceive to be a lower level of service?

IWSR’s deep dive and data make it clear that operators need to give the non-alc element of their menu due consideration. The category is growing, interesting is increasing, and it’s smart business.

To review this data yourself, follow this link.

Image: Rachel Claire via Pexels

KRG Hospitality Contact 60-Minute Impact Session

Looking to Start, Stabilize, or Scale? Book Below to Setup a 60-Minute Result-Driven Impact Session.


by David Klemt David Klemt No Comments

2024 Datassential 500: Guest Perception

2024 Datassential 500: Guest Perception

by David Klemt

An optical illusion consisting of black and white stripes that may be curving upward and outward

Last week we took a look at the data-driven findings that identify, organize, and rank chain restaurants in the US, forming the Datassential 500.

This annual report sorts the 500 top-performing chains by segment. Further, Datassential identifies the top chains by both number of units, and sales.

In doing so, the F&B intelligence agency uses hard numbers to determine numbers one through 500.

But what about guest perception? Unit and sales growth may appeal to board members, investors, executives, and other hospitality professionals, but what matters to the people their restaurants serve?

It’s doubtful that even the staunchest fans of a particular restaurant chain are aware of or, frankly, care about how many locations they operate. Nor are they likely all that concerned about their annual revenue, unless they’re an investor as well.

To get to the bottom of how the public perceives chain restaurants in the US, and what brands they rank at the top, Datassential looked at six key metrics.

Those metrics? Food quality, service, experience, affordability, value for dollar, and net promoter score.

While the results aren’t exactly shocking, they’re quite telling. A handful of US chains dominate the consumer-facing metrics. And for the most part, they’re not among the top ten of the 2024 Datassential 500.

Anyone interested in reading this year’s report can do so via this link. Alright, let’s check out how the public ranks US chain restaurants.

Perception Matters

To make the comparisons easier, the top 10 US restaurant chains by unit and by sales are below.

Top 10: Total Units

  1. Subway
  2. Starbucks
  3. McDonald’s
  4. Dunkin’
  5. Taco Bell
  6. Domino’s Pizza
  7. Burger King
  8. Pizza Hut
  9. Wendy’s
  10. Dairy Queen

Top 10: Total Sales

  1. McDonald’s
  2. Starbucks
  3. Chick-fil-A
  4. Taco Bell
  5. Wendy’s
  6. Dunkin’
  7. Burger King
  8. Chipotle
  9. Subway
  10. Domino’s Pizza

Guest Perception

Okay, so those are the top performers in the US, by the numbers. Units were counted, sales were analyzed.

Now, these are the brands that guests feel are at the very top, organized into six categories.

Food Quality

  1. Texas Roadhouse
  2. Chick-fil-A
  3. Longhorn Steakhouse
  4. Cheesecake Factory
  5. Ruth’s Chris Steak House

Service

  1. Chick-fil-A
  2. Texas Roadhouse
  3. Longhorn Steakhouse
  4. Cheesecake Factory
  5. In-N-Out Burger

Experience

  1. Chick-fil-A
  2. Ruth’s Chris Steak House
  3. Texas Roadhouse
  4. Maggiano’s Little Italy
  5. In-N-Out Burger

Affordability

  1. Little Caesars
  2. Freshii
  3. Papa Murphy’s
  4. Cici’s Pizza
  5. Pollo Tropical

Value for Dollar

  1. Papa Murphy’s
  2. Little Caesars
  3. Cici’s Pizza
  4. In-N-Out Burger
  5. Del Taco

Net Promoter Score

To determine this ranking, survey participants were asked “How likely would you be to recommend this chain to friends and family?”

  1. Chick-fil-A
  2. Texas Roadhouse
  3. In-N-Out Burger
  4. Longhorn Steakhouse
  5. Portillo’s Hot Dogs
  6. Cheesecake Factory
  7. The Capital Grille
  8. Ruth’s Chris Steak House
  9. Maggiano’s Little Italy
  10. Topgolf

Subway and McDonald’s may dominate the list in terms of number of units and annual sales, but Chick-fil-A dominates in one key area. Word-of-mouth marketing still matters, undeniably, and, according to Datassential, most consumers perceive Chick-fil-A as the restaurant chain to recommend.

Followed by Texas Roadhouse and In-N-Out Burger, smaller brands are delivering on important operational elements. Consumers at large appear to favor these brands when it comes to stretching their dollars, along with how they perceive the quality of food, the level of service, and the overall dining experience.

Operators interested in scaling their business need to set aside ego and desire, and look at their business objectively. They need to ensure they’re nailing the fundamentals and have the right systems in place first.

Image: BP Miller on Unsplash

KRG Hospitality Contact Request for Proposal 30 Minute Discovery Session

Book Below to Setup a 30-Minute Complimentary Discovery Call and Request for Proposal.


by David Klemt David Klemt No Comments

The 2024 Datassential 500

How Does the 2024 Datassential 500 Shake Out?

by David Klemt

Stainless steel address numbers spelling out the number 500

The annual Datassential 500 ranking is a valuable report that identifies industry leaders, the fastest growers, and segment performance.

Further, this yearly report shows the scale of restaurant business in the US. In a word, it’s gargantuan.

Looking at 2023 data, the top 500 chains in the US operated 238,152 units. And those 238,000-plus restaurants generated $417.13 billion in 2023.

For the former, that’s growth of 2.1 percent in comparison to 2022. And for the latter, the top 500 grew by 7.5 percent compared to last year.

Those numbers are from just 500 chains; the report doesn’t take into account other chains or independent operators. When we add all dining and drinking establishments in the US, the industry generated $1.09 trillion in 2023.

Again, the US restaurant business is a colossus.

Perhaps unsurprisingly, limited-service and quick-service restaurants are the top-performing segments by unit within the Datassential 500. In 2023, the LSR segment consisted of 212,469, and unit growth was up by 2.3 percent. The QSR segment reached 170,241, representing unit growth of 1.9 percent.

In fact, every segment but one saw unit growth in 2023. One may assume the segment that slipped was fine dining. That’s usually a safe bet, but the segment actually saw the most growth. It was midscale restaurants that suffered a bit of a blow, shrinking by 0.1 percent.

That means that LSRs, QSRs, full-service restaurants (FSRs), fast casual, casual dining, and fine dining all grew. Further, that growth ranged from 0.3 percent (FSR) to 4.6 percent (fine dining).

There are many more insights, so I encourage anyone interested to download the report for themselves.

Segment Shakedown

Before we jump into the top US chains, let’s take a look at how the categories break down.

Type of Cuisine

  • American: 88
  • Pizza: 70
  • Desserts & Snacks: 69
  • Sandwich: 47
  • Coffee: 47
  • Burger: 37
  • Mexican: 36
  • Salad & Healthy: 31
  • Southern: 24
  • Asian: 22
  • BBQ: 12
  • Steakhouse: 11
  • Italian: 9
  • Seafood: 9
  • Greek & Mediterranean: 9

Growth by Segment: Unit (LSR)

  • Salad/Healthy: +11.2%
  • Coffee: +5.9%
  • Other: +4.6%
  • Dessert/Snack: +4.3%
  • Mexican: +3.0%
  • Chicken: +2.9%
  • Pizza: +1.6%
  • Bakery-Cafe: +0.8%
  • Sandwich: -0.4%
  • Burger: -0.4%

As we can see, Salad/Healthy LSRs saw almost double the growth by unit than the next-largest segment, Coffee.

Further, Sandwich and Burger shrunk slightly.

Growth by Segment: Unit (FSR)

  • Regional/Ethnic: +7.6%
  • Sports Bar: +3.8%
  • Midscale: +0.3%
  • Seafood/Steak: +0.1%
  • Italian/Pizza: -0.9%
  • American: -2.0%

Regional and ethnic full-size restaurants saw the most growth. In fact, they grew by twice the amount of sports bars, and several times more than midscale FSRs.

Growth by Segment: Sales

  • Limited-Service Restaurant: $338.18 billion (+8.1%)
  • Quick-Service Restaurant: $263.48 billion (+8.0%)
  • Full-Service Restaurant: $78.95 billion (+5.0%)
  • Fast-Casual Restaurant: $74.70 billion (+8.6%)
  • Casual-Dining Restaurant: $55.57 billion (+4.8%)
  • Midscale Restaurant: $20.05 billion (+4.5%)
  • Fine-Dining Restaurant: $3.33 billion (+10.7%)

The good news is that every segment saw sales growth in 2022, with Fine Dining and Fast Casual experiencing the biggest increases.

Of course, that’s relative. Fine Dining generated just $3.33 billion in comparison to LSRs, which generated more than $338 billion.

Still, positive growth is always great to see.

Growth by Segment: Sales (LSR)

  • Salad/Healthy: +17.0%
  • Chicken: +11.9%
  • Dessert/Snack: +10.1%
  • Coffee: +9.8%
  • Other: +9.3%
  • Mexican: +9.1%
  • Burger: +7.5%
  • Sandwich: +7.2%
  • Bakery-Cafe: +1.8%
  • Pizza: +1.6%

Not only did Salad/Healthy lead the way in LSR unit growth in 2023, it’s the top performer in terms of sales.

Again, the good news is that the Datassential 500 saw LSR sales growth across the board.

Growth by Segment: Sales (FSR)

  • Regional/Ethnic: +10.2%
  • Seafood/Steak: +6.7%
  • Midscale: +5.2%
  • Italian/Pizza: +4.2%
  • American: +3.8%
  • Sports Bar: +3.2%

As far as FSR performance, every segment experienced growth, with Regional/Ethnic leading the charge.

The Top 5(00)

So, which US chains are at the top? Well, an accurate answer depends on segment, number of units, and sales.

Oh, and it also depends on whether we’re talking about which chains Datassential have identified as industry leaders, and which are the fastest growers.

Industry Leaders

According to Datassential, the top five US chains by number of stores are Subway (20,133), Starbucks (16,346), McDonald’s (13,449), Dunkin’ (9,580), and Taco Bell (7,405).

However, that ranking changes a bit when we look at through the lens of sales. In that case, the top five are McDonald’s ($52.91 billion), Starbucks ($29.98 billion), Chick-fil-A ($21.58 billion), Taco Bell ($13.95 billion), and Wendy’s ($12.29 billion).

Those are the industry stalwarts. How do the fastest-growing US chains stack up?

Fastest Growers

Looking at unit growth over the span of one year, the top performers in the US are 7 Brew (+373.7 percent), The Peach Cobbler Factory (+358.3 percent), Hangry Joe’s Hot Chicken (+281.8 percent), KPOT Korean BBQ & Hot Pot (+275.0 percent), and Foxtail Coffee Co (+176.2 percent).

Switching gears to sales growth over a single year, Hangry Joe’s Hot Chicken led the way, growing by more than 500 percent. Hangry Joe’s is followed by The Peach Cobbler Factory (+332.5% percent), Nick The Greek (+304.7 percent), 7 Brew (+267.3 percent), and Pizza King Inc (+264.7 percent).

However, Datassential gets more granular in their 2024 report, breaking down the top five across multiple segments.

Top Ranked By Unit (Overall)

Top 5: Quick Service

  1. Subway
  2. McDonald’s
  3. Dunkin’
  4. Taco Bell
  5. Domino’s Pizza

Top 5: Fast Casual

  1. Starbucks
  2. Chipotle
  3. Panera Bread
  4. Wingstop
  5. Tropical Smoothie Cafe

Top 5: Midscale

  1. Waffle House
  2. IHOP
  3. Denny’s
  4. Cracker Barrel
  5. First Watch

Top 5: Casual & Fine Dining

  1. Applebee’s
  2. Buffalo Wild Wings
  3. Chili’s
  4. Olive Garden
  5. Outback

Top Ranked By Unit (Growth)

Top 5: Quick Service

  1. 7 Brew
  2. The Peach Cobbler Factory
  3. Foxtail Coffee Co
  4. Cupbop
  5. Swig

Top 5: Fast Casual

  1. Hangry Joes Hot Chicken
  2. Just Love Coffee Cafe
  3. The Great Greek Mediterranean Grill
  4. Nautical Bowls
  5. Ellianos Coffee Co

Top 5: Midscale

  1. Snooze Restaurant
  2. Eggs Up Grill
  3. Kura Sushi Bar
  4. Another Broken Egg Cafe
  5. Maple Street Biscuit Co.

Top 5: Casual & Fine Dining

  1. KPOT Korean BBQ & Hot Pot
  2. Topgolf
  3. The Juicy Crab
  4. Jinya Ramen Bar
  5. Hopdoddy Burger Bar

There are many more insights to be had, so please consider downloading your own copy of the 2024 Datassential 500 report here.

Image: Thiago Giardini via Pexels

KRG Hospitality Contact 60-Minute Impact Session

Looking to Start, Stabilize, or Scale? Book Below to Setup a 60-Minute Result-Driven Impact Session.


by David Klemt David Klemt No Comments

Is Demand for Delivery Down?

Is Demand for Delivery Down?

by David Klemt

AI-generated image of a person carrying takeout bags from restaurant to their motorcycle

I have done this. Cargo straps required.

Not too long ago, it seemed as delivery was going to overtake people’s desire to enjoy a restaurant in person, but that trend may be on a downward swing.

At first, this trend made perfect sense, for obvious reasons. For a while, the best way for consumers to enjoy their favorite restaurants and show support was to order delivery.

Rideshare companies jumped on delivery, as did several platforms. When guests were able to visit restaurants in person freely, delivery had become a habit for many of them. In fact, ordering delivery had become the de facto method of engaging with restaurants for a not-insignificant percentage of people.

However, operators and their teams weren’t shy about exposing their delivery “partners.” I think it’s fair to describe the fees operators were being charged by some of these partners as outrageous.

When the public found out about these fees, they didn’t sit well. Takeout, carryout, takeaway, order for pickup… Whatever your preferred nomenclature, people began seeing it as superior to delivery. This shift in consumer behavior was driven by a desire to support their favorite restaurants.

Of course, there are other factors that affected people’s move away from delivery. I’m confident in saying that most of us who have ordered delivery at some point in the last couple of years has experienced at least one of several downsides.

However, has delivery really fallen out of favor? Have takeout or drive-up pickup actually been passing up delivery?

Datassential’s 2024 Midyear Trends Report has some insights that can answer those questions. You can (and should) check it out for yourself here.

The State of Takeout and Delivery

To obtain a snapshot of the state of the performance of delivery and takeout, Datassential conducted a survey in May of this year. The F&B intelligence platform surveyed 400 US operators and more than 1,500 US consumers.

According to Datassential, nearly half of restaurant operators reported increases in guests dining in person at their restaurants.

Perhaps more telling, however, is that Datassential’s survey reveals that half of restaurants aren’t even offering delivery. I don’t know the breakdown of operators who once offered delivery and stopped doing so versus operators who never offered delivery.

What I do know is that there are, as I alluded to up top, many reasons for people to eschew delivery. Chief among these are cost, and the condition of the order when it arrives to the guest.

On the operator side, cost is once again a consideration, as are negative reviews and complaints. More than one study has shown that operators often get the blame when a third party botches an element of the delivery. These complaints can include food being delivered lukewarm or cold, parts of the delivery missing, or the wrong items being delivered to someone.

But, again, is demand for delivery slipping?

Per Datassential’s report, takeout and catering are outpacing the growth of delivery for US operators. Almost 40 percent of operators who participated in Datassential’s survey reported an increase in frequency for takeout and catering orders. In comparison, just 20 percent of respondents ordered an increase in delivery order.

Just eight percent of operators indicated a decrease in takeout and delivery. In fact, the greatest decrease impacts catering (14 percent), according to Datassential’s report.

Takeaway

Delivery, simply put, doesn’t work for every operator or every concept. Moreover, it looks like consumer desire for takeout is on a greater upswing in contrast to delivery.

For concepts that succeed with delivery, it’s imperative that operators control the process rather than cede to third parties, in my opinion.

The best way forward will vary from business to business. Operators and their teams need to be ruthless the quality, consistency, accuracy, and value of all orders, whether placed in person, for takeout, or for delivery. Further, when it comes to takeout and delivery, the ordering process must be convenient.

What’s clear is that every operator needs to dive into their data, determine how guests prefer to order from their restaurant, and pursue those preferences to enhance the guest experience.

Image: Microsoft Designer

KRG Hospitality Contact Request for Proposal 30 Minute Discovery Session

Book Below to Setup a 30-Minute Complimentary Discovery Call and Request for Proposal.


by David Klemt David Klemt No Comments

Game On: Datassential’s Midyear Report

Game On: Datassential’s Midyear Trends Report

by David Klemt

An Xbox One controller sitting on a Scorpion Gaming mouse pad

Brought to you by Xbox, Scorpion Gaming, and cool photography.

The 2024 Midyear Trends Report released by Datassential earlier this month contains an intriguing revelation that savvy operators can leverage.

There is, of course, interesting and useful information throughout. After all, Datassential conducted a survey of 1,500-plus US consumers, along with 400 US foodservice operators.

Surveying nearly 2,000 people is going to garner some helpful insights.

For example, we know that many people are concerned with their nutrition. Along with that comes reading nutrition labels. However, US consumers appear to throw that behavior to the wayside when dining out.

According to Datassential’s survey results, 62 percent of consumers in the US read the nutrition labels on new items before selecting them for purchase at grocery stores. But nearly that same percentage of consumers, 58 percent, don’t consider diets or nutrition when choosing where they’re going to eat.

What that says to me is that people still viewing dining out as a treat or an occasion. Most people, when treating themselves and others, see it as an escape. An escape from the stresses of work, of life, and from eating “boring” foods.

People are still driven to leave home to gather, socialize, and have fun. And restaurants and bars still play a major role in meeting those needs and desires.

Negative and fear-mongering stories may be getting all the clicks, but Datassential’s findings are much less on the doom-and-gloom side of the equation. Per their midyear report, nearly 90 percent of US restaurant operators have seen increases in traffic (46 percent) or had their traffic remain the same (42 percent) so far this year. Just 12 percent of operators reported decreases in traffic, according to Datassential.

Game On

Now, let’s look at the data in this report that really caught my attention.

The Datassential report reveals that 61 percent of survey respondents play video games. Citing Entertainment Software Association data, close to 200 million Americans are gamers. Going further, gaming spans all ages. Last year, gamers spent well over $50 billion on this particular hobby. MarketWatch claims even combined, the global sports and movie industries don’t outperform video games financially.

Of all respondents to the Datassential survey, a quarter aren’t gamers, and 15 percent “used to” play video games. That latter group consists mainly of Gen Xers. And, hey, fair enoughsome people don’t enjoy or have time for video games.

In contrast, however, 23 percent of survey respondents label themselves “avid gamers.” Gen Z, Millennials, and men make up the majority of this group of consumers.

Almost 40 percent (38%) classify themselves as “casual.” This group consists mainly of Gen X, Gen Z, and women.

Alright, so…what does this have to do with restaurant operators? Well, gamers spent $57 billion just on video games. Per Datassential, 45 percent of survey respondents have made F&B purchases after consuming video game-related ads or content. This is true of 63 percent of US Gen Z consumers, and 56 percent of US Millennials.

These stats tell me that gaming pays not just for console manufacturers and game producers, but also for F&B operators. It would seem to me, then, that operators with concepts that can leverage video games in an authentic manner should give strong consideration to doing so.

So, game on?

Image: Jose Gil on Unsplash

KRG Hospitality Start-Up Restaurant Bar Hotel Consulting Consultant Solutions Plans Services

by David Klemt David Klemt No Comments

Soup Season: Transforming Comfort Classics

Soup Season: Transforming Comfort Classics

by David Klemt

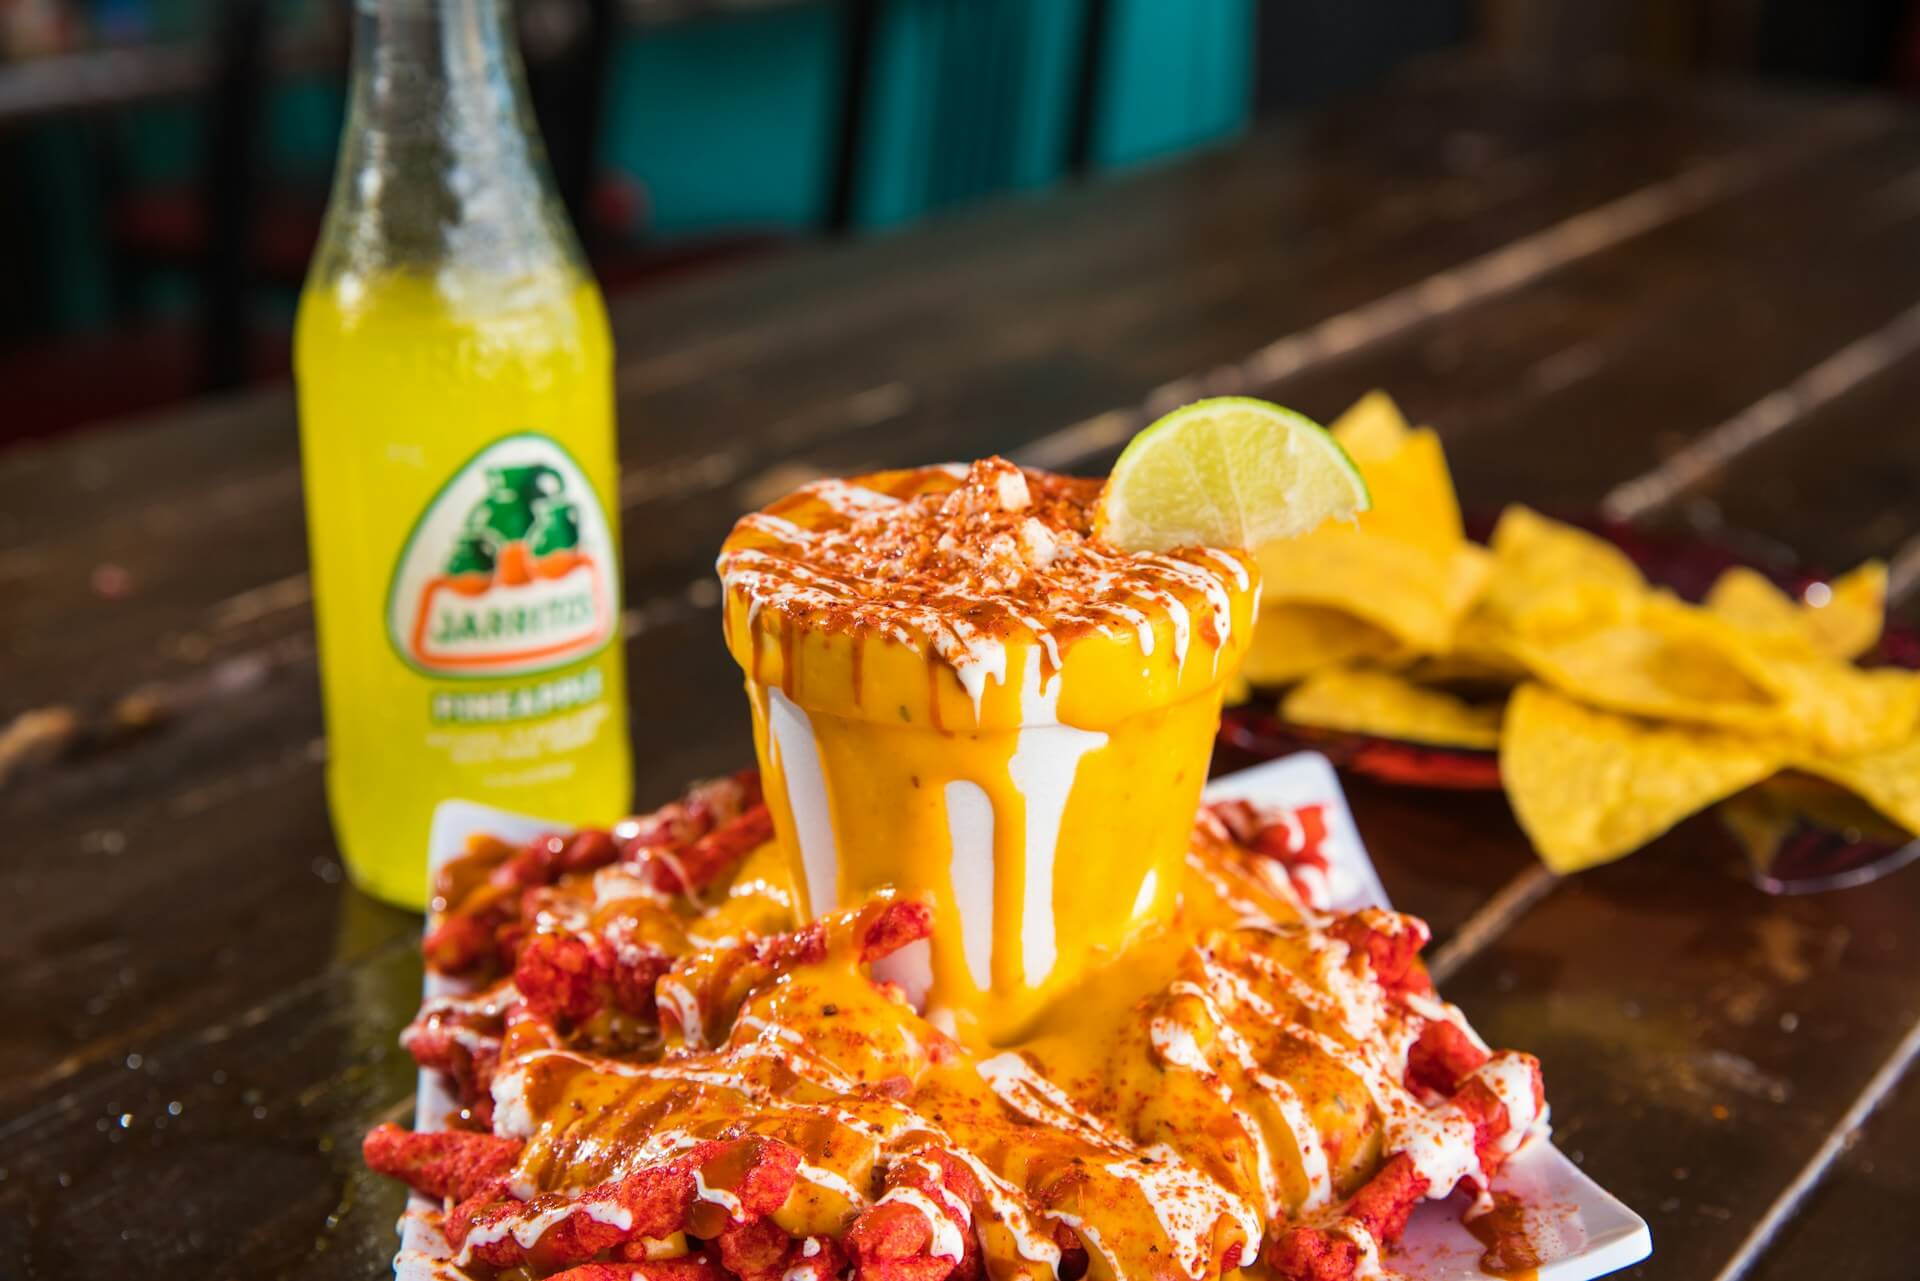
Elote en vaso, or vaso de elote, also known as street corn in a cup, on a bar

Elote en vaso or vaso de elote, also known as “street corn in a cup.”

The latest and greatest from Campbell’s Foodservice is all about operators making the most of cooler weather by maximizing soup season.

If you read KRG Hospitality articles regularly, you’re likely aware that we like the helpful information Campbell’s makes available. For example, I’ve written articles that share their tips for leveraging nostalgia, crushing it with LTOs, and 2024 culinary trends.

Their newest tips aim to help operators succeed with soup. Further, much of Campbell’s Foodservice’s tips are in direct response to Datassential and Technomic data. In fact, Campbell’s references Technomic’s Soup & Salad Consumer Trend Report directly.

To be sure, the first bit of advice that Campbell’s shares is the most obvious: Leverage seasonal flavors. In this case, we’re talking fall and winter flavors.

You may already see stores where you live and operate unleashing Halloween decorations. I know I have; it may be 105 degrees in Las Vegas as I write this, but people are getting into an autumnal mood.

Of course, when you take advantage of seasonality for LTOs or menu updates, it’s important to let your guests know.

“Calling out seasonal items on your menu demonstrates the operator is being relevant and using ingredients that are in season,” says Campbell’s Foodservice Executive Chef Gerald Drummond. “From a consumer standpoint, that’s something that they really look towards.”

We agree wholeheartedly. Going deeper, we recommend working with local suppliers to procure seasonal ingredients, and calling that out as well.

Another tip comes from Datassential and Technomic insights. Three in ten younger consumers would like to see soups that feature plant-based proteins. And around half want at least one vegetarian-friendly soup on a menu.

The Standout Tip

When you’re through reading this article, I encourage you to scroll back to the top, click the “soup season” link, and read this Campbell’s Foodservice report for yourself.

That way, you’ll see all of their latest tips for getting the most out of seasonal soups.

However, I’m going to share the tip that stood out the most to me: transforming comfort food dishes into soups. Hence, the image at the top of this article: vaso de elote, or elote en vaso. That dish translates to “street corn in a cup” from Spanish.

Now, elote or street corn is undeniably a comforting street food. If I see it on a menu, I’m going to order it. Were I to see street corn in a cup, particularly if it came with the presentation at the top of this article, I’m going to order it.

So, if a culinary team were to transform street corn in a cup into street corn in a cup of soup, I’m all in.

Think about your concept, the approach to cuisine, and the community you serve. Then, think about the comfort dishes that work well with your concept and resonate with your guests.

In their report, Campbell’s Foodservice recommends beer cheese soup, of which I’m a fan. They also suggest lasagna soup (I’d try it), and chicken pot pie soup (again, I’m down).

Real-Word, Professional Advice

I asked our chef consultant Nathen Dubé for a couple of quick tips for transforming a comforting food dish into a soup. (By the way, you can book a call with him to discuss your menu or kitchen here.)

“I would look at the overall profile of the dish, and then decide if you’re going to combine everything into a puree or a broth,” says Nathen.

Then, the kitchen team needs to decide “which ingredients would be incorporated, and which could be left whole afterwards for texture, and stronger stand-out flavours.” As he explained to me, some ingredients definitely translate better to slow cooking versus finishing towards the end of the process.

With that advice given, take a look at your menu. Do you have some comfort foods that would be intriguing to guests in soup form? What about some of your signature dishes?

Once you’ve determined which dishes to transform into seasonal, LTO soups, engage your kitchen team. They’ll likely be excited to do something new, and show off their culinary talent.

Some people may harbor the misconception that soup isn’t exciting. I think creative operators and culinary teams can disabuse skeptical guests of this notion. Cheers!

Image: Jarritos Mexican Soda on Unsplash

KRG Hospitality. Restaurant Business Plan. Feasibility Study. Concept. Branding. Consultant. Start-Up.

by David Klemt David Klemt No Comments

Eliminate Hesitation: Streamline Your Menu

Eliminate Hesitation: Streamline Your Menu

by David Klemt

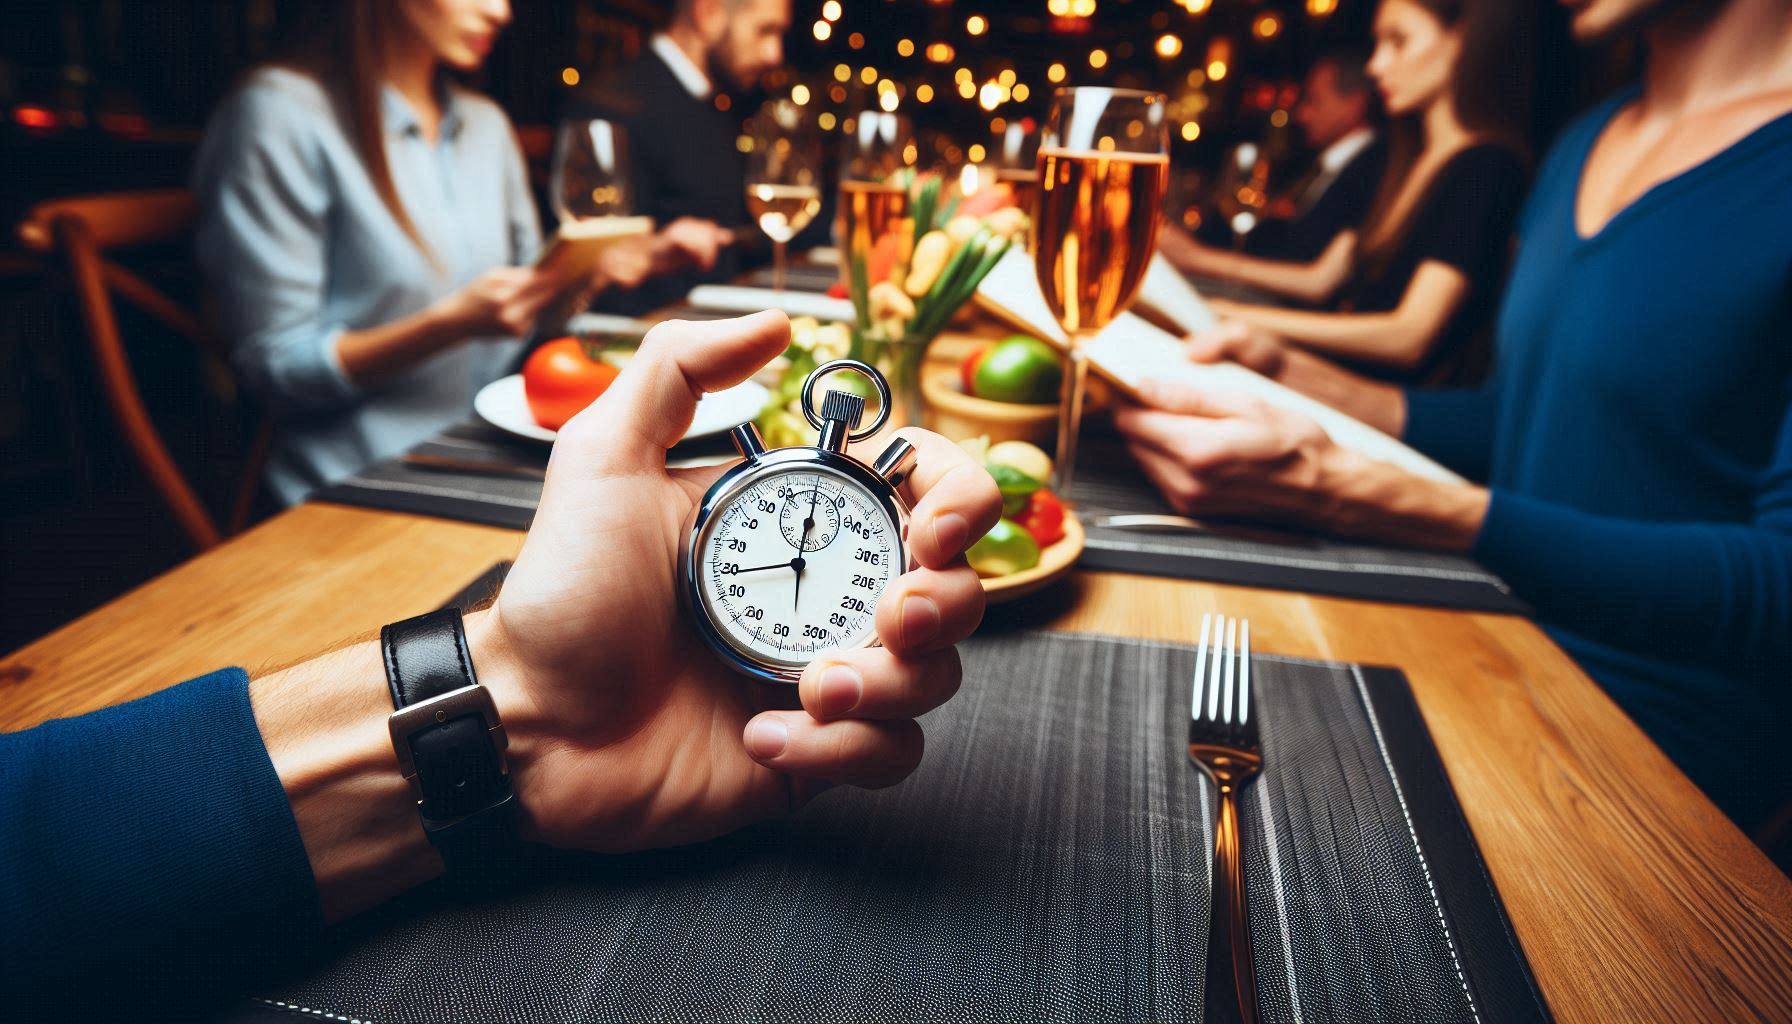
An AI-generated image of a person holding a stopwatch at a restaurant table while guests read the menu

That’s an interesting stopwatch layout. Also, we don’t recommend sitting with guests and timing them as they review your menu.

Operators should develop an understanding of the concept of the paradox of choice to understand how American guests make menu item selections.

So, allow me a crash course in this psychological concept. There are two prevailing components to the paradox of choice. One is that the more options one has, the less satisfaction they’ll feel upon making a choice. The other is that when presented with an overwhelming number of choices, also known as “choice overload,” people often just fall back to their usual choice rather than trying something new.

A quick note: The paradox of choice isn’t the same as the fallacy of choice. That concept relates to presenting someone with limited, extreme choices to drive them to ignore all of the other choices they could consider and select.

Understanding the paradox of choice will help an operator tackle a key task: streamlining their menus.

A survey from US Foods earlier this year contains quite a few intriguing revelations. Among their findings, one stands head and shoulders above the rest, at least to me: Almost 80 percent of Americans find deciding what they want to order at a restaurant difficult. Further, one factor outpaces all others when it comes to difficulty choosing.

Hence, my explanation of the paradox of choice at the top of this article.

Menus are too Big

There are two key factors making it difficult for Americans to choose what to order at a restaurant. Nearly a quarter of respondents23 percentindicate that they’re simply picky people. Alright, fair enough.

But the main factor, unsurprisingly, is that restaurants are presenting guests with too many options. That’s according to 54 percent of survey respondents. Quick math tells me that’s more than double the picky eaters.

Another 15 percent of US Foods survey respondents, however, say they have no trouble deciding what they want to order. Eight percent say they’re indifferent, which is an entirely different problem. A guest who’s indifferent to the restaurant and menu isn’t an engaged guest, and that’s not going to inspire loyalty and repeat visits.

Of course, no operator can please everyone, and some people aren’t going to be blown away no matter how good the food, drinks, and service can be.

So, does this mean that Americans are indecisive, facing paralysis whenever a servers asks for their order? Well…maybe. We have a lot going on, and “overwhelmed” would describe many of my fellow Americans right now.

However, the real culprit is menu size. In trying to please and retain guests, some operators are loathe to shrink their menus.

Most KRG clients can attest to the following: the president of our agency, Doug Radkey, prefers a smaller, streamlined menu. In fact, he prefers menus not pass the 25-item mark. Given his druthers, Radkey favors 12 to 15 items.

There are several reasons for this preference. Chief among these are controlling and reducing labor and food costs. (Radkey prefers to control costs rather than cut them, realistically.) Other reasons are less strain on the back of house, easier cross-utilization of ingredients, consistency, and reduced ticket times.

We can also add improving guest satisfaction to the list. On average, an American restaurant guest takes nine minutes to decide what they want to order at a restaurant. Streamline and shrink the menu, and this number should fall, while satisfaction rises.

Anyone should see that a smaller, sharper menu represents wins across the board.

AI image generator: Microsoft Designer

KRG Hospitality Start-Up Restaurant Bar Hotel Consulting Consultant Solutions Plans Services

by David Klemt David Klemt No Comments

Text, Email & Social Media Marketing

Text, Email & Social Media Marketing: Which is Best?

by David Klemt

A woman wearing a black-and-white-striped top checking her smartphone

Text-message marketing versus email marketing: which is best for your business?

One of the key topics that SevenRooms addresses in the first of their annual trends report is how operators can make the most of their marketing efforts.

Today, the primary marketing channels are text/SMS, email, and social media. An operator needs to understand their guests to know which will be most effective for their business.

Or, more accurately, an understanding of one’s guests is the key to leveraging a mix of those channels effectively.

An operator must consider their target audiences, and how they tend to engage with brands. Further, consideration must be given to people’s relationships with their phones.

As a real-world example, one of our clients’ guest pools skews significantly toward Baby Boomers. When discussing marketing strategy, the client expressed a concern when text marketing came up. They stated that their older guests would likely push back against this form of marketing.

However, no generation is a monolith. Therefore, I’ll be speaking in generalities when it comes to generational cohorts and their behavior.

Marketing Channel Engagement

Generally speaking, younger generations don’t seem to find text marketing invasive. Younger consumers are also used to engaging with and discovering brands and businesses via social media.

In contrast, an operator may find that their older Gen X and Baby Boomer guests prefer email marketing. It’s important to bear in mind that older generations also consume social media content. For example, SevenRooms findings show that 24 percent of Gen X and Baby Boomers can be influenced to visit a restaurant via F&B posts. However, these generations appear to engage with menu posts from restaurants they already follow.

That last bit of information tells me that older guests follow restaurants they’re considering visiting or have visited previously. Per SevenRooms data, the same goes for Millennials. That said, 43 percent of this generation are influenced by posts that showcase a restaurant’s personality.

Interestingly, just over half of Gen Z is influenced via video content from businesses they don’t already follow. These accounts are pushed to them via a platform’s engagement and discovery algorithms.

With the caveat that I’m painting different generations with broad strokes, posts that show off the menu may work best to engage older consumers. Posts that illustrate the personality of a brand and its team may resonate best with Millennials, and video content is king for grabbing the attention of younger consumers.

Businesses targeting a mix of consumers will want to develop a varied social media strategy. Content should consist of still photos and video that show off menu items, team members, and what guests can expect during a visit. Engagement will show an operator which posts are resonating the most with their followers and guests.

So, which marketing channel is best? All of them, when combined strategically.

An Effective Mix

Speaking of developing an effective strategy, SevenRooms asked operators about their social media marketing results.

Since the point behind marketing is to increase bookings to boost traffic and revenue, SevenRooms looked into which social media content achieved the best results.

Nearly 40 percent of operators surveyed said that organic posts result in the most bookings. This is followed by paid social media advertising, at 33 percent. Just over a quarter of operators surveyed pointed to influencer content as driving the greatest number of bookings.

One percent of operators say they don’t track their social media marketing results. For obvious reasons, this isn’t part of a winning strategy. If the results of an operator’s marketing efforts can’t be tracked, how can they know what works, and if they need to change an element of their strategy (such that it is)?

Nuance

As SevenRooms makes clear in their 2024 Restaurant Trends and Diner Expectations report, a multi-channel marketing strategy is a key to success.

Results will boil down to more than texting younger consumers and emailing older consumers. SevenRooms suggests what we at KRG Hospitality would also recommend: nuance.

An actual strategy is necessary, and that means being intentional with each marketing channel.

For context, an operator is likely best served to keep marketing text messages short. So, think reservation availability due to cancellations or no-shows. Email is a marketing channel best suited to longer messages. When it comes to social media marketing, a restaurant or bar’s social accounts should be viewed as relationship-building avenues.

In closing, an operator’s multi-channel marketing strategy requires a multi-pronged approach. Each channel must be leveraged differently. Text marketing shouldn’t be used the same way as email marketing messages, and neither should be used in the same way as a brand’s social accounts. When it comes to those accounts, a mix of posts is most effective for reaching different types of consumers.

The real keys are for operators to know who they’re targeting, track their marketing efforts, and develop an understanding of their guests. Throwing things against the wall to see what sticks just creates a mess; operators must be intentional in their marketing and operations to convert guests and achieve long-term success.

Image: Andrea Piacquadio via Pexels

Bar Nightclub Pub Brewery Marketing Agency Team

by David Klemt David Klemt No Comments

SevenRooms Drops Extensive 2024 Report

SevenRooms Drops Extensive 2024 Report

by David Klemt

Guests dining in a light, bright restaurant featuring a glass ceiling and hanging plants

Today, we’re taking a look at the first-annual trends report from marketing and operations platform SevenRooms, which focuses on the guest experience.

To gain an understanding of the current state of affairs in America, SevenRooms analyzed the product data of more than 3,000 US clients. Further, the platform engaged over 250 operators, and 1,000 consumers.

The result is a data-rich report that offers helpful insights for operators.

Two findings are particularly interesting to me, and the team here at KRG Hospitality. One, it appears that Americans are back to seeking out their third spots. As a refresher, a third spot, space, or place is where one spends time when away from home or work. Consumers tend to be loyal to these places, making them part of their everyday or weekend routine.

Two, younger consumers are leading the way in terms of restaurant visits. Per SevenRooms, 38 percent of Millennials visit restaurants five or more times per month. Gen Z is also visiting restaurants frequently, with 24 percent visiting five times or more. However, that number climbs to 45 percent for Gen Z when it comes to three or four monthly visits. Among Millennials, 33 percent visit restaurants three or four times per month.

That tells us that younger consumers are eager to socialize, and restaurants can fulfill that desire. As savvy operators know, a person can eat or drink at home; food and beverages are just excuses to get out, hang out, and meet new people.

This also tells us that operators need to ensure they’re ticking several boxes to resonate with younger guests: value, convenience, and personalization. I’ll add that consumers have shown they want to support brands with values that align with their own.

There are many more insights in SevenRooms’ new report, which you can find below. To view the report in its entirety, click here.

SEVENROOMS RELEASES 2024 RESTAURANT TRENDS AND DINER EXPECTATIONS REPORT FOR THE HOSPITALITY INDUSTRY

Annual report gives an inside look at how restaurants are delivering better guest experiences and personalizing their marketing in the age of AI and automation

NEW YORK (August 6, 2024) – SevenRooms, the leading CRM, marketing and operations platform for growing restaurants, today released its first annual trends report, “2024 Restaurant Trends and Diner Expectations, highlighting how restaurants are filling the need for ‘third places’, connection spots outside the home and workplace, what consumers expect from their dining experiences, and how restaurants are leveraging AI and automation to keep diners coming back.

The study, commissioned through independent third-party research firm Censuswide, examines consumer and foodservice operator insights, alongside data from SevenRooms restaurant customers. It emphasizes the importance of restaurants understanding their guests and providing experiences and value to consumers, including marketing and tech trends that operators are paying attention to.

Diners Expect More From Restaurants

While it’s no surprise that diner expectations have evolved in recent years, consumers across generations and cities share key expectations when dining out — they’re looking for convenience, personalization and value from brands they trust. Restaurants must nail all aspects of the guest experience, from hospitality and service to ambiance and atmosphere, to transform diners into brand ambassadors and get them to bring their dollars back more often.

When looking across generations, Millennials are driving a dining resurgence – dining out most frequently with 38% saying they dine out more than 5x a month. They are seeking more from their restaurant visits, and are willing to spend more for elevated experiences, like theatrical elements or high-end items like caviar. For these experiences, Americans are willing to spend up to $63 per person with 45% of Gen Zers open to paying even more. As diners focus on the quality over quantity of their experiences, that means restaurants must do more to keep those diner dollars. Dining upgrades consumers are willing to spend more fall into three categories – experiential, luxurious and personal, including:

  • Experiential (e.g. tableside martini cart; fish presentation or deboning, etc.)
    Dallas – a menu item with some theater (86%)
    Washington DC – a menu item with some theater (71%)
  • Personal (e.g. birthday dessert; welcome drink)
    Chicago – a mocktail or personalized item (55%)
  • Luxurious (e.g. caviar, freshly shaved truffles, seafood tower)
    Los Angeles – high-end items like caviar (55%)
    New York – high-end items like caviar (48%)

Outside of these experiential offerings, restaurants must also capitalize on influential factors that bring diners back. For example, 34% of Gen Zers want personalized surprises in service like a free dessert. Meanwhile, 26% of Millennials care about the ease of making a reservation and 24% of Gen Xers consider the rapport they develop with front-of-house staff. Tailoring guest experience and service helps operators turn one-time diners into loyal customers.

“New consumer demands are pushing restaurants to find the right balance between hospitality and automation to create the experiences guests crave and return for,” said Joel Montaniel, CEO & Co-Founder at SevenRooms. “Diners want both access and recognition when spending their hard-earned dollars, and restaurants must embrace new strategies – and technologies like AI and automation – to enhance hospitality at every touch point. Whether leveraging platform data to personalize diner experiences or power marketing and retention programs, technology and data serve as a vehicle to execute hospitality that guests remember and return for. When technology is used effectively, it allows operators to focus on building deeper connections and delighting guests, one experience at a time.”

Loyalty is Never One-Size-Fits-All

In the U.S., there was a 21% year-over-year increase in reservations comparing Q1 2023 to Q1 2024 and restaurants are looking to a promising future. Whether operators are focused on opening new locations or revamping their social media marketing efforts, one factor remains the same – establishing personal relationships with diners is the strongest way to build and maintain loyal customers.

Consumers have a strong intent to dine with their favorite brands. If a guest can’t get a reservation at their preferred restaurant, 39% of guests look for a sister restaurant to dine at, and 27% check other sites for the same restaurant.

Cultivating loyalty is critical. Loyalty is not a one-size-fits-all effort and diners have different interests when it comes to the benefits they seek out from loyalty programs. Restaurants need to understand their diner demographics to curate operations and offerings, getting their guests to not only return more often but spend more in the process.

38% of diners who would spend $89-$126 on an average night are looking for exclusive VIP events, while 33% of consumers who dine out 7-8 times per month want VIP access to specialty seating areas. Breaking down generational differences:

  • 72% of Gen Zers care most about free menu items
  • 30% of Millennials care most about VIP access to specialty dining areas
  • 1 in 5 Gen Xers and Baby Boomers want early access to reservations

Genuine, Tailored Marketing is Critical to Success

When it comes to marketing, authenticity and personalization reign supreme for consumers. Guests want to be known by their favorite restaurants, and restaurants want to know and understand their guests. To reach these consumers, and serve up personalized marketing that makes guests want to return, restaurants have to use all the tools in their arsenal – from social media to email and text marketing automation – to create high-touch communications that are both authentic and personal.

79% of restaurant operators spend the majority of their marketing budget on social media. Their top social media goals are to drive bookings or online orders (39%), increase brand awareness (29%) and communicate with their audiences (29%). But not all content is created equal – 39% of operators say that organic posts drive the most bookings to their restaurants. Restaurants that showcase their personality – highlighting their team, food and drinks and atmosphere – will win with consumers as they look for more genuine content from brands.

Most diners like hearing about restaurant promotions and offers via email and text, and aren’t as interested in social media DMs or phone calls, but specific preferences vary by generation. 41% of Gen Zers prefer text marketing, whereas 38% of Millennials and 37% of Gen X prefer email marketing.

With targeted Email Marketing, the data report notes that operators see 23% higher open rates and 28% higher click-to-open rates, generating 2x more revenue per email. Text marketing is fairly new for restaurants, but has huge potential, with an average open rate of 98% and $1.64 average reservation revenue generated per text message on SevenRooms. For one SevenRooms customer, Fabio Viviani Hospitality, it drove $220,000 in revenue and 3,000 new guests in just 4 months.

“The biggest thing that excites me about text messaging is that it’s very hard to ignore. When our phones beep, we are just driven to look at them,” said Harry Kaminski, CMO at Fabio Viviani Hospitality. “It’s easier to ignore an email than it is a text.”

Artificial Intelligence (AI) Comes into Play

Every industry today is using AI and automation in some way to streamline their operations and help staff work more efficiently – and the same is true for the restaurant industry. 70% of operators surveyed said they use artificial intelligence in some way to run their business, including:

  • 35% – Processing reservations
  • 34% – Inventory management
  • 33% – Data analytics
  • 27% – Scheduling
  • 26% – Dynamic pricing

But there is room to grow with AI, with only 16% saying they use it to create marketing collateral and 15% for staff hiring and training. With personalized marketing a large focus for operators in 2024 and beyond, as well as hiring and retaining staff to deliver on high-touch hospitality, operators have an opportunity to use AI more effectively.

“AI elevates our storytelling around data,” said Kelly MacPherson, Chief Supply Chain and Technology Officer at Union Square Hospitality Group. “We have a wealth of data at our fingertips, but this can create analysis paralysis. With AI, we can more efficiently synthesize the data, create stories about what’s happening, why it’s happening, and what we can do about it, and then present these stories to our teams in a digestible format with actionable next steps.”

For more information about SevenRooms and to download the full report, please visit here.

About SevenRooms

SevenRooms is a CRM, marketing and operations platform for growing restaurants in the hospitality industry. From Michelin star gems to local favorites, the all-in-one platform helps restaurants increase sales, delight guests, and keep them coming back, automatically. The full suite of products includes reservations, waitlist and table management, review aggregation, referrals, email marketing, and marketing automation. Founded in 2011 and venture-backed by Amazon, Comcast Ventures and PSG, SevenRooms has more than 10,000 dining, hotel F&B, nightlife and entertainment clients globally, including: Marriott International, MGM Resorts International, Mandarin Oriental Hotel Group, Wynn Resorts, Jumeirah Group, Hard Rock Hotels & Resorts, Wolfgang Puck, Michael Mina, Bloomin’ Brands, Union Square Hospitality Group, Australian Venue Co., Maple & Ash, The Wolseley Hospitality Group, Dishoom, Groot Hospitality, MLSE, Live Nation and Topgolf.

Research Methodology

SevenRooms partnered with Censuswide Research – a third-party, professional research and consulting organization. Total sample size was 1,004 U.S. consumers. Fieldwork was undertaken between March 4-11, 2024. The survey was carried out online. The figures have been weighted and are representative of all U.S. adults (aged 16+).

SevenRooms partnered with Censuswide Research – a third-party, professional research and consulting organization. Total sample size was 251 U.S. operators (hospitality decision-makers). Fieldwork was undertaken between March 4-19, 2024. The survey was carried out online. The figures have been weighted and are representative of U.S. hospitality operators.

SevenRooms provided anonymized internal data representative of U.S.-based restaurants using the SevenRooms platform and surveyed a sample of operators at various restaurant sizes and types across the U.S. from March-May 2024.

Image: kayleigh harrington on Unsplash

KRG Hospitality Contact Request for Proposal 30 Minute Discovery Session

by David Klemt David Klemt No Comments

Campbell’s Shares Tips for LTOs

Campbell’s Shares Tips for LTOs that Generate ROI

by David Klemt

A well-crafted chicken sandwich with pickles, lettuce, and sauce, served next to a basket of French fries

Yes, the Chicken Sandwich Wars are still going strong in 2024.

We appreciate Campbell’s Foodservice’s reports and posts, and their most recent insights address how operators can succeed with LTOs.

For example, our look into their tips for leveraging nostalgia is here. And our thoughts on Campbell’s Culinary TrendPulse 2024 report are here for your review.

This time out, Campbell’s Foodservice, utilizing data from Technomic, Datassential, and other sources, is tackling LTOs.

If you’re a regular reader of KRG Hospitality’s industry insights, you know we love an LTOif an operator executes it effectively. Along those lines, you probably also know that we view Taco Bell as a leader in the industry when it comes to leveraging the power of LTOs.

Not only does the QSR giant know what their guests want, they know how to generate demand. In fact, Taco Bell understands the power not just of LTOs but of tying them to their subscriptions. Take, for example, their Taco Lover’s Pass and the Toasted Breakfast Taco menu drop.

When approached with thoughtful consideration, well-executed LTOs are a crucial element of an operator’s marketing and branding strategy. They drive traffic and sales, boost guest engagement and loyalty, and attract attention from first-time guests.

Of course, crafting a gainful LTO—gaining profits, loyalty, and positive public perception—can be easier said than done. However, there are a number of steps you can take to get the ball rolling and come up with one that reflects your brand, and resonates with guests.

Four Steps

Kicking off their tips, Campbell’s Foodservice recommends keeping LTOs simple. As they say in their report, which you can read here, operators need not “reinvent the wheel” when developing these promotions.

You can differentiate an LTO menu item from its standard counterpart in a number of simple ways. A few examples are using a unique cooking process, crafting a limited-edition sauce, and featuring a distinctive and specific topping or two.

Another tip is to do your best to offer LTOs that embrace current trends. While sharing these tips, Campbell’s cites Datassential and the revelation that just 20 percent of all LTOs are recurring. That means that the vast majority of LTOs are new creations, not stalwarts like the McRib. To draw the attention of a wider swath of guests, feature regional and local items and flavors. Per Datassential, 70 percent of guests are interested in such LTOs.

Speaking of attention, operators should learn how to take and edit attractive F&B images. Or, as Campbell’s says, “make LTOs pretty.” Per Datassential, roughly a third of consumers will try an LTO if it looks appealing in an advertisement or in-store imagery.

Finally, and this one is crucial as it embodies the previous three tips, leverage seasonality. It’s currently summer, so what can you add in the way of flavor to an existing item? Is that item regional and locally sourced? Will photographing it and crafting a sharp post communicate the season and inspire a bit of FOMO? These questions can help guide your approach to crafting profitable LTOs.

Oh, and to help you get started, I’ve shared Campbell’s season flavor suggestions below. Cheers!

Campbell’s Foodservice Seasonal Flavors

Not only did Campbell’s share tips for succeeding with LTOs, they also provided several examples of seasonal flavors to inspire you and your team.

Since it’s July, I’ll start with their summer suggestions.

Summer: basil, blackberries, corn, cucumbers, peaches, tomatoes, watermelon, zucchini

Fall: artichokes, cranberries, edamame, parsnips, pears, pumpkin, sweet peppers, tomatillos, turnips,

Winter: butternut squash, persimmons, radishes, salsify (a root vegetable), sunchokes, sweet potatoes, tangerines

Spring: asparagus, fava beans, pea greens, rhubarb, snap peas, spring onions, strawberries

Campbell’s Foodservice sources:

  1. Foodservice and Hospitality: A strong LTO strategy helps operators retain and grow their customer base (March 2024)
  2. Datassential: Limited Time Offers Keynote Report
  3. Technomic: 162 Best-in-Class LTOs for 2023
  4. Food & Drink Resources: A Limited Time Offer Strategy For Restaurants
  5. Your Guide to Seasonal Fruits and Vegetables, The Spruce Eats
  6. Datassential: State of the LTO 2024

Image: Hybrid Storytellers on Unsplash

Bar Nightclub Pub Brewery Menu Development Drinks Food

Top