Restaurant traffic

by David Klemt David Klemt No Comments

Fantasy Sports, Sports Betting on the Rise

Interest in Sports Betting and Fantasy Sports Grows

by David Klemt

Wall full of American footballs behind large NFL logo

A recent CGA by NIQ On Premise Impact Report for August, 2023 reveals an interesting insight into consumer behavior and expectations.

To be clear, all the data on this new one-pager is useful. However, a particular revelation stands out from the rest, for me.

The CGA by NIQ US On Premise Impact Report for August 24, 2023 addresses:

  • total on-premise sales;
  • dining versus drinking occasions;
  • cost of living impact in the past month; and
  • consumer interest in fantasy sports and sports betting.

It’s that final bullet point that I find compelling. However, let’s check out the numbers for the first three points before we jump into sports.

To download your own copy, please click here.

August by the Numbers

In comparison to August 20, 2022, check value is up one percent to $50.09. Ticket count, however, is down one percent to 1,569.

As one would expect, dining occasions outweigh drinking occasions. Seventy percent of consumers have dined out in a restaurant or bar in the past two weeks.

Compared to July 2o23, that’s a two-percent increase in dining traffic.

Over the course of the same amount of time, 40 percent of consumers have gone drinking in a bar or restaurant. That’s a decrease of one percent in comparison to July 2023.

Considering that many families travel in the month of August before kids head back to school (or to drop them off at university), these numbers make sense.

Of course, cost of living may also be impacting dining and drinking occasion. Most consumers report no changes to the frequency with which they go out for drinks. Some consumers even report going out more frequently for drinks. But some are also cutting back.

For example, 28 percent of consumers have decreased how often they go out for drinks. Eleven percent are consuming lower quality drinks when they do go out, and nine percent are decreasing the “quality” of the establishments they visit.

That said, 20 percent of consumers are increasing drink quality and 21 percent are increasing establishment quality per visit. Seventeen percent are increasing how often they go out for drinks.

Fantasy Sports & Betting

This, as you may have guessed, is the statistic that I find most compelling.

Fantasy sports and sports betting has been on the rise for some time in the US. Who among us isn’t the target of sports-betting-app ads when streaming or watching sports?

Sports bar operators and operators who can position themselves as sports fans’ “third spot” will find this next number interesting.

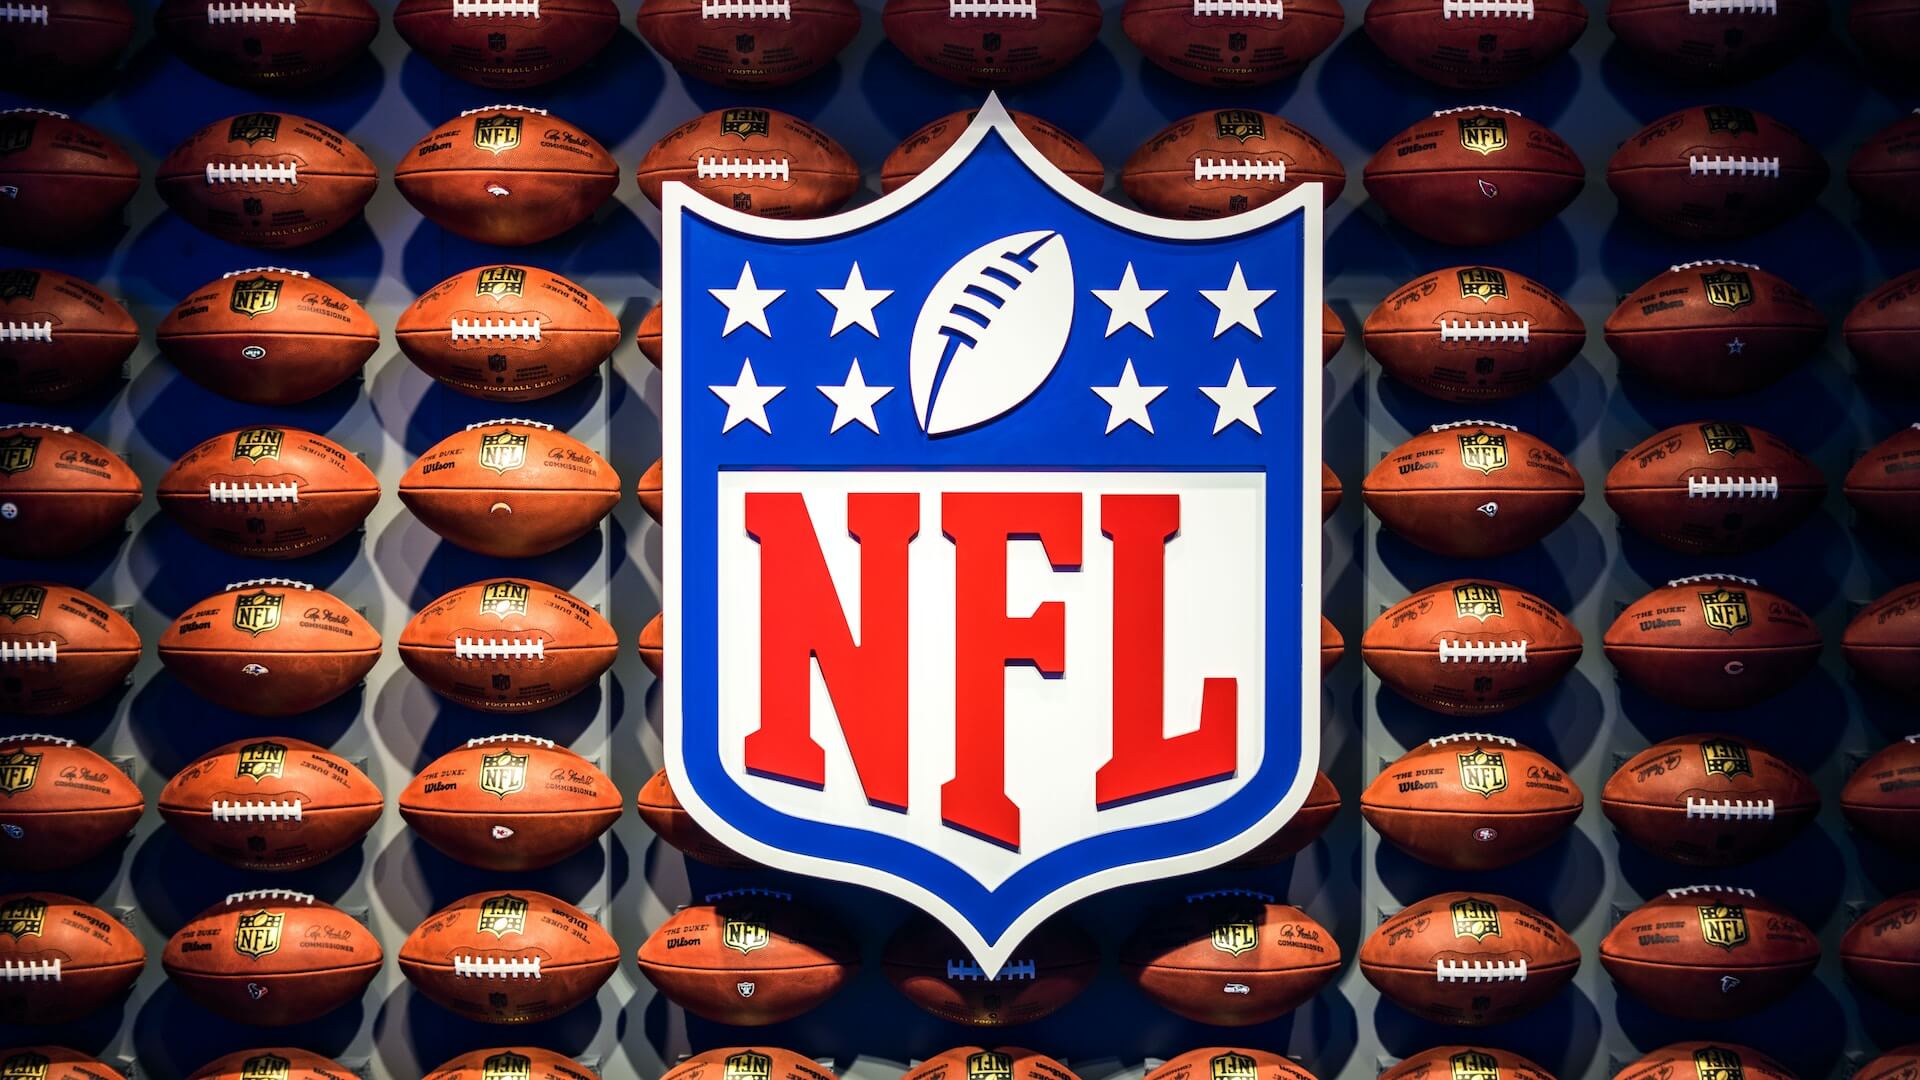
According to CGA by NIQ’s latest report, 63 percent of consumers revealed they had plans for NFL week one. Those plans included participating in daily fantasy sports or sports betting.

So, it would be wise for operators who will air NFL games this season to ensure they’re catering to fantasy football and sports betting fans. Becoming the hub for fantasy sports groups in your area can increase traffic, sales, and loyalty. And, of course, it opens up the door to many traffic- and revenue-generating sport- and team-themed LTOs.

Again, to download this new report for yourself, please click here.

Image: Adrian Curiel on Unsplash

KRG Hospitality. Gaming. Entertainment. Consultant. Food Service. Bowling Alley. Golf. Simulator. Arcades. Eatertainment.

by David Klemt David Klemt No Comments

Traffic Up but Margins Thinner

Traffic Up but Margins Thinner

by David Klemt

Chef checking tickets

The One Table 2022 report from Datassential focuses on the state of the operator and what the industry can expect moving forward.

This informative report shares survey results from 801 operators across America. While some of the findings are positive, it’s clear many operators are enduring significant challenges.

For some, traffic and sales are up. However, that’s not the situation others find themselves in.

To download and review the Datassential One Table 2022, please click here.

The Respondents

For this report, Datassential shares the survey answers from 801 respondents.

Most survey respondents are independent operators. In fact, they account for 71 percent of the participants. Making up the rest of the field are chain operators (15 percent) and franchise operators (14 percent).

As far as segment types, the majority of survey participants operate in the fast-casual space (18 percent). Unsurprisingly, fine dining is the smallest group of respondents at six percent. Thirteen percent operate midscale restaurants, and 12 percent are at the helm of casual-dining concepts. Somewhat surprisingly, just ten percent of participants operate QSRs.

Interestingly, the service format is fairly even among survey participants. Fifty-three percent of operators are full-service and 47 percent are limited-service.

Similarly, survey respondents represent the country’s regions pretty evenly:

  • South: 30 percent
  • Midwest: 29 percent
  • Northeast: 21 percent
  • West: 20 percent

In terms of market type, most respondents operate in the suburbs (49 percent). Following somewhat closely are urban-market operators, at 31 percent. Just 20 percent of survey participants operate in rural markets.

Traffic, Sales and Margins

At first glance, Datassential’s survey reveals positive news.

Now, I’m sure people find the terms “pandemic, “pre-pandemic,” and “post-pandemic” exhausting at this point. However, there’s no denying we continue to feel the aftershocks sent through the industry by the pandemic.

So, how do things look now in comparison to pre-pandemic traffic and sales levels?

First, the positives. Nearly half of survey respondents—47 percent—say their traffic is up in comparison to where it was pre-pandemic. Add to that the 14 percent who say their traffic is the same and 61 percent of operators appear to be in good shape.

In terms of sales, 51 percent of survey participants have good news. That news is that their sales are higher in comparison to pre-pandemic levels. Again, add the 14 percent who don’t see any change. So, that’s 65 percent of operators who appear to be performing well.

But with the good there’s bad. Unfortunately, 39 percent of respondents report lower traffic than pre-pandemic levels. And sales are lower than they were before the pandemic for 35 percent of survey participants.

Operator margins are lower for all respondents. Generally speaking, the profit margin for operators before the pandemic sat at 21 percent. Now, the average is 13 percent. QSRs and fast-casual restaurants are a bit higher among survey respondents: 17 percent and 15 percent, respectively.

On paper things do look up for many operators. However, the industry is still suffering, with a third struggling to rise to even pre-pandemic levels of traffic and sales.

Image: Daniel Bradley on Unsplash

Top