Notice: Function _load_textdomain_just_in_time was called incorrectly. Translation loading for the smart-post-show-pro domain was triggered too early. This is usually an indicator for some code in the plugin or theme running too early. Translations should be loaded at the init action or later. Please see Debugging in WordPress for more information. (This message was added in version 6.7.0.) in /var/www/wp-includes/functions.php on line 6114
Upscale bar | KRG Hospitality

Upscale bar

by David Klemt David Klemt No Comments

Top 10 States Attracting High Earners

Top 10 States Attracting High Earners

by David Klemt
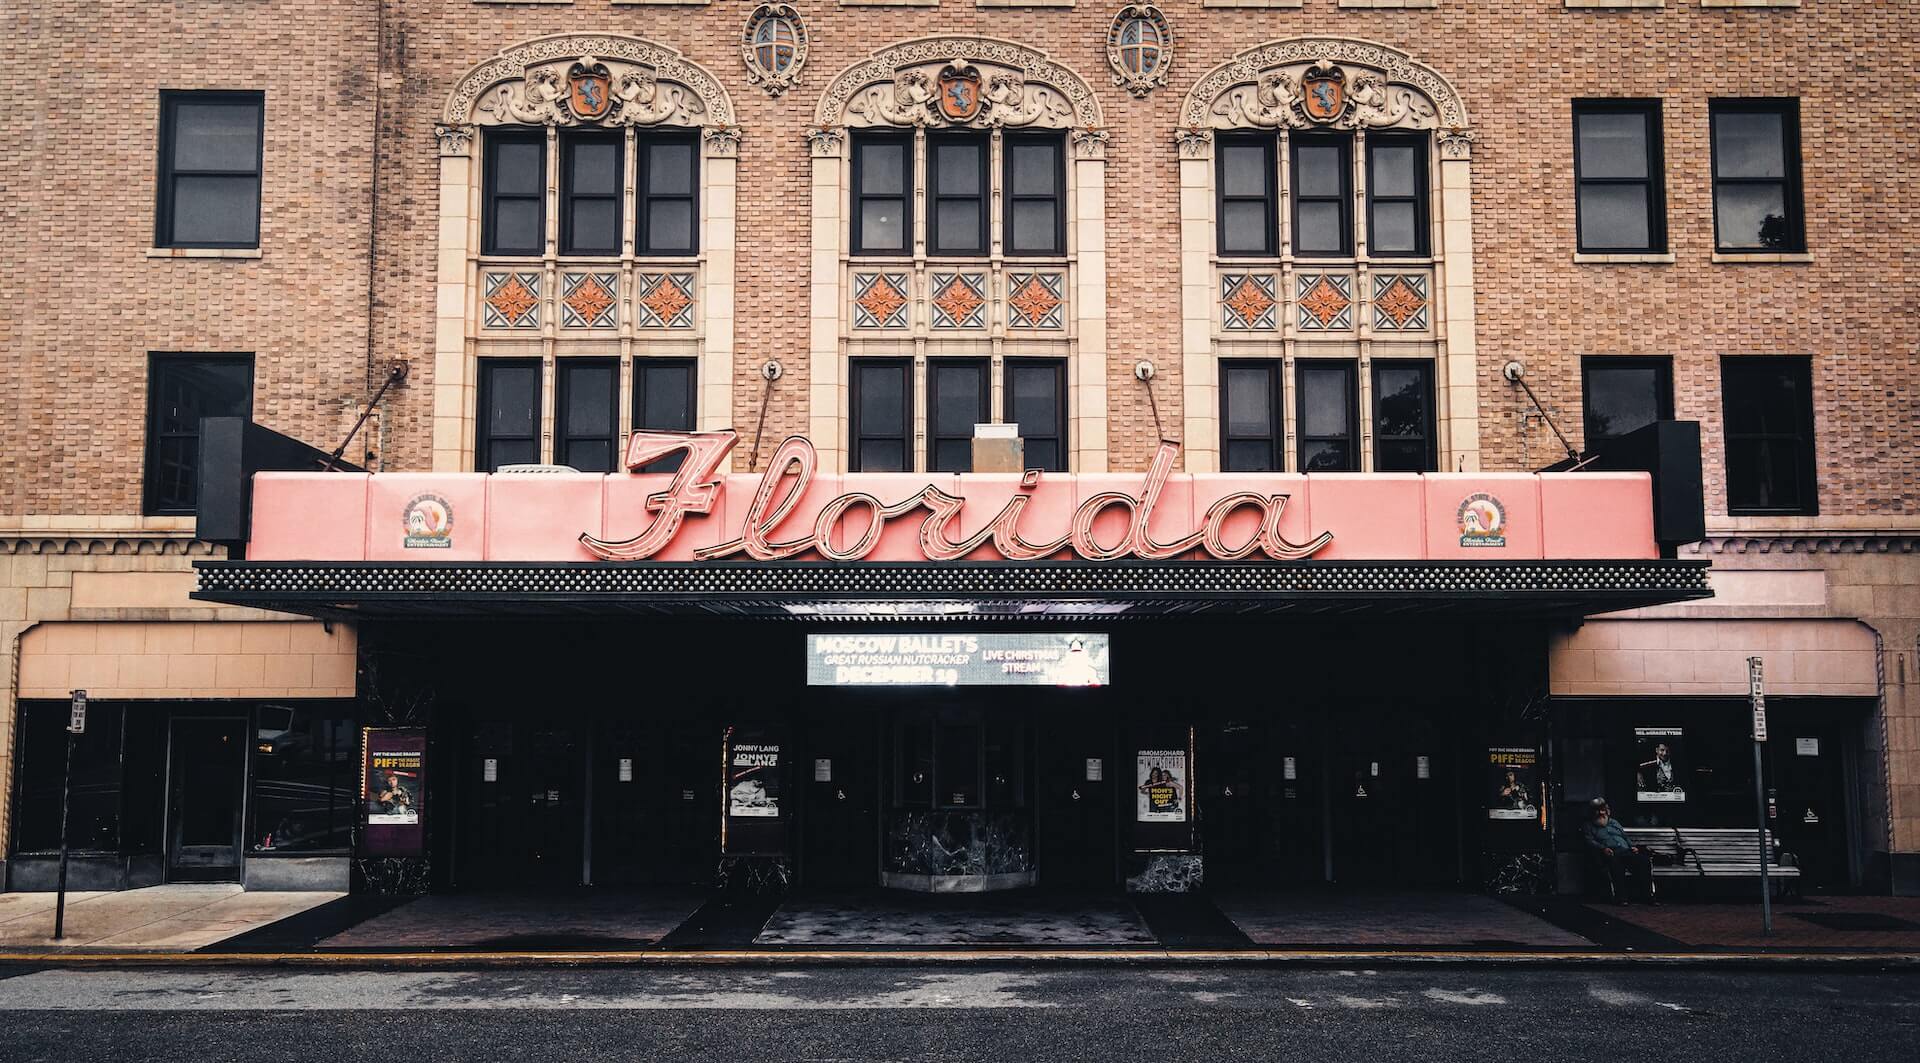
The Florida Theater in Jacksonville, Florida

Using the inflow and outflow data of tax filers earning $200,000 or more, SmartAsset identifies the top ten states attracting high earners.

When it comes to the number-one state, “it’s not even close,” says SmartAsset Advisors. Not surprisingly, several top inflow cities (according to Redfin data) line up with SmartAsset’s top inflow state list.

So, why should this information matter to operators? Plainly, it’s important market information. Population, household income, and age information are crucial considerations when opening any business.

In fact, KRG Hospitality includes such data (and much, much more) when conducting research for our proprietary feasibility, business, and concept plans. Among many elements of opening a restaurant, bar, hotel, or entertainment venue, the income of one’s target audience is crucial.

Knowing where high-income households are leaving and moving to can inform many operator decisions. Where should one open their first concept? Which markets should one consider for expansion? What type of concept will work in a market? What are the threshold price points for menu items? How will this information help inform design choices?

Operators need to recoup their outlay. The income of a concept’s ideal guest should be as important to an operator as knowing their costs.

Top Ten Inflow States

Interestingly, the top state on this list did experience significant outflow in 2020. In fact, the state lost 11,756 high-earning households in 2020.

However, the state also added 32,019 such households, netting 20,263 high earners.

  1. Utah
  2. Idaho
  3. Nevada
  4. Colorado
  5. Tennessee
  6. South Carolina
  7. North Carolina
  8. Arizona
  9. Texas
  10. Florida

Another compelling detail of the states on this list pertains to income tax. In short, three of the states don’t levy personal income tax.

Above, they’re the states in bold: Florida, Nevada, and Texas.

Top 10 Outflow States

So, above are the ten states are seeing the greatest an inflow of high-earning households. Which means, of course, there’s an inverse.

Below, the ten states experiencing the greatest outflow of high earners. Unsurprisingly, SmartAsset deems several entries on the list high-tax states. Also, Washington, DC, is a high-tax area.

Moreover, the list below includes five of the top ten high personal income tax jurisdictions (in bold).

  1. Ohio
  2. Minnesota
  3. Washington, DC
  4. Maryland
  5. New Jersey
  6. Virigina
  7. Massachusetts
  8. Illinois
  9. California
  10. New York

However, it’s not as though these states are seeing a massive exodus of high-earning households. In fact, per SmartAsset, these states have more high-income households than the national average.

Nationally, high-earning households account for less than seven percent of all tax filers. According to SmartAsset, nearly nine percent of tax filers are high-income households in the top ten outflow states.

Image: Trevor Neely on Unsplash

by David Klemt David Klemt No Comments

Forward Progress: Trends by Venue Type

Forward Progress: Trends by Venue Type

by David Klemt

High contrast image of blue cocktail with lemon zest

One notable difficulty with considering new trends is that they’re not all necessarily a universal fit for all venue types.

For example, what may work well in an upscale restaurant perhaps won’t perform as well in a sports bar. Pursuing a trend that isn’t a good fit, obviously.

As any operator with experience knows, chasing fads and trends just to chase them can be costly. Doing so costs money (inventory, training, labor hours) and time deserving of better allocation.

However, failing to embrace any trends can also be costly. Watching a lucrative trend pass by can cost an operator guest engagement, perception, and traffic.

Take, for instance, the success of White Claw. Plenty of operators and consumers scoffed at the hard seltzer category as a whole at first.

Then, some people decided it was a drink category “for women.” As it exploded in popularity, hard seltzers proved immensely popular with men.

Basically, it’s an incredibly strong beverage alcohol category that resonates with a wide range of consumers. On some menus, hard seltzers are listed alongside beers.

So, hard seltzer, led largely by White Claw, showed itself to be a worthwhile trend to adopt.

Clearly, however, hard seltzer doesn’t resonate with all guests on all occasions in all types of hospitality venue types. For instance, generally speaking, a bucket of White Claws likely to be a top seller in a high-end restaurant specializing in seven- to nine-course meals.

Drink Trends by Venue

During Bar & Restaurant Expo in March of this year, Amanda Torgerson of Datassential presented 2022 drink trends operators should know.

One trend has essentially proliferated the industry. Really, it’s likely wise for us to all view this trend—hard seltzer—as mainstream now.

In the context of Torgerson’s presentation, Datassential is saying that hard seltzers are here to stay.

Among other trends, Torgerson shared Datassential’s data-backed view of drink trends segmented by venue category.

While every venue is unique and not every trend will work for every bar or restaurant in a given category, the results are no less intriguing.

Pubs: Dry-hopped beers, pastry stouts, and hard or spiked coffee.

Sports Bars: Mini-beers, hard seltzer, and reusable growlers.

Casual Bars: Seltzers with unique flavors, hard tea, hard lemonade, and drinks featuring local ingredients.

Upscale Bars: Negroni, wine-barrel-aged spirits, and flaming cocktails.

Nightclubs: Hard seltzers served with spirits, cocktails and punch bowls served with dry ice, and flaming cocktails.

Casual Restaurants: Wine cocktails, elevated brunch cocktails, and tea-based alcohol beverages.

Upscale Restaurants: Flaming cocktails (smoked may be better), all-natural wines, and made-to-order cocktail cart presentations.

Hotels, Resorts and Casinos: Made-to-order cocktail carts, alcohol vending machines, and drinks made with cold-pressed juices.

Interestingly, a few of the above trends identified by Datassential appear in multiple venue types.

The main things for an operator to keep in mind is what will resonate with their guests and what’s authentic to their brand. When it comes to trends, one size doesn’t fit all and an individual venue’s mileage will vary.

However, the above list should at least show operators what Datassential sees resonating with guests in an array of venues.

Image: Ozge Karabal on Pexels

Top