#NRN

by David Klemt David Klemt No Comments

Why We Offer Tech-stack Planning

Why KRG Hospitality Offers Tech-stack Planning

by David Klemt

Black-and-white photograph of shelves loaded with broken desktop computers and monitors

If your hardware looks like this, it may be time to update your tech stack.

Navigating the seemingly endless restaurant, bar, and hotel technology options available to operators can feel like an overwhelmingly complex task.

This can be particularly true for brand-new operators and those with a decade or more of experience under their belts. For the former, where does one with little to no experience even begin putting together their technology stack?

And for the latter, what tech upgrades are worth implementing, and which platforms are crucial; which are nice to have; and which are unnecessary for a particular concept?

Sitting down and sifting through the platforms within just a few categories can be a significant investment of time. Learning to use each solution and training relevant team members on them also requires considerable time and effort. That’s to say nothing of the initial and monthly outlay of precious monetary resources after making selections.

Of course, there’s also the nagging feeling that maybe the platforms chosen aren’t the “right” fit, or the best in class.

Most operators, regardless of the length of time they’ve been in hospitality, are aware of a handful of tech selections they need to make. They know they need a point-of-sale system, a customer relationship management option, an online ordering platform, a reservation system.

But what about inventory, gratuity management, marketing campaign management, guest feedback, scheduling, catering, website chatbots, AI-enhanced loyalty programs, and even kitchen displays?

According to Brizo Foodmetrics, operators need to consider a dozen tech categories. At KRG Hospitality, we say there are at least that many.

Difficult Choices

Per a new report from Nation’s Restaurant News, people are excited but cautious about the tech available to the hospitality industry. Anyone interested in reviewing the 2024 Restaurant Technology Outlook report can click here to gain access.

Among the report’s insights are the identification of a number of challenges operators face when it comes to tech decisions. The most-significant barrier is still pricing, with 37 percent of NRN survey respondents saying hardware comes with high costs. Further, 30 percent think there’s not enough transparency surrounding additional fees.

There’s also an interesting perception as regards features. While 33 percent of respondents feel the systems they’ve selected are light on functionality, 18 percent say their systems have functions that they don’t even use.

Thirty-two percent of survey respondents identify a lack of knowledge of systems as a barrier to adopting new tech solutions. In some good news, just ten percent of respondents say systems are too difficult to use. Still, ten percent of our industry is a significant number.

Combined, 87 percent of those surveyed will either possibly (24%), probably (33%), or definitely (30%) invest in tech in 2024. That’s an impressive number.

However, 39 percent of respondents were “definitely” going to invest in tech in 2023. That’s a drop of nine percent.

Here to Help

When we at KRG develop a tech stack for a client, it’s with their specific project and needs in mind.

And while we do have preferred partners, we present multiple options. Moreover, each option comes with a synopsis of features and a justification for its inclusion.

If a preferred partner isn’t the best option or the client wants to choose something else, we support that decision. Tech is challenging enough already without being steered toward specific platforms for no other reason than, “We like this one.” These decisions aren’t about us, they’re about what’s best for our clients.

At the end of each tech-stack plan are estimated costs for each option. We include the onboarding fees, monthly fees, and the annual cost. Again, these are close estimates as modules, additional features and hardware like handhelds, and subscriptions can increase or reduce the overall cost.

The hospitality industry tech landscape is transforming from a barren desert to a thriving wetland. KRG Hospitality is here to help you navigate this complex terrain.

Image: z yu on Unsplash

Bar Pub Brewery Nightclub Club Nightlife Technology Plan Tech Stack

by David Klemt David Klemt No Comments

Which Chains are America’s Favorites?

NRN & Technomic Identify America’s Favorite Chains

by David Klemt

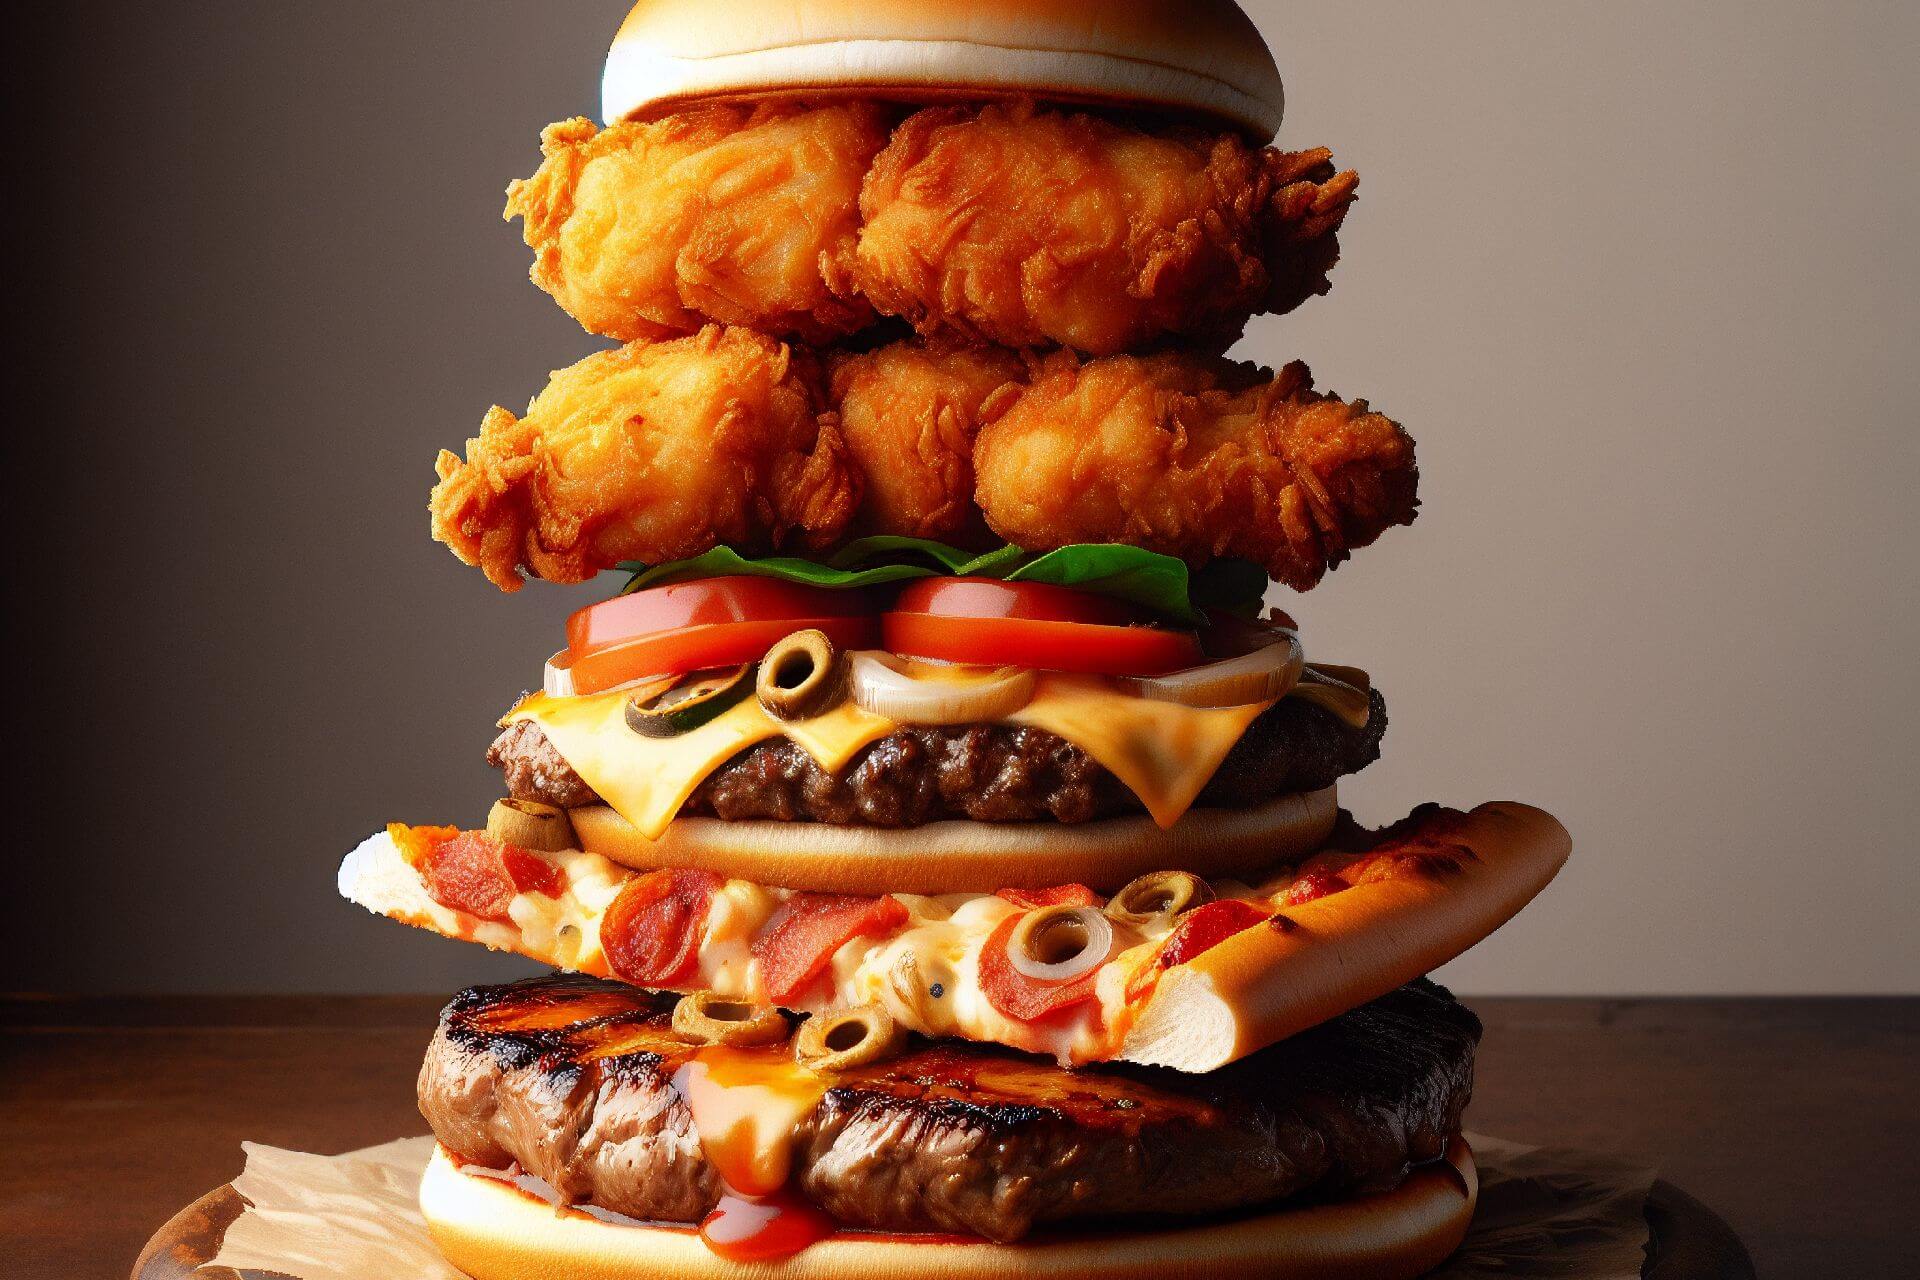
A cheeseburger with chicken patties, pizza, and steak on it

Alright, which one of you maniacs out there is going to make this AI-generated chicken-patty-pizza-steak burger a reality and put it on your menu?

Toward the beginning of 2024, Nation’s Restaurant News collaborated with Technomic to identify America’s favorite restaurant chains.

To my understanding, this is the first such partnership between the independent foodservice publication and the foodservice intelligence platform.

Providing more than just a glimpse into America’s favorite chains, the rankings span several categories. For instance, the partnership between NRN and Technomic reveals the top QSRs, along with the country’s favorite fast-casual, family-style, and miscale restaurants.

However, the top three chains across more granular categories are also identified. Examples include America’s favorite chicken, pizza, burger, and Mexican restaurants.

In fact, I’m going to kick things off with the more specific, specialized categories. Then, I’ll move into the broader segments.

That said, I encourage you to review NRN‘s article revealing America’s favorite midscale, casual, QSR, etc. restaurants for yourself. Written by Joanna Fantozzi, the piece is full of valuable insights beyond simple rankings.

Further, you may find it interesting to compare these rankings to the results of BrandVue’s Most Loved Eating Out Brands 2023 report, which we reviewed here.

Cheers to NRN and Technomic! Here’s to hoping that this becomes an annual release.

Beverage or Snack

  1. Tropical Smoothie Cafe
  2. Smoothie King
  3. Jamba

Burger

  1. Culver’s
  2. In-N-Out
  3. Freddy’s Frozen Custard & Steakburger

Chicken

  1. Chick-fil-A
  2. Jollibee
  3. Raising Cane’s

Italian (FSR)

  1. Carrabba’s Italian Grill
  2. Maggiano’s Little Italy
  3. Mellow Mushroom

Mexican

  1. Chuy’s Tex-Mex
  2. Torchy’s Tacos
  3. Moe’s Southwest Grill

Pizza

  1. Papa Murphy’s
  2. Marco’s Pizza
  3. Cici’s Pizza

Sandwich

  1. Jersey Mike’s Subs
  2. Newk’s Eatery
  3. Jason’s Deli

Steak

  1. Ruth’s Chris Steak House
  2. Fleming’s Prime Steakhouse
  3. Longhorn Steakhouse

Varied Menu

  1. Seasons 52
  2. Bahama Breeze Island Grille
  3. Cooper’s Hawk

QSR

  1. Dutch Bros Coffee
  2. Topical Smoothie Cafe
  3. Smoothie King
  4. Cold Stone Creamery
  5. Chik-fil-A

Fast Casual

  1. Jersey Mike’s Subs
  2. Newk’s Eatery
  3. Jason’s Deli
  4. McAlister’s Deli
  5. Sweetgreen

Family Style

  1. First Watch
  2. Cracker Barrel
  3. Golden Corral

Casual

  1. Seasons 52
  2. Bahama Breeze Island Grille
  3. Bonefish Grill
  4. Longhorn Steakhouse
  5. Cooper’s Hawk

Midscale

  1. First Watch
  2. Cracker Barrel
  3. Golden Corral
  4. Shoney’s
  5. Black Bear Diner

Favorite Chains: Overall

  1. Ruth’s Chris Steak House
  2. Season 52
  3. Dutch Bros Coffee
  4. Fleming’s Prime Steakhouse
  5. Bahama Breeze Island Grille
  6. Longhorn Steakhouse
  7. Cooper’s Hawk
  8. Tropical Smoothie Cafe
  9. The Capital Grille
  10. Smoothie King

When it comes to this list of the top-ten favorite chain restaurants, Technomic data scores a number of crucial insights.

Click here to see how each of these industry leaders ranked in:

  • Service and hospitality
  • Unit appearance and ambience
  • F&B
  • Convenience and takeout
  • Value

Image: Shutterstock. Disclaimer: This image was generated by an Artificial Intelligence (AI) system.

KRG Hospitality. Restaurant Business Plan. Feasibility Study. Concept. Branding. Consultant. Start-Up.

by David Klemt David Klemt No Comments

What are You Changing in 2024?

What are You Changing in Your Restaurant or Bar in 2024?

by David Klemt

Restaurant owner reviewing their menu

More fun with AI-generated images. That’s quite the busy bar setup.

Toward the end of last year, Nation’s Restaurant News identified what changes operators chose to make after analyzing their operational data.

The publication surveyed hundreds of operators about how data drove their decisions. This survey was an element of their year-end report, Market Leader Report: The Data-driven Restaurant.

As one would imagine, this report focuses on data collection, analysis, and usage. However, NRN‘s report doesn’t just address the importance of data collection in the F&B space. Rather, they seek to understand if operators are collecting the “right” data; whether they can optimize the data they collect; what metrics they’re tracking; and how they’re acting on all that data.

Simply put, it’s an important report addressing a topic crucial to today’s restaurant and bar operations. Those who want their own copy of The Data-driven Restaurant can download it free here.

While entire report is valuable, the focus of this article is one question and the answers provided. Below, to provide context, is a breakdown of the survey respondents.

The Who

Most of the respondents identified as independent restaurant operators.

  • Indie: 37 percent
  • Chain (franchisee): 21 percent
  • Chain (company owned): 18 percent
  • Multi-concept: 15 percent
  • Single-site operator: 6 percent
  • HQ or brand level of foodservice company: 3 percent

By a slim margin, most survey respondents categorized their restaurants as full service or casual dining.

Perhaps unsurprisingly, the fewest respondents operate in the upscale or fine dining category.

  • Full service / casual dining: 30 percent
  • Fast casual: 28 percent
  • Quick service: 20 percent
  • Midscale / family dining: 15 percent
  • Upscale / fine dining: 7 percent

The What

So, what question caught our attention at KRG Hospitality?

“In the past 12 months, which initiatives did your organization undertake after analyzing data?”

NRN conducted this survey in November 2023. Not surprisingly, respondents mostly made changes to their menus after reviewing their data. Streamlining menus and adjusting prices were two of the biggest operational trends last year, as many operators are no doubt well aware.

That theory is supported by the survey results. Below, the top four answers to the question above.

  • Changed menu prices (48 percent)
  • Removed items from or added items to our menu (47 percent)
  • Improved the way we trained our staff (26 percent)
  • Adjusted our loyalty program’s rewards and/or incentives (24 percent)

Honestly, it’s heartening to see that training is among the top-three data-driven actions operators took last year. And, of course, it’s not shocking that the menu was the focus of the most attention. Streamlining is an effective way to reduce food and labor costs. Further, pricing is always (please excuse the pun) on the menu.

Our question is: What changes, if any, do you plan to implement this year now that we’re headed into Q3?

The What: The Sequel

If the menu received the most attention after operators reviewed their data, what received the least?

Well, it appears marketing fell to the wayside, along with the kitchen. The following are the bottom four answers to the question in the section above:

  • A/B tested marketing campaigns and increased ROI (6 percent)
  • Changed specs on our kitchen equipment or technology (10 percent)
  • Identified lapsed customers and marketed to them (11 percent)
  • Increased throughput in our kitchen during peak periods (13 percent)

Now, I’ll concede that one marketing action found itself in the middle of the pack when it came to this survey question. Upon analyzing their data, 18 percent of respondents identified new potential guests and marketed to those people.

Still, in comparison to making changes to menus, the fewest respondents took marketing action or made changes to the kitchen directly.

Does this mean that menu changes have the greatest impact on guests and ROI? Well, that’s possible. However, I think something else is at play.

Personally, I think collecting data is the easy part. At this point, most platforms serving our industry are collecting data for operators.

But tracking the correct metrics, analyzing the associated data, and knowing what to do after analyzing said data? That’s difficult. It can be overwhelming, which is why it’s so important to build and implement the proper tech stack for a specific concept. This is why one of the services we offer our clients is tech-stack development.

Further, the tech stack needs to be built around an operator and their leadership team. If nobody knows how to use it or what to do with the data they’re collecting, it’s useless.

Image: Shutterstock. Disclaimer: This image was generated by an Artificial Intelligence (AI) system.

Bar Pub Brewery Nightclub Club Nightlife Technology Plan Tech Stack

Top