Report

by David Klemt David Klemt No Comments

Square: 2022 Threats & Opportunities

Square: 2022 Threats & Opportunities

by David Klemt

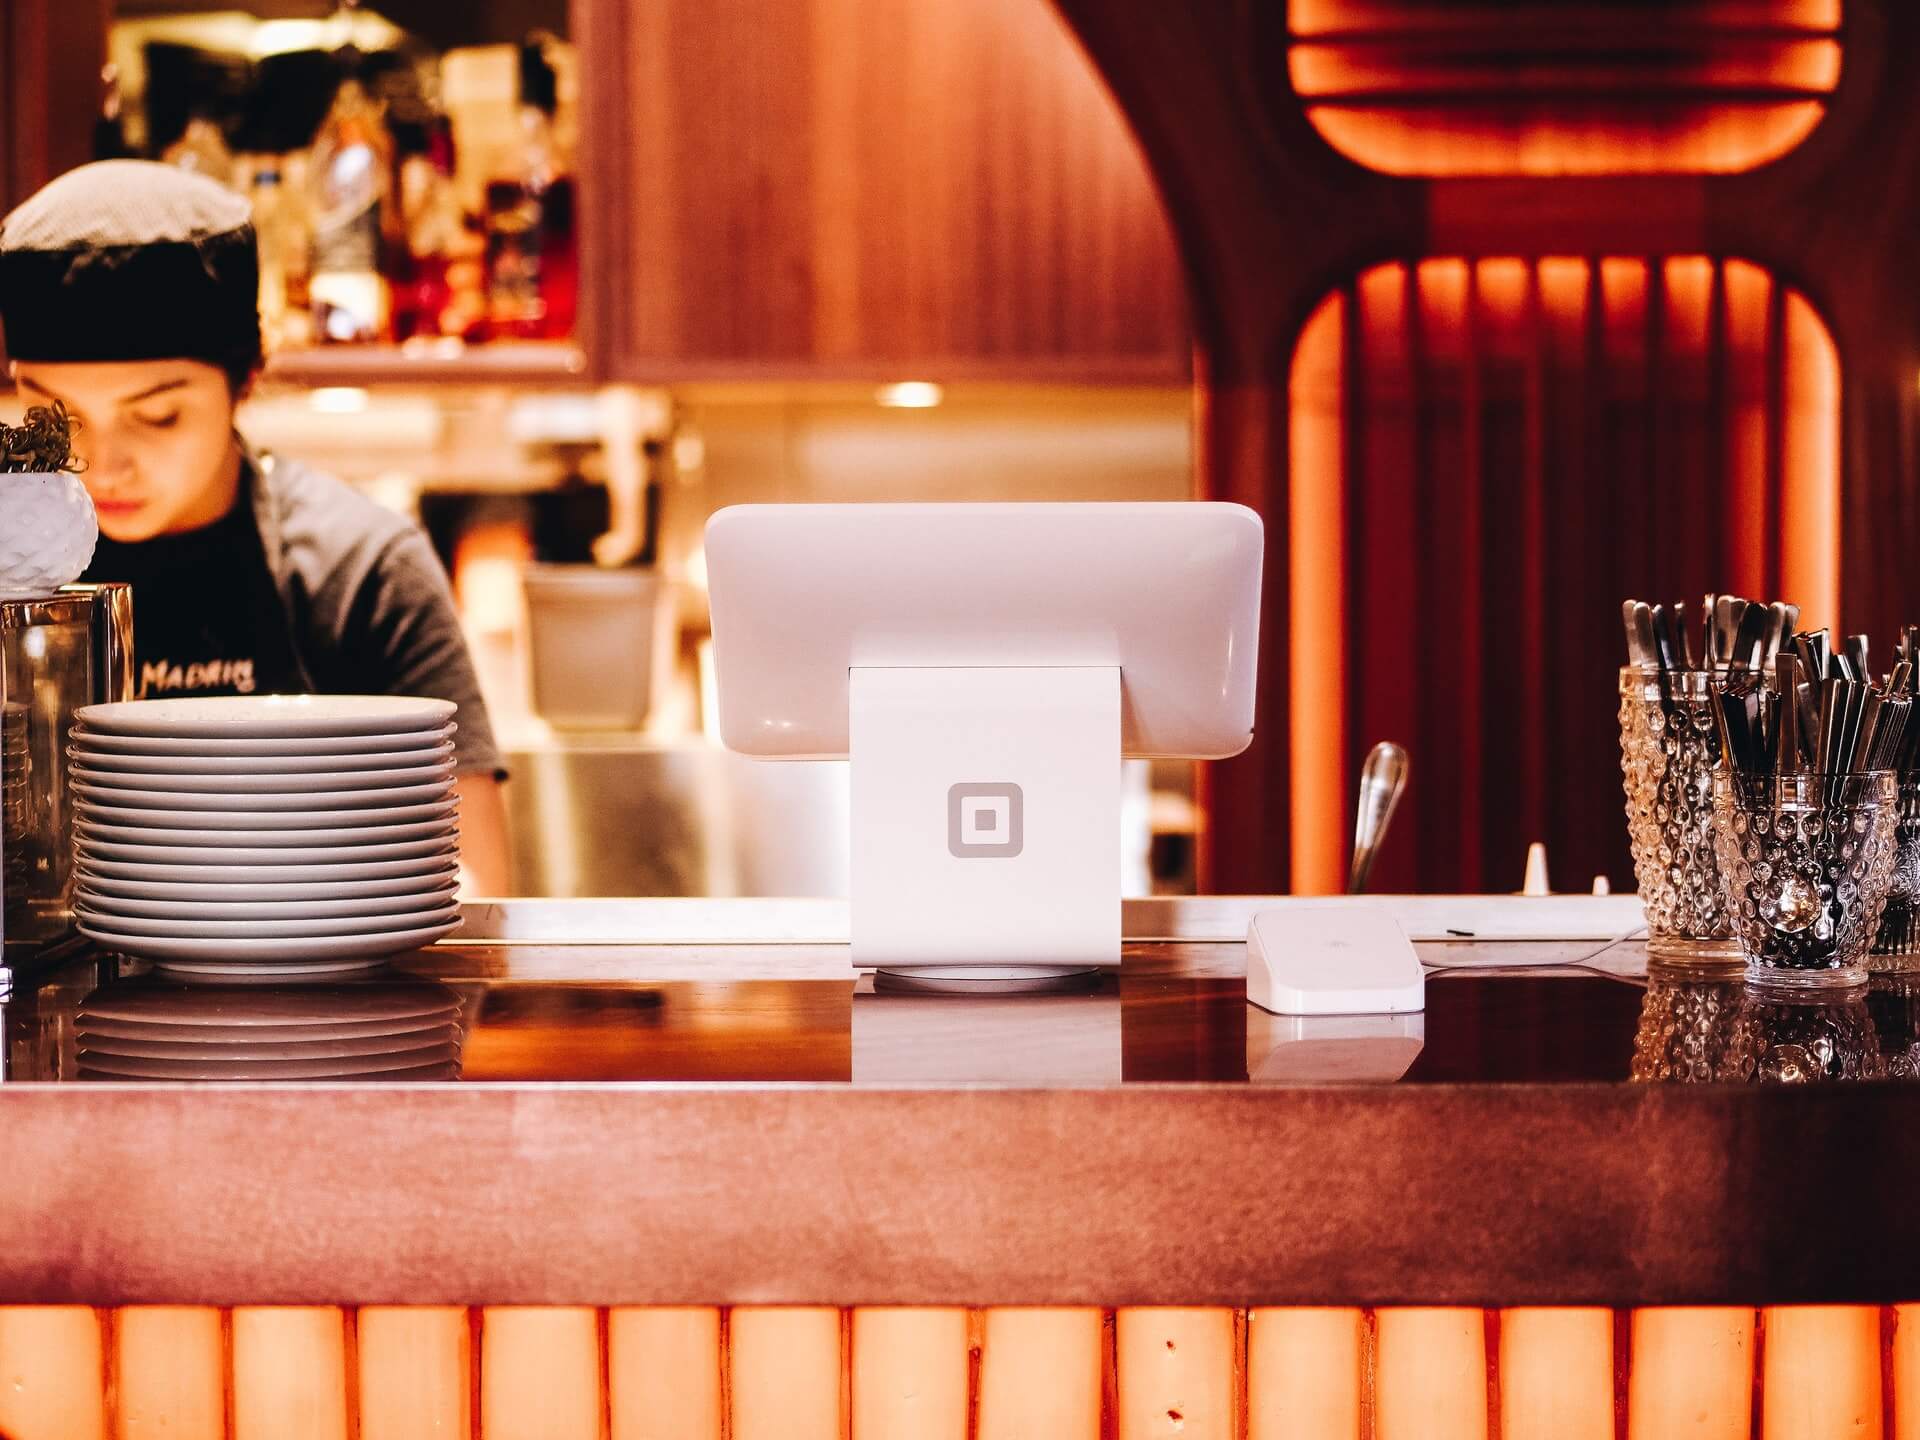
Square terminal in restaurant kitchen

As all hospitality professionals know, the past nearly two years is imposing rapid change on the industry, necessitating rapid, strategic adaptation.

The key word in the above sentence isn’t “adaptation,” it’s “strategic.”

Of course, it’s hard to make strategic choices without as much information as possible.

To that end, we’ve reviewed Square‘s recently released “Future of Restaurants: 2022 Edition.” This is the company’s second annual Future of Restaurants report.

Square partnered with Wakefield Research, surveying 500 operators and 1,000 consumers to identify 2022 threats and opportunities.

Threat: Labor Shortage

Most operators aren’t going to want to read this prediction from Square. However, we can’t identify and adapt for opportunities if we don’t acknowledge threats.

Per Square’s report, the labor shortage may never see a correction. In other words, welcome to yet another new normal.

More than 70 percent of operators say they’re facing a labor shortage, per Square. Just over 20 percent of available positions were, at the time the survey was conducted, unfilled.

Instead, operators will likely, according to Square, need to make operational and work culture changes:

  • Improve working conditions. For example, encouraging and acting on team feedback. Another example? Modernizing scheduling.
  • Ensure workers are being mentored and not simply managed.
  • Hire, train, assign tasks, and schedule more strategically to operate with a smaller team.
  • Offering incentives that entice higher-quality candidates to work for you.

One participant quoted in the Square report claims that QR code ordering dropped their labor cost percentage by 150 percent.

Threat: Lack of Tech

As SevenRooms suggested when looking forward to 2022, technology solutions can lessen the burden of labor shortages. That leads us to another big threat: failing to embrace tech.

Some operators bristle at the word “automation.” For many, it conjures an image of robots in the kitchen and delivering food to tables.

Obviously, we’re opposed to replacing staff with any form of automation. However, we support automating tasks if that means team members are better utilized.

Why not automate inventory? Why not automate online order filling? If it improves operations and the guest experience, automation is less threatening.

According to Square’s report, 62 percent of operators think automation is appealing for managing online, delivery, and contactless orders. Ninety percent of operators say that back-of-house automation—if staff can focus on more important tasks—is a good idea.

More than 90 percent think automated inventory is an appealing solution.

It has taken a lot of time for hospitality to catch up to other industries in embracing tech. But Square reports that 36 percent of restaurants upgraded their business tech in 2021.

Of course, automation will become a threat if operators lean too heavily into it and stop paying attention to detail.

Phrased another way, be tech-savvy, not tech-reliant.

Opportunity: Omni-channel

Square see implementing an omni-channel strategy as the way forward. In fact, their general manager for Square Restaurants, Bryan Solar, said the following:

“We see the time of the dine-in only or takeout only as largely done forever.”

Going omni-channel (diversifying) in the restaurant space means making online ordering and delivery important elements within the overall business strategy. To that end, Solar posits kitchens will grow in size to better handle online orders.

Square’s survey reveals some intriguing numbers:

  • 13 percent of consumers say they’ll avoid restaurants that don’t offer online ordering.
  • Among restaurants with online ordering, those channels generate 34 percent of their revenue.
  • Over the past year, 54 percent of restaurants either added or expanded online ordering channels.
  • Online ordering is likely here to stay: 69 percent of respondents plan to offer it post-Covid-19.
  • 24 percent of operators are planning to allow guests to order alcohol from them online.

Another interesting set of numbers pertains to first- and third-party delivery. As we’ve stated several times, we much prefer operators offer first-party or direct delivery. According to Square, 49 percent of operators plan go direct delivery. More than half—62 percent—will pursue third-party delivery. That suggests that some operators will offer both.

Opportunity: Direct Ordering

When it comes to engaging online guests, operators need to control the experience. As I wrote for another publication years ago, a restaurant or bar’s website is still very important.

This statistic proves that statement true: Per Square, 68 percent of online guests want to order via a restaurant’s website or app, not a third-party.

More than likely, a significant portion of those guests want to know they’re supporting a restaurant and its staff directly. Hence the importance placed on ordering via the website or their own branded app.

So, operators would do well to ensure their websites feature an ordering widget. Or, they can opt to have an app built (or at least skinned) for their business.

Opportunity: Kiosks

According to Square’s survey results, 79 percent of consumers prefer ordering from kiosks over ordering from staff.

Most consumers and operators likely associate ordering kiosks with fast food restaurants. However, other categories can also benefit from these devices.

Close to half—45 percent—identified it as a preference when ordering at a casual-dining restaurant.

And fine dining isn’t immune to the convenience of tech. A little over 20 percent of consumers prefer to order via kiosk in the fine-dining space.

Overall, kiosks speak to the guest desires for convenience and safety. More than a third indicated that ordering via digital menu is appealing because they don’t have to touch a menu someone else has touched. And 37 percent like a digital option because they don’t have to wait for a server to bring them a physical menu.

Eleven percent of Square survey respondents will avoid a restaurant if they don’t offer digital menus.

Nearly half (45 percent) of restaurants are planning to offer QR code menus post-Covid-19. Another benefit of digital menus is dynamic pricing. As costs fluctuate, operators can increase or reduce prices easily without printing new menus.

Outlook

Representing a stark contrast from 2020 survey results, nearly 60 percent of operators say the survival of their restaurants is a concern in 2022.

That’s still a high number but vastly lower than how operators answered about 2021. Last year, 92 percent of operators surveyed said they were worried about survival.

According to Square’s report, operators are looking past surviving and making long-term plans. That’s a welcome sign that confidence is improving.

To review Square’s “Future of Restaurants: 2022 Edition” report in its entirety, click here.

Image: Patrick Tomasso on Unsplash

by David Klemt David Klemt No Comments

SevenRooms Predicts 2022

SevenRooms Predicts 2022

by David Klemt

SevenRooms guest data image

As we near the end of a tumultuous 2021 we must look ahead to 2022 to set our industry up for best strategies, innovations, and recovery.

SevenRooms is doing just that, looking at what operators should consider to meet guest expectations next year.

In a blog post on the company’s website, SevenRooms reveals what they believe are the keys to success in 2022.

Let’s jump in.

More is More

The first quarter of 2022 will mark two years of the pandemic and its affects on the industry.

As SevenRooms says, some guests will not have been out of their homes for two years. The company predicts this contingent will be looking to unleash pent-up demand.

Of course, that represents an opportunity for operators. Another wave of pent-up demand can mean a boost in traffic and revenue.

However, guest expectations will be sky high. That cliché that less is more? Yeah, you can toss that right out.

More will be more for this contingent of guests looking to dine and drink out after feeling cooped up for month after endless month.

Sure, some guests are aware that operators are facing labor shortages, increased costs, and other pandemic-driven challenges. They know that workers are overwhelmed and finding themselves in hostile confrontations they certainly don’t deserve.

And sure, some guests are sympathetic to those struggles. However, they have their demands and expect restaurants, bars, and hotels to meet them.

What can operators do to meet those demands? In fact, what can they do to anticipate and overdeliver on guest expectations?

SevenRooms has a couple suggestions.

Collect guest data. At this point, this should be a given. How can an operator engage with and retain guests if they don’t really know anything about them?

Embrace more tech. Platforms like SevenRooms can handle a restaurant or bar’s reservations quickly and easily. This is a feature that, per SevenRooms, more than half of guests expect a restaurant or bar offer. Some platforms can also automate marketing; send guests post-visit surveys; and tackle review aggregation.

Convenience Reigns Supreme

Here’s a quick, impromptu survey:

Do you prefer a seamless restaurant, bar or hotel experience, or do you like frustrating dining, drinking and lodging experiences?

I’m going to go ahead and assume you prefer the former option. In other words, you like what your guests like: convenience.

Well, SevenRooms is predicting that the desire for convenience will only grow stronger among guests.

Yes, delivering on the increasingly important topic of convenience will rely on collecting data. But rather than view it as just one more task, SevenRoom suggests looking at it in a more positive light.

A number of the conveniences guests expect can be automated. They can even help ease the burden of the labor shortage somewhat.

For example, contactless ordering and contactless pay are close to becoming standards. Offering those features to guests means meeting expectations, thereby delivering an excellent guest experience. On-demand ordering and paying can also ease some front- and back-of-house pressure.

Collecting guest data allows management and front-of-house staff to add personal touches before a guest is even seated. Again, seamless, excellent guest service.

Another convenience? Online ordering. SevenRooms isn’t the first to predict that on-demand ordering is here to stay. In fact, a suite of conveniences will be important moving forward:

  • Online ordering during in-person visits and for delivery or pickup.
  • A user-friendly reservation system that goes deeper than just picking a date and time. Why not allow guests to select seats and even request upgrades?
  • A virtual waitlist. Not only is this convenient, SevenRooms says this feature can boost walk-in traffic and reduce abandonment.
  • Contactless, mobile paying options.

There you have it. Two seemingly basic predictions—higher expectations and a desire for even more convenience—with the potential to boost traffic, loyalty, and revenue.

Image: SevenRooms

by David Klemt David Klemt No Comments

Canadian Trends 2022: Technomic

Canadian Trends 2022: Technomic

by David Klemt

Yellow neon "butter" sign and scaffolding

Curious about what to expect in 2022 as a Canadian restaurant, bar or hotel operator?

Technomic has some predictions for next year.

Reviewing their “Canadian Trends: Looking Ahead to 2022” report, creativity and streamlining will be keys to success.

Let’s jump in!

Butter

Yes, this is why I chose the image above. Technomic is very specifically identifying butter as an important 2022 F&B trend.

And no, they don’t appear to be predicting the popularity a particularly rare or esoteric butter. The industry intelligence firm means butter will prove important in 2022.

In large part, Technomic is pointing to comfort food as a driver for butter.

Generally, the firm points to how versatile butter is in the kitchen. Browned and herb-infused butters, says Technomic, will find its way into cocktails.

Flavor and texture will play an important role, extending the butter prediction into buttery foods territory. For example, Technomic predicts butterscotch, buttermilk and ghee will see a boost in usage and demand.

Additionally, the plant-based movement will help nut butters grow more popular. In fact, Technomic says nut butters will find their ways onto burgers and into cocktails.

Interestingly, the firm’s butter prediction gives operators two larger trends to watch: comfort food and plant-based.

Cross-utilization

You don’t need me to tell you that North America—and the rest of the world—is facing supply chain issues.

I know you’re exhausted from just the past nearly two years of constant adaptation and pivoting. In 2022, you’ll have to continue with your creative problem solving.

The supply chain challenge (there’s an understatement) requires creativity in several areas. This includes the kitchen and menu.

Technomic suggests that one path forward through supply chain problems involves ingredient preparations:

  • Pickling
  • Candying
  • Salt-baking

The firm says these creative takes on ingredients operators already have will extend product life; add new flavors to dishes; and deliver new textures. Those last two offer guests new experiences.

In addition, getting creative with the ingredients you may be able to get more readily will help streamline and update 2022 menus. However, revising your menu will require careful consideration of your supply chain and cross-utilization, with a heavy helping of creative prep.

Running Lean

Smaller footprints. Shrunken staff. Streamlined menus. Smaller, shrunken, streamlined, optimized, leaner…

Call the process whatever you want, Technomic is predicting that operators will need to “optimize” (read: make smaller) their businesses.

Of course, there isn’t a one-size-fits-all solution. We’ve read and heard predictions since last year about what will need to shrink moving forward.

While some recent news reports say that ghost kitchens are out, Technomic seems to think that’s not the case. Technomic suggests ghost kitchens will remain viable for operators who want to expand without investing in real estate.

Additionally, Technomic’s report suggests something that should come as no surprise. In short, if it works for a brand or location, smaller may be better and here to stay.

Growth

Now, this is the most promising of Technomic’s predictions: Growth.

Per the firm, the foodservice industry in Canada was down 29 percent in Q1 of 2021. Pre-pandemic, sales reached $95 billion. That represents a loss of nearly $30 billion.

However, there’s reason to be optimistic in 2022, according to Technomic.

The firm expects growth of 21 percent in 2022 over 2021, or sales of $74.8 billion. Should this prediction prove accurate, 2022 would close just three percent under pre-pandemic sales.

Technomic identifies full-service as the foodservice segment to experience the most growth next year at 26.2 percent. In comparison, the firm predicts limited-service to grow 7.3 percent.

Next year won’t be easy. 2022 won’t be a magical return to normalcy. But there is room for optimism if Technomic’s predictions are correct.

Image: Jon Tyson on Unsplash

by David Klemt David Klemt No Comments

Hard Numbers for the Holidays

Hard Numbers for the Holidays

by David Klemt

Classic vintage Dodge pickup truck with winter wreath on grille

From comfort foods and specific seasonal flavors to LTOs and traditional tastes, data reveal what consumers want this holiday season.

As we reported last week, there’s reason to be optimistic about this year’s holiday season.

According to Datassential, consumers are eager to visit sit-down restaurants this month. One of their key findings was that the average group size will likely be smaller than normal.

Specifically, most groups will probably consist of seven to 12 guests. Crucially, Datassential sees potential from people eager to gather with family and friends for the holidays. Even better, of all options, sit-down restaurants are the top choice for gatherings outside of homes.

But drilling down deeper, what do guests want from restaurants during the holidays?

The Numbers

So, when it comes to the holidays, Datassential wants operators to remember that December includes more than Christmas and New Year’s Eve.

To that end, the first numbers I’m presenting are dates:

  • Hanukkah: November 28 to December 6 (ends this evening!)
  • Soyal: December 21
  • Christmas: December 25
  • Boxing Day: December 26
  • Kwanzaa: December 26 to January 1
  • New Year’s Eve: December 31
  • New Year’s Day: January 1

Those dates reveal something compelling: Plenty of opportunity to get creative and ramp up limited-time offers. Per Datassential, nearly half (44 percent) of consumers look forward to seasonal, holiday-themed LTOs.

In fact, roughly two out of five consumers find seasonality to be an important factor in their decisions to order LTOS and new menu items.

However, it’s important to know your audience and brand when coming up with special menu items. That’s because according to Datassential, 62 percent of consumers, at least for 2021, want classics and comfort food this season.

So, Datassential cautions operators against veering “too far” from traditional seasonal menu items and comfort foods. That said, you should know how far outside the box you can push your guests.

The Flavors

We’re not technically out of the fall just yet. The start of winter is December 21.

It can be smart to begin transitioning from fall to winter flavors over the next week or so. However, it may not be wise to toss fall flavors out entirely.

Datassential identifies the following as key fall flavors:

  • Apple cranberry
  • Butternut squash
  • Chestnut
  • Duck
  • Pumpkin pie
  • Stuffing

And these are important winter flavors, per Datassential:

  • Chocolate almond
  • Candy cane
  • Lobster cream
  • Lox
  • Red velvet
  • Toasted coconut

Those are by no means the only fall and winter flavors that will appeal to your guests. However, Datassential identifies them as top fall and winter flavors.

Something to think about when finalizing your winter LTO food and beverage menus.

Another thing to think about? Updating your listings to include holiday hours, LTOs, and other menu changes.

Image: Ryan Wallace on Unsplash

by David Klemt David Klemt No Comments

Global Cuisine Performance

Global Cuisine Performance

by David Klemt

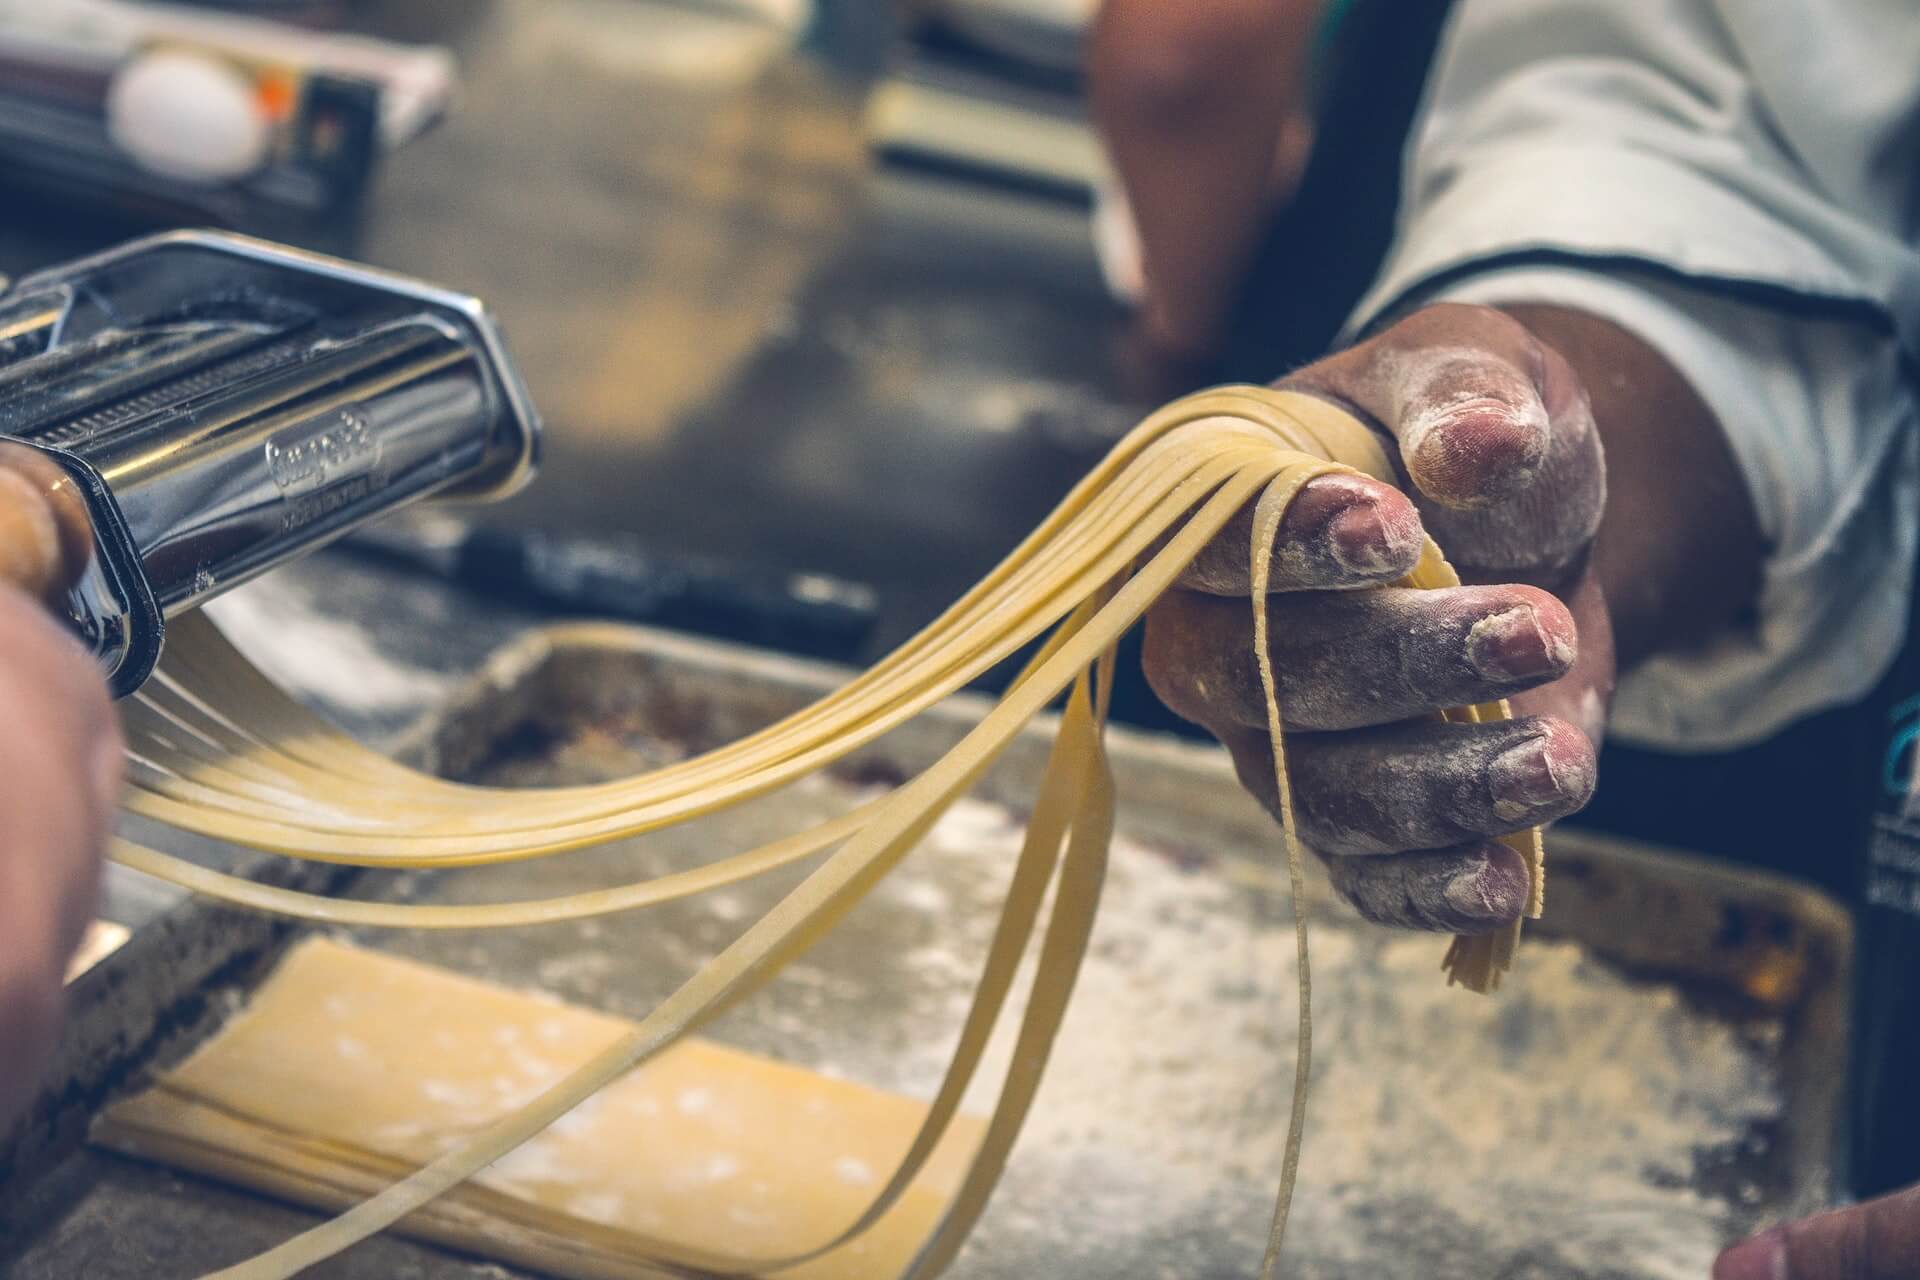
Cook making handmade pasta noodles

We don’t have a crystal ball to help us see which cuisines will be most popular. Obviously, the same holds true for knowing which are just now getting recognition.

However, we do have the next-best thing: data from Datassential.

Recently, the food and beverage analytics firm ranked dozens of global cuisines according to their current state of popularity among diners.

Then, they shared that information in October during their “Around the World in 80 Trends” webinar.

“Ubiquity”

When analyzing food and beverage trends, Datassential funnels them into four distinct designations: Inception, Adoption, Proliferation, and Ubiquity.

Arguably, once a trend reaches Proliferation and Ubiquity it becomes a mainstay. So, we can more than likely stop referring to it as a trend.

Now, the two most precarious stages for a trend are Inception and Adoption. Plenty of trends die on the Inception vine. Several won’t make it out of Adoption.

When you see Datassential’s list of global cuisines that fly under the Ubiquity banner, I doubt there will be much surprise:

  • Italian
  • Southern
  • Mexican
  • Creole/Cajun
  • Tex Mex
  • Chinese

So, any shocks to your system there? Most likely not.

“Proliferation”

Another to label this Datassential designation is “second most popular.” Each of these cuisines has a clear shot at reaching Ubiquity.

In fact, I find one of the global cuisines in this category surprising. It’s the first one in this list:

  • Japanese
  • Regional Italian
  • Regional Mexican
  • Greek
  • Mediterranean
  • Regional US
  • Southwestern
  • Cuban

As you’ll see, the lists grow longer steadily as we move down from Ubiquity.

“Adoption”

For me, it’ll be interesting to review follow-up data from Datassential regarding global cuisines.

As such, I’m eager to learn which cuisine from the list below reaches Proliferation in 2022:

  • Caribbean
  • Indian
  • French
  • Regional Chinese
  • Oaxacan
  • German
  • Middle Eastern
  • Korean
  • Ashkenazi
  • Hawaiian
  • Vietnamese
  • Venezuelan
  • Spanish
  • Sicilian
  • Jamaican
  • Israeli
  • Thai
  • British

To be honest, my first reaction to seeing French cuisine under the Adoption banner was surprise. Of course, I then thought back to how many French restaurants we have here in Las Vegas.

Sure, this little city in the desert is a foodie destination. However, French restaurants don’t dot the landscape like those that focus on other cuisines.

“Inception”

That brings us to the first stage of any trend: Inception.

Now, the first thing you’ll notice is that this category contains the most global cuisines. Whereas Adoption features 18, Proliferation lists eight, and a mere six have reached Ubiquity, Inception identifies two dozen.

They are as follows:

  • Brazilian
  • Mizrahi
  • Russian
  • Malaysian
  • Croatian
  • Moroccan
  • Lebanese
  • South African
  • Native American
  • Central American
  • Argentinian
  • Peruvian
  • Filipino
  • Appalachian
  • Sephardic
  • Ethiopian
  • Senegalese
  • Scandinavian
  • Sonoran
  • Nigerian
  • Iranian
  • Persian
  • Turkish
  • Polish

Again, there are some surprises here, at least for me. For example, I expected Ethiopian cuisine to have reached Adoption by now.

Takeaways

Of course, there are multiple ways to interpret this data.

First, you can embrace Ubiquity, leveraging their incredible popularity. However, standing out and building traffic will be challenging.

Second, you can feature Proliferation cuisine. Sure, these have yet to reach the Ubiquity stage. But they’re close to doing so, and you’ll also face stiff competition.

Third, focusing on cuisine from the Adoption designation involves taking a risk but mitigating it somewhat. These cuisines are developing a following and guest demand.

Finally, the riskiest move, depending on location: featuring Inception cuisines. But with risk comes reward. Identify a gap in a certain area—something we can do with our signature feasibility studies—and you may realize staggering success.

So, what do you think? Did you find any of Datassential’s designations surprising for certain cuisines? Let us know on our Instagram, Facebook, Twitter or LinkedIn pages!

Image: Jorge Zapata on Unsplash

by David Klemt David Klemt No Comments

Things Looking Up For December

Things Looking Up For December

by David Klemt

Friends toasting with Champagne outside during the winter

Food and beverage research and analytics firm Datassential’s end-of-year insights point to a positive outlook for restaurants in December.

While many consumers still have reservations about spending time in public, others are eager to return to “normal.”

Restaurants and bars are expected to play an important role in reaching normalcy this holiday season.

Let’s take a look at Datassential’s 2021 Holiday Issue statistics.

Hesitancy Waning?

Let’s get the less-promising data out of the way first. Some consumers still find the idea of in-person restaurant visits uncomfortable.

Nearly half of Boomers surveyed by Datassential (46 percent) said they’re “significantly less likely” to visit a fast-casual or fast-food restaurant in December.

And, interestingly, 42 percent of men gave the same answer for visiting traditional sit-down restaurants.

However, of all the in-person options presented to participants by Datassential, restaurants performed the best.

More than half of all respondents—men, women, Gen Z, Millennials, Gen X, Boomers—plan to visit fast-casual, fast-food, and sit-down restaurants more in December than they have in recent months.

It’s most likely that anticipation for restaurant visits is driven by the desire to gather and celebrate the holidays.

Overall, 57 percent of respondents plan to visit fast-casual and fast-food restaurants more. And 47 percent expect to visit sit-down restaurants more.

That makes those two options the top answers.

Only 16 percent of respondents indicated they don’t plan on visiting any on-site foodservice venues.

Regarding bars, sports bars, lounges, and nightclubs, men are “significantly more likely” (23 percent) to visit those types of venues in December.

Holiday Opportunity

According to Datassential’s report, the opportunity for holiday bookings is out there.

More than likely, gatherings will simply be smaller than they were prior to the pandemic.

Asked about plans to gather at restaurants in December, get-togethers are expected to be “moderately sized.”

Almost half of survey respondents (44 percent) plan on gathering at restaurants in parties of seven to twelve.

Just over a quarter (29 percent) plan on get-togethers of six or fewer of people. Only 18 percent of respondents are planning large (13 to 18 people) gatherings at restaurants in December.

As far as parties of 19 or more, just nine percent of respondents plan “very large” gatherings.

Of course, individual operations’ results will vary. However, this information gives us an idea of what traffic may look like for many operators.

2021 Spending

This is where the news looks even better for restaurants, bars and nightclubs in December.

When asked about spending money on going out to eat and for drinks, just 18 percent of respondents said they planned to spend less this year than in 2020.

Very nearly half (49 percent) plan to spend the same as they did last year. However, 32 percent said they think they’ll increase their spending.

When it comes to New Year’s Eve, the numbers shift a bit. However, 50 percent of respondents plan to spend the same on NYE in 2021 as they did in 2020.

Twenty-six percent plan to spend more on NYE in 2021. Just 24 percent plan to spend less this year on NYE.

Per Datassential, Millennials are most likely to splash out for NYE this year.

So, things won’t be returning to pre-pandemic normalcy by 2021’s end. However, if Datassentials findings prove accurate, things are looking healthier for December.

Image: Christine Jou on Unsplash

by David Klemt David Klemt No Comments

Thanksgiving Eve by the Numbers

Thanksgiving Eve by the Numbers

by David Klemt

Two shot glasses garnished with salt rim and lemon wedges

Tonight, guests will be looking to celebrate a bar holiday that’s traditionally lucrative for operators: Thanksgiving Eve, a.k.a. Drinksgiving.

It’s difficult to imagine that any operator or hospitality worker is unaware of Thanksgiving Eve’s status.

Sure, some mark the start of end-of-year celebrations with Halloween or Thanksgiving. However, I feel Thanksgiving Eve truly ushers in the holiday season.

I’d also argue that while retailers have Black Friday and Cyber Monday, operators have the night before Thanksgiving. Yes, New Year’s Eve is also huge, but Thanksgiving Eve is considered the busiest night of the year for bars.

Interestingly, this is a holiday that benefits bars across the nation. In fact, it’s not exclusive to destination cities.

After all, the reason it’s so big, traditionally, is that people are traveling back to their hometowns. And while Thanksgiving is for their families, Thanksgiving Eve is for catching up with childhood and high school friends.

Obviously, there are fantastic bars located in cities outside of their destination counterparts. Hot take, I know.

So, does Thanksgiving Eve deserve its hype ?

The Evidence

Unfortunately, data from 2020 isn’t readily available, for obvious reasons.

However, we do have some data, largely thanks to restaurant management and POS platform Upserve.

One of the simplest ways to analyze Thanksgiving Eve’s impact is to compare it to the previous Wednesday.

Per Upserve, guest counts rose 23 percent in 2018 when compared to the Wednesday prior to Thanksgiving Eve.

Looking at data from more than 10,000 restaurants and bars, Upserve found that guest count totaled 496,883 on November 14, 2018. One week later, that number rose to 643,637.

As Upserve content marketing coordinator Stephanie Resendes says in her Thanksgiving Eve article, “More people = more money.”

Of the 10,000-plus Upserve clients whose data was analyzed, net sales were $17.250 million on the Wednesday preceding Thanksgiving Eve 2018. That number jumped to $22.296 million.

So, looking just at a relatively small sample size from 2018, Thanksgiving Eve’s impact doesn’t seem overblown.

The Drinks

According to Upserve, beer was the year-over-year winner through 2018. It saw the most growth by far on Thanksgiving Eve 2018 when compared to the Wednesday prior and the same period in 2017.

Spirits and wine, at least for Thanksgiving Eve 2018, were nearly tied for second place.

Now, looking at the data for Thanksgiving Eve 2019, spirits saw the most growth overall. Resendes shared that shot sales increased 173 percent on Thanksgiving Eve 2019 when compared to the Wednesday prior.

Tequila led the charge for spirits, rising 156 percent. Vodka saw a 144-percent boost, rum increased 120 percent, whiskey went up 65 percent, and gin saw a lift of 47 percent. For its part, beer sales rose 65 percent.

Not content to simply look at traffic and sales numbers, Upserve also split their clients into four regions. In this way, they identified who parties hardest on Thanksgiving Eve and who needs to ramp things up.

The four regions and their net sales growth from Thanksgiving Eve 2019 compared to the Wednesday prior are below:

  • Midwest: 34 percent
  • Northeast: 34 percent
  • South: 33 percent
  • West: 22 percent

Clearly, there was still growth in the Western region. However, the Midwest and Northeast led the way, with the South just behind them.

We’ll have to wait to see how Thanksgiving Eve 2021 plays out. We’re still waiting on the numbers from 2020. However, Upserve’s data shows that Thanksgiving Eve remains crucial to restaurants and bars throughout America.

Image: Alena Plotnikova on Unsplash

by David Klemt David Klemt No Comments

Sales Jump Shows Guests Will Pay More

Chipotle Sales Jump Shows Guests Will Pay More

by David Klemt

Close up of calculator buttons

Chipotle’s latest earnings report may show that guests are willing to pay more at their favorite restaurants.

In Q3, the fast-casual giant’s net sales grew by nearly 22 percent. Per reports, same-store sales rose by just over 15 percent.

Is it possible that Chipotle’s earnings—which exceeded Wall Street estimates—indicate that guests will tolerate price hikes?

Rising Costs

No, it’s not a “hot take” to state the obvious: Everything is more expensive.

All operators and managers are aware that costs are rising across the board. Beef, chicken wings, cooking oils… Prices are increasing and the trend is expected to continue.

Not that any of us need a real-world example, but Chef Brian Duffy shared on episode 53 of the Bar Hacks episode that he now has to price a pound of chicken wings at $13.

One reason that Chipotle made the choice to raise prices comes down to rising beef prices. Another is increased freight costs.

As every armchair economist knows, when a business’ costs rise that increase falls on its customers.

The reason is fairly simple: If prices remain the same while costs rise, the situation becomes untenable, the business doesn’t generate enough revenue, and doors close.

So, Chipotle’s decision was simple. The fast-casual chain announced in June that menu prices would increase by about four percent to defray rising costs.

Rising Wages

Chipotle’s June announcement followed one the company made in May.

Six months ago, Chipotle announced the hourly wage for their restaurant workers would increase to $15 by June.

How did the company afford to raise hourly wages, offset ingredient costs, and deal with rising freight rates? The aforementioned menu price hike.

Now, Wall Street didn’t seem to anticipate backlash toward Chipotle for increasing their prices. However, plenty of other people have said—and still say—that customers won’t support restaurants or bars that raise prices.

It appears that a significant percentage of brand-loyal customers will remain loyal and continue to support the businesses they like even through price hikes.

Is This the Way?

I’ll address a crucial detail: Chipotle is a fast-casual brand valued at close to $52 billion.

They’ve got incredible brand recognition and tremendous purchasing power. Reportedly, there are 2,857 Chipotle locations in the United States. In fact, the company announced in February of this year that it planned to open 200 more locations this year.

So, no, there’s not a direct comparison to be made between Chipotle and an independent restaurant or bar.

However, that doesn’t mean there’s no lesson to be learned here.

Chipotle was transparent about the reasons for their price hikes. The Great Resignation has shined a spotlight on wages, and Chipotle addressed that concern.

The pandemic has also unleashed havoc on supply chains. Again, Chipotle was forthcoming about the challenges the company was facing.

Moving forward, it may be wise for restaurant and bar owners to address menu price increases. There does seem to be some level of understanding among the more rational guests out there that if they support increased wages for hospitality workers; understand supply chain challenges; and know costs are up for everything, they’re going to see price hikes.

You very likely need to raise at least some of your prices. When you do so, consider telling your guests why. You may be surprised by the support you receive.

Image: fancycrave1 from Pixabay

by David Klemt David Klemt No Comments

Canadian On-premise Sales Stabilizing

Canadian On-premise Sales Stabilizing

by David Klemt

Canadian flag in downtown Toronto, Ontario, Canada

A report from Restaurants Canada and Nielsen CGA shows that on-premise sales are steadying and, in some provinces, growing.

In fact, with the exception of Alberta being slightly down, Canada’s nationwide sales velocity looks promising in comparison to 2019.

Overall, Canada’s on-premise velocity is on the rise. Let’s take a look at how the three main provinces KRG Hospitality services are performing.

Alberta

To say that Alberta is down is a tad misleading. The province’s performance is nearly on par with 2019.

In comparison to 2019, Alberta is just -1 percent below in velocity levels.

Now, in comparison to 2020, the province is +46 percent. However, 2019 is a far more accurate gauge of performance.

While being down one percent is on the surface negative, growth in Calgary and Edmonton is highly encouraging.

In the week to August 21, Calgary’s velocity rose +4 percent, while Edmonton grew +10 percent. Those two cities are responsible for overall growth in velocity in Alberta of +4 percent.

Should the upward trend continue, Alberta will match and surpass 2019 quickly.

British Columbia

Of the three key provinces in which KRG Hospitality operates, BC is the second-best performing in comparison to 2019. Against 2020, BC is the third top performer.

Per Restaurants Canada and CGA, BC velocity is up +12 percent in comparison with 2019’s sales. The province is up +33 percent when compared to 2020.

In Vancouver, velocity is flat rather than experiencing negative growth. Any negative trends, according to the Restaurants Canada and CGA report, is coming from Victoria. That city is down -6 percent.

Ontario

Of our key Canadian markets, Ontario is performing the best overall.

Compare velocity to 2020 and the province is up +48 percent. In comparison to 2019, Ontario’s velocity is up +13 percent.

One can attribute current growth to Toronto. The Ontario city’s performance in the week to August 21 is +4 percent.

Canada

According to the report, sales velocity in Canada is up +2 percent overall.

Compare the country’s overall performance against 2020 and 2019, and Canada is trending upward. The nation’s on-premise velocity is up +41 percent in comparison to 2020 and +11 percent against 2019.

Clearly, the expectation is for the country’s on-premise performance to experience further growth as consumers return to in-person dining and restrictions loosen.

However, it’s important for operators to not simply return to pre-pandemic operations. Consumer behaviors have changed and many pandemic-driven habits—delivery, for example—are now permanent.

Further, now’s the time for those considering proceeding with plans to open restaurants, bars and hotels to move forward. In fact, Travis Tober, the guest from our milestone 50th episode of Bar Hacks, believes there’s no better time than now to open a hospitality venue.

Image: Lewis Parsons on Unsplash

by David Klemt David Klemt No Comments

Consumers May Keep Eating at Home

Consumers May Keep Eating at Home

by David Klemt

Friends and family around a dinner table at home

A recent report suggests that consumer interest in eating at home more will continue even after we return to “normal.”

This is the finding from a survey conducted by the Food Industry Association (FMI)l, formerly known as the Food Marketing Institute.

The FMI surveyed grocery shoppers to determine habits influenced by the pandemic.

Emphasis on Nutrition

I look to a wide variety of sources to analyze consumer behavior. Even their grocery habits can be valuable for operators to know.

In this case, knowing about the dining habits of today’s consumer provides important insights. For instance, knowing what types of food items shoppers are purchasing can be very telling.

Per the FMI, nearly half of survey respondents (49 percent) indicate they’re choosing healthier foods when grocery shopping. Clearly, living through a public health crisis is influencing this decision.

Today’s consumer, with more information at their fingertips and the purchasing power to demand more transparency from company’s, has become increasingly focused on their health. That interest grew stronger during the pandemic as a healthier lifestyle can lead to a reduced risk for illness.

This particular finding should tell operators a few things. First, they may want to consider updating their menus with healthier items. Second, that’s not limited to food—many guests are interested in no- and low-ABV drinks. Third, operators who use healthier ingredients should make that clear via their menu item descriptions.

At-home Dining

The FMI also found that 41 percent of survey respondents plan to prepare and enjoy more meals at home moving forward than they did before the pandemic.

That ties directly to 44 percent saying they “like” or ‘love” cooking at home more now.

While this survey was intended to provide consumer behavior insights for grocers, there’s clearly value for operators.

As many learned during the pandemic, guests are interested in supporting restaurants and bars buy ordering meal and cocktail kits.

Since it’s important to meet guests where they are, operators may want to keep such kits on offer. People have shown they’re eager to engage with restaurants and bars via virtual tastings and cooking classes. Clearly, many are also happy to order meal kits from restaurants to make in the comfort of their own homes.

Yes, there’s pent-up demand set to be unleashed. And yes, people are eager to get back out there and socialize. But there are also financial, health, and safety concerns that will keep some people from dining out as often as they did pre-pandemic.

That doesn’t mean they’re out of reach of restaurants and bars entirely. However, it does mean operators will need to adapt and get creative to earn their business.

Image: fauxels from Pexels

Top