Chain restaurant

by David Klemt David Klemt No Comments

2024 Datassential 500: Guest Perception

2024 Datassential 500: Guest Perception

by David Klemt

An optical illusion consisting of black and white stripes that may be curving upward and outward

Last week we took a look at the data-driven findings that identify, organize, and rank chain restaurants in the US, forming the Datassential 500.

This annual report sorts the 500 top-performing chains by segment. Further, Datassential identifies the top chains by both number of units, and sales.

In doing so, the F&B intelligence agency uses hard numbers to determine numbers one through 500.

But what about guest perception? Unit and sales growth may appeal to board members, investors, executives, and other hospitality professionals, but what matters to the people their restaurants serve?

It’s doubtful that even the staunchest fans of a particular restaurant chain are aware of or, frankly, care about how many locations they operate. Nor are they likely all that concerned about their annual revenue, unless they’re an investor as well.

To get to the bottom of how the public perceives chain restaurants in the US, and what brands they rank at the top, Datassential looked at six key metrics.

Those metrics? Food quality, service, experience, affordability, value for dollar, and net promoter score.

While the results aren’t exactly shocking, they’re quite telling. A handful of US chains dominate the consumer-facing metrics. And for the most part, they’re not among the top ten of the 2024 Datassential 500.

Anyone interested in reading this year’s report can do so via this link. Alright, let’s check out how the public ranks US chain restaurants.

Perception Matters

To make the comparisons easier, the top 10 US restaurant chains by unit and by sales are below.

Top 10: Total Units

  1. Subway
  2. Starbucks
  3. McDonald’s
  4. Dunkin’
  5. Taco Bell
  6. Domino’s Pizza
  7. Burger King
  8. Pizza Hut
  9. Wendy’s
  10. Dairy Queen

Top 10: Total Sales

  1. McDonald’s
  2. Starbucks
  3. Chick-fil-A
  4. Taco Bell
  5. Wendy’s
  6. Dunkin’
  7. Burger King
  8. Chipotle
  9. Subway
  10. Domino’s Pizza

Guest Perception

Okay, so those are the top performers in the US, by the numbers. Units were counted, sales were analyzed.

Now, these are the brands that guests feel are at the very top, organized into six categories.

Food Quality

  1. Texas Roadhouse
  2. Chick-fil-A
  3. Longhorn Steakhouse
  4. Cheesecake Factory
  5. Ruth’s Chris Steak House

Service

  1. Chick-fil-A
  2. Texas Roadhouse
  3. Longhorn Steakhouse
  4. Cheesecake Factory
  5. In-N-Out Burger

Experience

  1. Chick-fil-A
  2. Ruth’s Chris Steak House
  3. Texas Roadhouse
  4. Maggiano’s Little Italy
  5. In-N-Out Burger

Affordability

  1. Little Caesars
  2. Freshii
  3. Papa Murphy’s
  4. Cici’s Pizza
  5. Pollo Tropical

Value for Dollar

  1. Papa Murphy’s
  2. Little Caesars
  3. Cici’s Pizza
  4. In-N-Out Burger
  5. Del Taco

Net Promoter Score

To determine this ranking, survey participants were asked “How likely would you be to recommend this chain to friends and family?”

  1. Chick-fil-A
  2. Texas Roadhouse
  3. In-N-Out Burger
  4. Longhorn Steakhouse
  5. Portillo’s Hot Dogs
  6. Cheesecake Factory
  7. The Capital Grille
  8. Ruth’s Chris Steak House
  9. Maggiano’s Little Italy
  10. Topgolf

Subway and McDonald’s may dominate the list in terms of number of units and annual sales, but Chick-fil-A dominates in one key area. Word-of-mouth marketing still matters, undeniably, and, according to Datassential, most consumers perceive Chick-fil-A as the restaurant chain to recommend.

Followed by Texas Roadhouse and In-N-Out Burger, smaller brands are delivering on important operational elements. Consumers at large appear to favor these brands when it comes to stretching their dollars, along with how they perceive the quality of food, the level of service, and the overall dining experience.

Operators interested in scaling their business need to set aside ego and desire, and look at their business objectively. They need to ensure they’re nailing the fundamentals and have the right systems in place first.

Image: BP Miller on Unsplash

KRG Hospitality Contact Request for Proposal 30 Minute Discovery Session

Book Below to Setup a 30-Minute Complimentary Discovery Call and Request for Proposal.


by David Klemt David Klemt No Comments

The 2024 Datassential 500

How Does the 2024 Datassential 500 Shake Out?

by David Klemt

Stainless steel address numbers spelling out the number 500

The annual Datassential 500 ranking is a valuable report that identifies industry leaders, the fastest growers, and segment performance.

Further, this yearly report shows the scale of restaurant business in the US. In a word, it’s gargantuan.

Looking at 2023 data, the top 500 chains in the US operated 238,152 units. And those 238,000-plus restaurants generated $417.13 billion in 2023.

For the former, that’s growth of 2.1 percent in comparison to 2022. And for the latter, the top 500 grew by 7.5 percent compared to last year.

Those numbers are from just 500 chains; the report doesn’t take into account other chains or independent operators. When we add all dining and drinking establishments in the US, the industry generated $1.09 trillion in 2023.

Again, the US restaurant business is a colossus.

Perhaps unsurprisingly, limited-service and quick-service restaurants are the top-performing segments by unit within the Datassential 500. In 2023, the LSR segment consisted of 212,469, and unit growth was up by 2.3 percent. The QSR segment reached 170,241, representing unit growth of 1.9 percent.

In fact, every segment but one saw unit growth in 2023. One may assume the segment that slipped was fine dining. That’s usually a safe bet, but the segment actually saw the most growth. It was midscale restaurants that suffered a bit of a blow, shrinking by 0.1 percent.

That means that LSRs, QSRs, full-service restaurants (FSRs), fast casual, casual dining, and fine dining all grew. Further, that growth ranged from 0.3 percent (FSR) to 4.6 percent (fine dining).

There are many more insights, so I encourage anyone interested to download the report for themselves.

Segment Shakedown

Before we jump into the top US chains, let’s take a look at how the categories break down.

Type of Cuisine

  • American: 88
  • Pizza: 70
  • Desserts & Snacks: 69
  • Sandwich: 47
  • Coffee: 47
  • Burger: 37
  • Mexican: 36
  • Salad & Healthy: 31
  • Southern: 24
  • Asian: 22
  • BBQ: 12
  • Steakhouse: 11
  • Italian: 9
  • Seafood: 9
  • Greek & Mediterranean: 9

Growth by Segment: Unit (LSR)

  • Salad/Healthy: +11.2%
  • Coffee: +5.9%
  • Other: +4.6%
  • Dessert/Snack: +4.3%
  • Mexican: +3.0%
  • Chicken: +2.9%
  • Pizza: +1.6%
  • Bakery-Cafe: +0.8%
  • Sandwich: -0.4%
  • Burger: -0.4%

As we can see, Salad/Healthy LSRs saw almost double the growth by unit than the next-largest segment, Coffee.

Further, Sandwich and Burger shrunk slightly.

Growth by Segment: Unit (FSR)

  • Regional/Ethnic: +7.6%
  • Sports Bar: +3.8%
  • Midscale: +0.3%
  • Seafood/Steak: +0.1%
  • Italian/Pizza: -0.9%
  • American: -2.0%

Regional and ethnic full-size restaurants saw the most growth. In fact, they grew by twice the amount of sports bars, and several times more than midscale FSRs.

Growth by Segment: Sales

  • Limited-Service Restaurant: $338.18 billion (+8.1%)
  • Quick-Service Restaurant: $263.48 billion (+8.0%)
  • Full-Service Restaurant: $78.95 billion (+5.0%)
  • Fast-Casual Restaurant: $74.70 billion (+8.6%)
  • Casual-Dining Restaurant: $55.57 billion (+4.8%)
  • Midscale Restaurant: $20.05 billion (+4.5%)
  • Fine-Dining Restaurant: $3.33 billion (+10.7%)

The good news is that every segment saw sales growth in 2022, with Fine Dining and Fast Casual experiencing the biggest increases.

Of course, that’s relative. Fine Dining generated just $3.33 billion in comparison to LSRs, which generated more than $338 billion.

Still, positive growth is always great to see.

Growth by Segment: Sales (LSR)

  • Salad/Healthy: +17.0%
  • Chicken: +11.9%
  • Dessert/Snack: +10.1%
  • Coffee: +9.8%
  • Other: +9.3%
  • Mexican: +9.1%
  • Burger: +7.5%
  • Sandwich: +7.2%
  • Bakery-Cafe: +1.8%
  • Pizza: +1.6%

Not only did Salad/Healthy lead the way in LSR unit growth in 2023, it’s the top performer in terms of sales.

Again, the good news is that the Datassential 500 saw LSR sales growth across the board.

Growth by Segment: Sales (FSR)

  • Regional/Ethnic: +10.2%
  • Seafood/Steak: +6.7%
  • Midscale: +5.2%
  • Italian/Pizza: +4.2%
  • American: +3.8%
  • Sports Bar: +3.2%

As far as FSR performance, every segment experienced growth, with Regional/Ethnic leading the charge.

The Top 5(00)

So, which US chains are at the top? Well, an accurate answer depends on segment, number of units, and sales.

Oh, and it also depends on whether we’re talking about which chains Datassential have identified as industry leaders, and which are the fastest growers.

Industry Leaders

According to Datassential, the top five US chains by number of stores are Subway (20,133), Starbucks (16,346), McDonald’s (13,449), Dunkin’ (9,580), and Taco Bell (7,405).

However, that ranking changes a bit when we look at through the lens of sales. In that case, the top five are McDonald’s ($52.91 billion), Starbucks ($29.98 billion), Chick-fil-A ($21.58 billion), Taco Bell ($13.95 billion), and Wendy’s ($12.29 billion).

Those are the industry stalwarts. How do the fastest-growing US chains stack up?

Fastest Growers

Looking at unit growth over the span of one year, the top performers in the US are 7 Brew (+373.7 percent), The Peach Cobbler Factory (+358.3 percent), Hangry Joe’s Hot Chicken (+281.8 percent), KPOT Korean BBQ & Hot Pot (+275.0 percent), and Foxtail Coffee Co (+176.2 percent).

Switching gears to sales growth over a single year, Hangry Joe’s Hot Chicken led the way, growing by more than 500 percent. Hangry Joe’s is followed by The Peach Cobbler Factory (+332.5% percent), Nick The Greek (+304.7 percent), 7 Brew (+267.3 percent), and Pizza King Inc (+264.7 percent).

However, Datassential gets more granular in their 2024 report, breaking down the top five across multiple segments.

Top Ranked By Unit (Overall)

Top 5: Quick Service

  1. Subway
  2. McDonald’s
  3. Dunkin’
  4. Taco Bell
  5. Domino’s Pizza

Top 5: Fast Casual

  1. Starbucks
  2. Chipotle
  3. Panera Bread
  4. Wingstop
  5. Tropical Smoothie Cafe

Top 5: Midscale

  1. Waffle House
  2. IHOP
  3. Denny’s
  4. Cracker Barrel
  5. First Watch

Top 5: Casual & Fine Dining

  1. Applebee’s
  2. Buffalo Wild Wings
  3. Chili’s
  4. Olive Garden
  5. Outback

Top Ranked By Unit (Growth)

Top 5: Quick Service

  1. 7 Brew
  2. The Peach Cobbler Factory
  3. Foxtail Coffee Co
  4. Cupbop
  5. Swig

Top 5: Fast Casual

  1. Hangry Joes Hot Chicken
  2. Just Love Coffee Cafe
  3. The Great Greek Mediterranean Grill
  4. Nautical Bowls
  5. Ellianos Coffee Co

Top 5: Midscale

  1. Snooze Restaurant
  2. Eggs Up Grill
  3. Kura Sushi Bar
  4. Another Broken Egg Cafe
  5. Maple Street Biscuit Co.

Top 5: Casual & Fine Dining

  1. KPOT Korean BBQ & Hot Pot
  2. Topgolf
  3. The Juicy Crab
  4. Jinya Ramen Bar
  5. Hopdoddy Burger Bar

There are many more insights to be had, so please consider downloading your own copy of the 2024 Datassential 500 report here.

Image: Thiago Giardini via Pexels

KRG Hospitality Contact 60-Minute Impact Session

Looking to Start, Stabilize, or Scale? Book Below to Setup a 60-Minute Result-Driven Impact Session.


by David Klemt David Klemt No Comments

The Top 10 Restaurant Chains in 2023

Check Out the Top 10 Restaurant Chains by Sales in 2023

by David Klemt

Pop art image of a giant money bag wrapped in golden chains looming over a city skyline

Well, I asked for an image of a giant money bag wrapped in golden chains, looming over a city skyline. Nailed it, AI.

Technomic data reveal the top-performing restaurant chains in the United States of America by sales volume in 2023, and number one won’t be a surprise.

For a bit of context and history, Technomic has been ranking the top chain restaurants in the US since 1978. And, according to reporting, the same chain has held the number-one spot every year.

Feel free to take a moment and make your guess as to which chain continues to lead all others each year.

Alright, if you guessed McDonald’s, congratulations.

Not only is McDonald’s the largest chain in the US by sales, the company outperformed the rest of the list by a significant margin. In 2023, McDonald’s generated more than $53 billion in sales via more than 13,450 units.

That’s nearly $20 billion more in sales than the chain that clinches the number-two spot. Going deeper, that’s more than double the sales of the number-three restaurant chain. In fact, McDonald’s generated just a $100 million dollars less than the sales of the second- and third-biggest chains combined.

Coming in at number two is Starbucks, achieving sales of $31.6 billion in the US from 16,466 units. Number three is Chik-fil-A, seeing $21.6 billion in sales through 2,964 stores.

The Top 10 Chain Restaurants in the US

Below, the full list of the ten top-performing restaurant chains in the US.

Perhaps unsurprisingly, quick- and limited-service restaurants account for the entirety of the top-ten list.

Notably, each of the ten chains saw sales growth last year, though that growth fluctuates from chain to chain. Some, like Chipotle, increased sales by more than 15 percent. For others, like Subway, growth was just over two percent.

Further, just two of the top-ten chains shuttered locations in 2023. Last year, Burger King reduced its US footprint by almost four percent. Likewise, Subway shrunk by two percent.

Judging by the sales numbers, closing stores last year may have proven to be a smart business decision for Burger King and Subway.

  1. Domino’s: $9 billion (up 3.1 percent)
  2. Chipotle: $9.9 billion (up 15.3 percent)
  3. Subway: $10 billion (up 2.1 percent)
  4. Burger King: $11 billion (up 6.6 percent)
  5. Dunkin’: $11.9 billion (up 5.7 percent)
  6. Wendy’s: $12.3 billion (up 5.1 percent)
  7. Taco Bell: $15 billion (up 8.2 percent)
  8. Chik-fil-A: $21.6 billion (up 14.7 percent)
  9. Starbucks: $31.6 billion (up 12.5 percent)
  10. McDonald’s: $53.1 billion (up nine percent)

Ending on one more interesting revelation, one chain moved up the list. Bear in mind, this is no small feat.

Domino’s, once number nine on the list, was passed by Chipotle in sales last year. We’ll see if anything changes when Technomic reveals next year’s rankings.

Image: Shutterstock. Disclaimer: This image was generated by an Artificial Intelligence (AI) system.

KRG Hospitality Start-Up Restaurant Bar Hotel Consulting Consultant Solutions Plans Services

by David Klemt David Klemt No Comments

2023 State of the Menu: Datassential

2023 State of the Menu: Datassential

by David Klemt

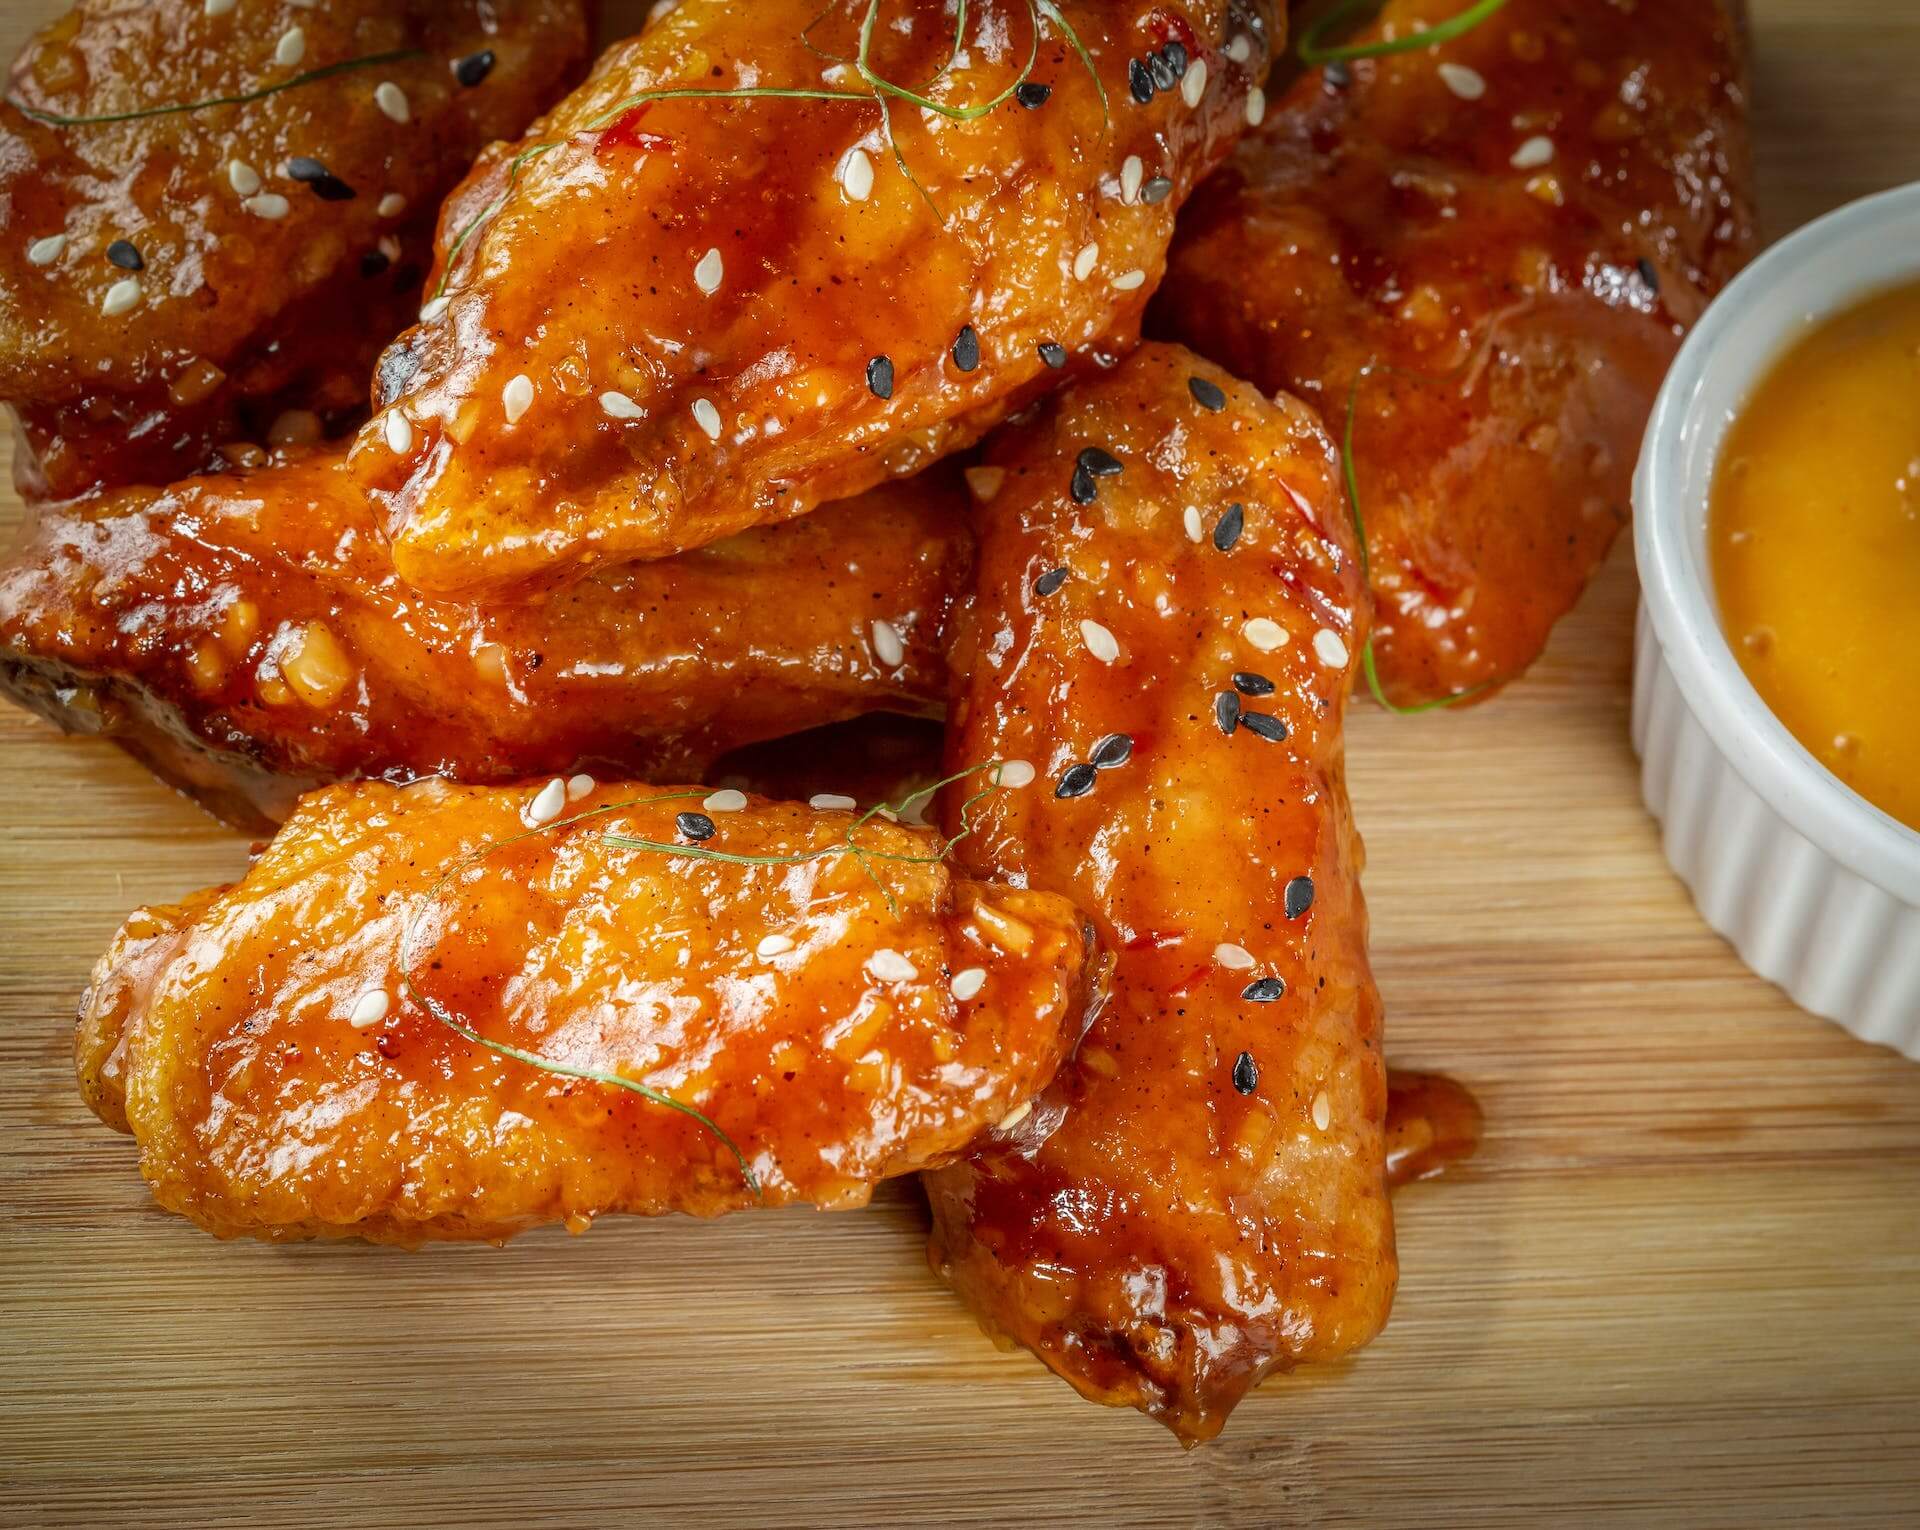
Korean fried chicken wings

The annual 2023 State of the Menu by Datassential includes an interesting metric to gauge restaurant recovery: menu size by segment.

Hosts Jack Li, Mike Kostyo, and Claire Conaghan discuss a handful of topics during this webinar. Host Li touches on food-forward cities at the beginning of this presentaiton. Kostyo shares some of the most innovative menu items out there right now. And Conaghan dives deep into menu trends.

Industry professionals interested in watching this webinar on demand can register to do so here.

There are a handful of metrics people are using to measure post-pandemic restaurant recovery. Labor is, of course, receiving a lot of attention. People are also tracking traffic, average check size, revenue, and profits.

One metric Datassential is keeping tabs on is menu size per restaurant segment. Additionally, they’re tracking each segment’s top-growing food and beverage items.

Notably, however, in tracking menu size, Conaghan focuses solely on food and non-alcohol beverage items, omitting catering and alcohol.

Chains vs. Independents

Starting things off, Conaghan addresses the overall menu size trend. That is, menus are noticeably smaller in comparison to pre-pandemic sizes.

Interestingly, chain restaurants don’t appear to be in any rush to move away from this trend. In fact, Conaghan notes that chains appear to be further reducing the size of their menus. This has been the trend over the past 12 months.

According to Conaghan, fine dining also seems to be happy to shrink their menus. Menu size shrunk the most among restaurants in this segment. In comparison, quick-service menu sizes decreased the least.

However, independent restaurant operators appear to be going in the opposite direction from their chain counterparts. In contrast, indies have been growing the size of their menus the past 12 months.

Menu Size by Segment

Fast Casual

Per Conaghan, the only segment to reach pre-pandemic menu size is fast casual. In fact, this category of restaurant is often exceeding pre-pandemic items-per-menu size.

This increase in menu size is attributable to operators “leaning into” core cuisine items. For example, sandwiches, Mexican entrees, and pizza.

However, the fastest-growing food item on fast-casual menus is the chicken wing. According to Conaghan, it’s easy for operators to innovate with chicken wings.

A restaurant doesn’t have chicken wings? All they have to do is add them, starting with simple preparations. If a restaurant does have chicken wings on the menu already, innovation is as simple as adding new flavors.

As far as the fastest-growing drink for fast-casual restaurants, it’s dessert beverages.

QSR, Casual Dining, and Midscale

These three segments are “very, very close” to reaching pre-pandemic menu sizes.

As midscale operators are likely very aware, this segment tends to have the largest menus. I wouldn’t be surprised, therefore, if a number of midscale concepts review their items per menu, their costs, and decide they can perform well with slightly smaller menus moving forward.

Unsurprisingly, chicken wings are the food item growing most quickly on QSR food menus. Oh, and barbecue chicken wings are the fastest-growing food item among casual dining restaurants.

Perhaps a bit more eyebrow-raising is the fastest-growing beverage type for QSRs: energy drinks. Boba and flavored iced teas are growing fastest on casual-dining drink menus.

For midscale restaurants, dessert samplers are the fastest-growing food items. Think “dessert charcuterie” when trying to picture a dessert platter. Another way to think about the dessert sampler is a static dessert cart with small bites of each dessert on the menu.

Fine Dining

Again, this segment is the furthest from pre-pandemic menu size. And, again, operators in this category seem happy with this trend.

An interesting note Conaghan makes about this segment is what many operators are using to fill out their menus: desserts. This is, she says, an area where fine dining can differentiate itself from other concepts.

Per Conaghan, bao, applesauce, and summer squash are growing the fastest on fine-dining food menus.

Now, I may have slipped into a fever dream during this portion of the Datassential webinar. Because unless I’m mistaken, the Shirley Temple has been identified as the fastest-growing beverage in the fine-dining space.

Pricing

Okay, so this segment of the 2023 State of the Menu webinar isn’t really a recovery metric.

However, it’s interesting, and something Jack Li says about chain restaurant pricing made me chuckle.

Most Expensive vs. Least Expensive

First, some straightforward data.

The following list identifies the five most-expensive ZIP codes for chain restaurant menu pricing. Anyone who wants the full list of 15 most-expensive ZIP codes can watch the webinar.

  • 10036 (New York, NY)
  • 96707 (Kapolei, HI)
  • 98902 (Yakima, WA)
  • 96815 (Honolulu, HI)
  • 99503 (Anchorage, AK)

It’s understandable to think this would consist entirely of New York City, Los Angeles, or San Francisco ZIPs. But when we consider what it costs operators to import food to Hawaii and Alaska. Additionally, Washington and New York are among the states with the highest minimum wage. Operators need to recover those costs somehow.

And now the five least-expensive ZIP codes:

  • 78526 (Brownsville, TX)
  • 75224 (Dallas, TX)
  • 76106 (Fort Worth, TX)
  • 31907 (Columbus, GA)
  • 31701 (Albany, GA)

Pricing Logic

Now, on to what Li says during the webinar that makes me laugh.

Nationwide, the average price of a McDonald’s Big Mac in the US is $5.26. (A caveat: This webinar took place in October. This price may have increased or decreased by now.)

However, the lowest price for a Big Mac is $3.49 at a location in Wilburton, Oklahoma.

So, what’s the highest price, and where can one find these pricey Big Macs? Three McDonald’s locations sell the burger for $8.29. That’s nearly two-and-a-half times the lowest-priced Big Mac.

Summarizing pricing variations among chain restaurants succinctly, Li made me laugh with the following: “Store pricing often just doesn’t make sense.”

Going further, Li says Datassential shows that the more franchised a restaurant chain is, the more variances in pricing will occur.

The full webinar can be viewed here.

Image: Leonardo Luz on Pexels

Bar Nightclub Pub Brewery Menu Development Drinks Food

by David Klemt David Klemt No Comments

New Review Platform Rejects Negativity

It’s Good: New Review Platform Rejects Negativity

by David Klemt

"Just be nice" sign on wall with graffiti

Combine equal parts incredible team of founders, love for food and travel, and respect for an expression that we should all adhere to more closely, and you get a new review platform.

The expression from which this team derives their platform’s ethos?

“If you don’t have something good to say, don’t say it at all.” But how can a review platform embody that age-old expression?

Well, it turns out that answer is rather simple: by refusing to allow negative reviews. That’s the foundation of how It’s Good plans to operate.

That is, of course, quite the departure from Yelp, Google Reviews, Tripadvisor, and other review platforms. In my experience, Yelp draws the ire of most operators. Obviously, it doesn’t help Yelp’s reputation among operators that people can review bomb a venue rather easily, among other issues.

On It’s Good, there’s no “star” ratings system. Negative comments? The platform is “not even built for” those, according to co-founder John Legend.

“Either you recommend [a place or experience] or you don’t,” says Legend, elaborating further on It’s Good.

The team of founders also includes Kevin Auerbach (who comes from Apple), Meghan Raab (from Snap), and director and photographer Mike Rosenthal.

With Auerbach and Raab guiding what is likely a top-notch engineering team, It’s Good should be simple and fun to use.

The User Experience

At the moment, It’s Good is an invite-only platform. According to articles online, Legend and Rosenthal have been working on the app for four years.

So, the initial idea is to lay the user foundation ahead of its public launch. Logical, since it would be challenging to sift through recommendations without a core user group populating the app first.

“Our mission is to be your go-to place for saving & sharing your most favorite places to eat and drink. Trustworthy recommendations for you, by you – from the people you know or admire, all in one beautiful space,” reads the waitlist confirmation email I received from Shirene Niksadat, It’s Good head of community.

Interestingly, one of the motivating factors behind this platform is Legend himself. Apparently, he’s a go-to source for recommendations amongst his friends.

“My friends always reach out to me for ‘my list’ of restaurants in the cities I’ve visited,” Legend is quoted as saying on the It’s Good website.

From what I can gather, the platform will allow people to find new restaurants, bars, and experiences via location-based and themed lists. I’m sure there’s more functionality, but the main takeaways are:

  • organized recommendations;
  • personalized recommendations from trusted sources and friends; and
  • recommendations that answer a simple question: Is this place or experience good?

“We believe a restaurant rec from 1 trusted friend is more valuable than recs from 10,000 strangers,” says the It’s Good site, right at the top.

That should give us all an idea of how this platform will operate, and what to expect when it goes live for the general public.

Obviously, I can’t provide a review of this review platform. But I can say that I’m looking forward to my opportunity to take it for a spin.

To get your name on the waitlist, click here.

Image: A A on Unsplash

KRG Hospitality Start-Up Restaurant Bar Hotel Consulting Consultant Solutions Plans Services

by David Klemt David Klemt No Comments

SevenRooms Introduces New Tool: Pre-Shift

SevenRooms Introduces New Tool: Pre-Shift

Front of house staff member using SevenRooms

A new tool from SevenRooms will help operators and their teams make the most of pre-shift meetings to deliver exceptional service.

Aptly named, Pre-Shift provides a real-time, data-driven picture of a given shift’s reservations. Operators and their leadership team members will no longer need to hit the office, navigate to the day’s reservations, and print out guest data—assuming they have such valuable information.

Further, this new feature is accessible via the venue’s devices (tablets, phones, etc.). Pre-Shift, then, offers a real-time view of reservations and robust guest data. Well ahead of arrivals, staff will know a guest’s seating preference, relationship with the venue, reviews they’ve left, allergies, and much more.

Intriguingly, Spago has been testing Pre-Shift ahead of SevenRooms’ announcement and launch. Per Steve Scott Springer, the GM of Spago of Beverly Hills, this new tool is a game-changer for restaurants.

Less than two months ago, SevenRooms launched Email Marketing. It’s likely we can expect more new features to roll out throughout 2023.

To learn more, please review the Pre-Shift press release below.

SEVENROOMS’ PRE-SHIFT FEATURE EMPOWERS TEAMS TO STREAMLINE PRE-SERVICE OPERATIONS

New data-driven tool serves as a one-stop-shop for restaurant teams to enhance the guest experience and build guest loyalty

NEW YORK (May 3, 2023) – SevenRooms, a global guest experience and retention platform for the hospitality industry, today announced a new product feature, Pre-Shift, which provides operators with key shift details they can leverage to inform and lead pre-service meetings. Pre-Shift is built to power and simplify pre-service meetings for restaurant operators and their staff around the world.

The new feature provides operators a real-time, unified view of everything they need ahead of each shift and saves employees’ time with an out-of-the-box informational report. Instead of paper print-outs and laborious briefing forms, Pre-Shift allows teams to harness rich customer data with up-to-the-minute information on every guest joining during that shift.

With ongoing labor shortages, Pre-Shift is a crucial tool in helping operators save time on administrative tasks like pulling guest and reservation data to optimize a team’s pre-shift meeting ahead of service with all stakeholders. This allows operators and staff to instead focus on delivering exceptional, personalized experiences the moment that guest walks through the door. Operators have the ability to embrace new consumer expectations to provide an incredible guest journey from start to finish.

By incorporating this tool, staff can utilize SevenRooms’ rich guest data and Auto-Tags to educate themselves on incoming guests. The tool highlights valuable insights such as allergy information, dining preferences, previous experiences with the restaurant, and positive/negative reviews. It also provides a quick snapshot of that day’s notes on menu specials, private events or special requests, making it easy for staff to reference back to quickly throughout the course of service. Whether it’s the maître d, host, server or back of house employees, Pre-Shift enables all staff with the information they need to deliver exceptional service, build guest loyalty, and keep up with diner expectations as they continue to evolve.

Pre-Shift helps restaurants deliver personalized hospitality at scale with invisible technology. Guest and reservation data can be accessed on the fly without double clicks or additional navigation via iPhone and iPads for the utmost convenience. No other reservation management product on the market today offers such a robust overview with automated guest data incorporated into its dashboard, saving operators time as they set up for service.

“The magic of SevenRooms is in the way that we’re able to serve up relevant guest information to restaurants at key points of service. Our new Pre-shift view takes that magic one step further by strategically aggregating the most important guest insights before service even begins,” said Allison Page, Co-Founder & Chief Product Officer at SevenRooms. “We seamlessly take the data available for a shift and serve up key insights that the front of house should be aware of heading into service – for instance, guests with a high propensity to spend, guests who have previously left negative reviews, guests with allergies and more. Pre-Shift provides operators a real-time, unified view that takes pre-service preparation to a whole new level, ultimately providing guests with exceptional, frictionless experiences.”

“Pre-Shift is a great addition to Spago’s pre-service meeting,” said Steve Scott Springer, General Manager at Spago Beverly Hills. “When we began using the group-by server feature, it really was an ‘a-ha’ moment. This is exactly the way every restaurant wants to prep their employees ahead of a shift. We put the entire view up on a screen so our team can see and follow along. This is so much easier than what we used to do – it’s a no-brainer.”

For more information about SevenRooms and its services, please visit www.sevenrooms.com.

About SevenRooms

SevenRooms is a guest experience and retention platform that helps hospitality operators create exceptional experiences that drive revenue and repeat business. Trusted by thousands of hospitality operators around the world, SevenRooms powers tens of millions of guest experiences each month across both on- and off-premises. From neighborhood restaurants and bars to international, multi-concept hospitality groups, SevenRooms is transforming the industry by empowering operators to take back control of their businesses to build direct guest relationships, deliver exceptional experiences and drive more visits and orders, more often. The full suite of products includes reservation, waitlist and table management, online ordering, mobile order & pay, review aggregation, email marketing and marketing automation. Founded in 2011 and venture-backed by Amazon, Comcast Ventures, PSG and Highgate Ventures, SevenRooms has dining, hotel F&B, nightlife and entertainment clients globally, including: MGM Resorts International, Mandarin Oriental Hotel Group, The Cosmopolitan of Las Vegas, Wynn Resorts, Jumeirah Group, Wolfgang Puck, Michael Mina, Bloomin’ Brands, Giordano’s, LDV Hospitality, Zuma, Australian Venue Company, Altamarea Group, AELTC, The Wolseley Hospitality Group, Dishoom, Live Nation and Topgolf.  www.sevenrooms.com

Image: SevenRooms

by David Klemt David Klemt No Comments

Addressing Employee Theft

Addressing Employee Theft

by David Klemt

Security camera stencil graffiti design

Recent posts about employee theft in the hospitality industry throughout Canada and the US have the KRG Hospitality team talking.

Indeed, the statistics are startling. For instance, there’s the claim that a staggering 75 percent of employees admit to stealing from their employers “at least once.”

A few years back, the Retail Council of Canada reported that while “customers” stole $175 on average, employees stole $2,500 before being caught.

Then there’s the incredible economic impact. Multiple sources claim employee theft in the US costs businesses $50 billion annually. In Canada, theft costs businesses more than $1 billion per year. Both numbers are shocking.

Looking at US restaurants specifically, the number ranges from $3 billion to $6 billion in losses due to employee theft. According to Business.com, employee theft affects four percent of a restaurant’s sales and accounts for 75 percent of shortages in inventory.

At this point, you’re probably Googling security cameras. But hold on for a moment.

Disclaimer

Before proceeding, know this: I’m going to make a few points that will seem like victim blaming. In part, this perception will be the result of my addressing recruiting, hiring, onboarding, training, the leadership team, and workplace culture.

Let me be clear: I’m not excusing employee theft. I don’t think there’s any justification for it.

Despite what a (hopefully) small number of loud voices claim on various social media platforms and forums, I don’t think it’s acceptable to steal from a corporation or business owner. No, theft isn’t a justifiable response to feeling slighted by ownership or leadership. And no, it’s not “okay” because a company generates “so much” revenue, has insurance, and can “write it off.”

With that out of the way, let’s proceed.

People are Going to Steal

Here’s one immutable fact: You’re going to hire someone who’s going to steal from your business.

Is your business up and running and serving guests? You employ someone right now who has either stolen from you already or is going to steal.

So, you can run your business under a cloud of suspicion and distrust. Or, you can improve your odds of reducing theft and ferreting out thieves before they do too much damage.

Again, you can install security cameras and place them above each POS terminal and every cash drawer. You can ensure you have clear, cutting-edge CCTV coverage of the entire bar and dining areas. Walk-ins and storage areas can have clear, high-resolution camera coverage.

Honestly, you should have that type of coverage. That type of security can improve employee and guest safety, and your insurance carrier will likely be happy about it.

But you don’t need to impose an atmosphere of suspicion, fear, and intimidation along with the cameras. If you were an employee, would you want to work somewhere that makes it clear you’re always under suspicion? Would you want to work alongside a leadership team whose default setting is that all employees are thieves unworthy of trust?

Workplace Culture

You’re never going to have a theft-free business, period. That’s another reason to not “lead” with fear, anger, and suspicion.

Truly, all that style of leadership will do is drive good, honest employees out. So, the approach should be attracting honest workers. You build a strong, trustworthy team through respect and empowerment.

Yes, there will be employees who take advantage of that respect. They were going to behave that way and steal or otherwise disrespect you, your business, and the team regardless.

Putting in the work to reflect on your leadership style and that of your leadership team pays dividends. It aids in recruitment and fosters an atmosphere of respect and honesty.

Become known for a healthy, positive workplace and you’ll attract the best workers. Nurture that culture and the team will police itself; they won’t tolerate anyone harming the business.

Am I suggesting you view your business through rose-colored lenses? Absolutely not. Install security cameras. Maintain the right insurance coverage. Conduct regular inventory checks. Review comps and voids for irregularities. Limit access to cash. Outline what constitutes theft—including time theft—and make consequences clear.

And here’s a crucial item: Prove you respect and care about your workers. Not say it, prove it.

You don’t need to know their life stories and everything going on in their lives. But you can let it be known that if they’re struggling with something, you and your leadership team are there to listen and help how they’re able.

Nothing you do will eradicate employee theft completely. You can, however, reduce it and learn to quickly stamp it out. And you can do that while maintaining a happy, healthy workplace.

Image: Tobias Tullius on Unsplash

KRG Hospitality. Business Coach. Restaurant Coach. Hotel Coach. Hospitality Coach. Mindset Coach.

by David Klemt David Klemt No Comments

Chain Restaurants: Present & Future

Chain Restaurants: Present & Future

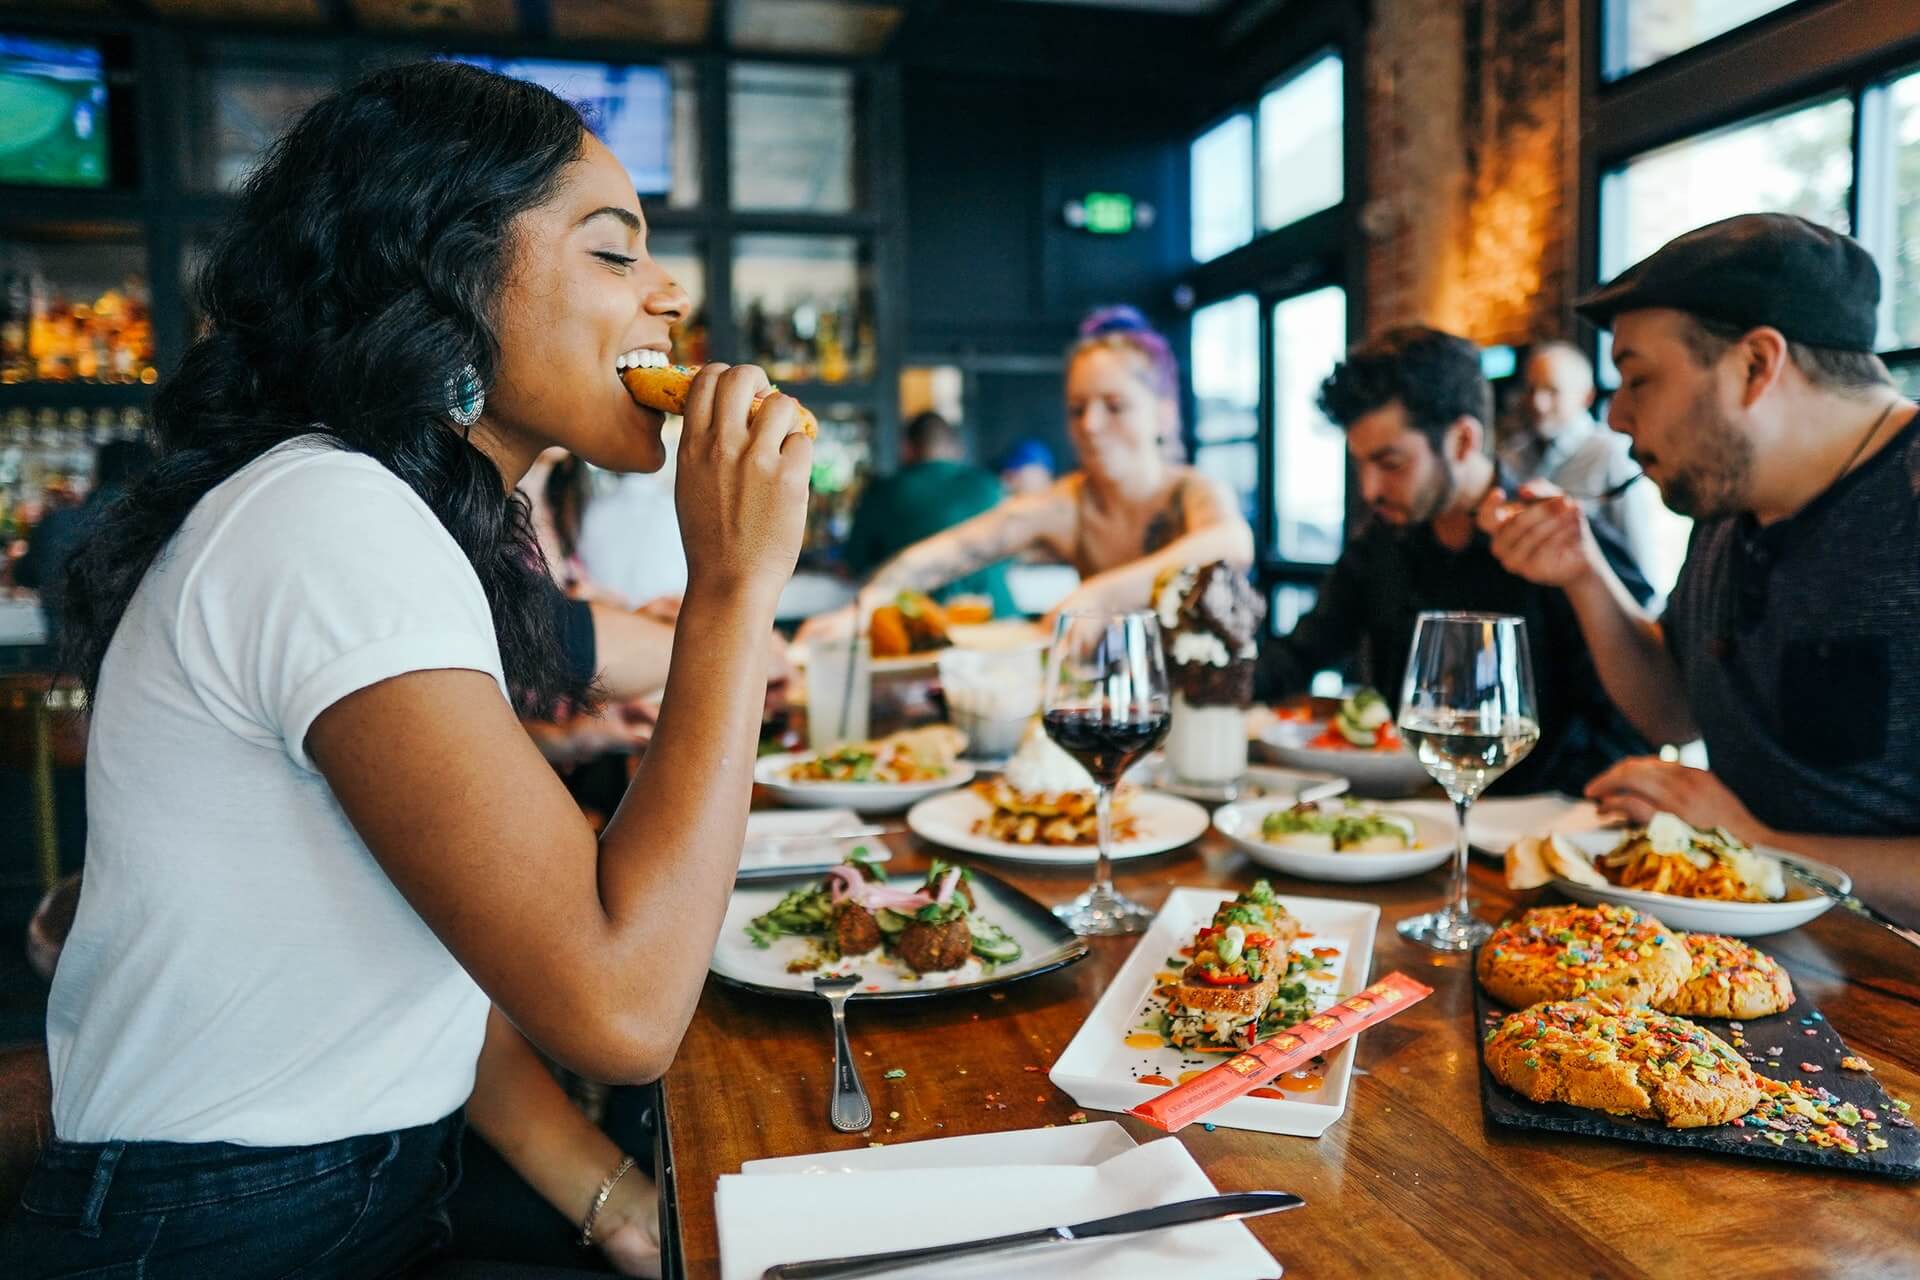
Woman dining with friends in restaurant

Technomic presented the state of chain restaurants, now and next, during Restaurant Leadership Conference 2022 in Scottsdale, Arizona.

Obviously, the entire hospitality industry is facing significant struggles. Rising costs, supply chain chaos, labor shortages and challenges, inflation… The past two-years-plus haven’t been easy.

However, there’s reason for operators and their leadership teams and staff to be optimistic. Additionally, independent and small-chain operators can learn from Technomic’s findings.

Challenges & Threats

Well, let’s take our medicine first, starting with the supply chain. In short, it’s bedlam.

Joe Pawlak (standing in for David Henkes) and Richard Shank of Technomic said as much during RLC 2022. Per their data, 35 percent of operators dropped at least one manufacturer between 2020 and 2021.

Whether because of rising costs, an inability to consistently deliver product, or other factors, operators had to adapt. Clearly, there’s a nasty trickle-down effect when an operator drops a supplier.

And then there’s inflation. Interestingly, Shank calls what we’re seeing currently as “existential inflation.” Relating to consumers, this means their confidence is shaken in terms of spending.

Of course, this type of consumer perception manifests in several ways. For example, some guests cut down on visits. Others will cut down on ordering, skipping appetizers and desserts. Perhaps they have one less beer, glass of wine, or cocktail.

Also, some guests “trade down.” Meaning, there are consumers who opt for casual restaurants rather than fine dining. Or, they’ll move from fast-casual to QSR.

Looking at the numbers, however, nearly 40 percent respondents to a Technomic survey say they’re visiting restaurants less. This makes sense, as 81 percent are concerned about how inflation will impact them personally.

On the operator side of inflation comes pricing. During Pawlak and Shank’s presentation, they used QSR dinner pricing as a real-world example.

According to Technomic, the tipping point for guest perception of good value is just $7. At only $10, consumers feel things are getting expensive.

As Pawlak and Shank pointed out, this is a problem. After all, the average price for dinner at a QSR is $10.08. That number may already be higher today.

Opportunities

Medicine taken, we can move to the good news.

First, Technomic predicts a strong Q3 this year. Additionally, they don’t expect double-digit year-over-year inflation.

In terms of labor, Technomic doesn’t expect costs to go down. However, they do anticipate that they’ll level off rather than rise.

Then there are the numbers. For the top 500 chains in the US in particular, 2021 was a “banner year,” according to Pawlak. On an aggregate basis, sales for the top 500 (McDonald’s is number one, for those wondering) are up 17.9 percent.

Also, every category of restaurant is performing better. The top 500 chains, for instance, are up 18 percent year-over-year. Midscale restaurants are up 38.5 percent. Casual is up 30.2 percent while fast is up 22.2 percent, QSRs are up 13.2 percent. As far as the biggest bump, fine dining is up 56.9 percent.

Looking at 2019 for obvious reasons, the industry was down 49.1 percent in sales in April 2020. However, the industry was down just about a single percentage point in February of this year compared to the same time in 2019.

So, how do we keep sales trending upward when facing inflation and other threats? Pawlak, Shank, and Technomic have some advice.

Operators, for instance, can implement the “balanced barbell” pricing strategy. In this model, high-value items drive business alongside premium offerings. In other words, don’t discount the entire menu just to entice guests to keep visiting.

Once guests get a taste for falling prices, they’ll consider the lower prices the standard. After that, any increase can be perceived as “too expensive.” Of course, discounting the whole menu also impacts guest perception of the brand negatively.

In addition, Technomic suggests offering higher net profit discount bundles, and implementing off-premise, large-party strategies.

Should Technomic’s predictions prove true, the industry may see an even stronger Q4 and start to 2023.

Image: Alex Haney on Unsplash

Top