Watch These Drink Trends in 2025
by David Klemt
Bottle of Martinis, anyone? In case you were uncertain, this image is AI-generated.
We’re nearing the end of 2024, and that means F&B intelligence platforms are releasing their year-end reports and predictions.
Among these platforms is Datassential. Recently, they released their Future of Drink preview report. You can sign up for your own copy here.
I’ve sifted through Datassential’s latest reports and trend-focused articles, and I’ve pulled a handful I think are among those that may perform the strongest in 2025.
Cheers!
Posh Jello Shots
Or as Datassential calls them in their report summary, “highbrow” jello shots.
This is the 2025 trend prediction that stands out the most to me. Your bar team will know how to produce jello shots (or learn how to make them reliably and consistently), but it’s not a difficult skill to develop.
Jello shots, or gelatin shots if you want to be pedantic, are most often associated with house parties and dive bars. However, gelatin is an interesting cocktail canvas, offering at the very least a different way to experience drinks texturally.
The simplest way to embrace this trend would be to use upmarket alcohol to craft these shots. Premium or super premium vodkas, for example. Another way would be to convert your signature cocktail(s) into jello form. And yet another approach would be layered jello shots, with each layer crafted using premium or super-premium ingredients.
An Alternative
Of course, operators don’t need to produce specialty, higher-end shots in gelatin form. With a bit of thought and experimentation, bar teams can produce shots that are essentially miniature versions of cocktails. Further, these can be offered as flights.
So, do you have a few specialty cocktails on your menu? Offer them as a flight of shots. Want to craft themed flights, such as a Negroni and two variants (Boulevardier and Sbagliato, for example)? That idea may just take off with your guests in 2025.
Creating shootable versions of more sophisticated cocktails elevates your program. Further, doing so can help introduce guests to a range of cocktails during a single visit in what can be a more responsible manner.
Think so-called “Mar-tinies” for inspiration: miniature Martinis served in miniature Martini glasses.
Heirloom Grains
It’s likely that you’re going to see “heirloom” or “heritage” a lot more in 2025 in relation to beer.
As both terms imply, brewers who produce these types of beer use grains they can trace back decades. Often times, heirloom grains are significant historically.
For example, Hanabi Lager Co. produces Haná Pilsner. Per the brewer, Haná is an heirloom grain that was used to produce the first-ever pilsner. In case you’re a beverage history buff or like sharing stories with guests who are interested, the first pilsner was brewed in 1842 by Josef Groll in the city of Pilsen.
Hanabi Lager Co. credits British farmers with “rescuing” Haná, pulling it back from the brink of extinction in 2015. Click here to check out other Hanabi beers made with heirloom barley and other heritage grains.
Operators who are interested in leveraging beers with notable ingredients should look for the words “heirloom,” “heritage,” and “ancient grain.” Further, they should ensure they know these beers would be of interest to their guests, and serve their concept in an authentic manner.
More Beer Trends
Other beer-centric trend predictions include global beers, hazy IPA, beer cocktails, and beer with a hint of lime.
I’m confident you don’t need an explanation of each of these 2025 trend predictions. However, it’s smart to approach each with careful consideration before adding them to your menu.
To provide an example, consider flights that focus on each trend: three to four hazy IPAs, half-sized beer cocktails, or specialty global beers.
Focusing on beer cocktails, or beertails or hoptails as I’ve seen over the years, I’m somewhat skeptical how they’ll rise in popularity. In my experience, they’ve never quite “hit” throughout the years. But, maybe 2025 is the year.
As far as beers with a hint of lime, consider creating snack pairings that pair well with such beers. Snacking as a trend is expected to rise in 2025, so it’s wise to engage your kitchen team to come up with a snack menu for your bar.
Cocktails on Tap
While I don’t recommend cocktails on tap of keg cocktails for every concept, I have certainly crafted beverage programs that leverage this trend.
And, in fact, I don’t consider these drinks to be a trend at all. In my opinion, cocktails on tap may not be ubiquitous, but they’re certainly no fad.
Why do I like cocktails on tap? For several reasons.
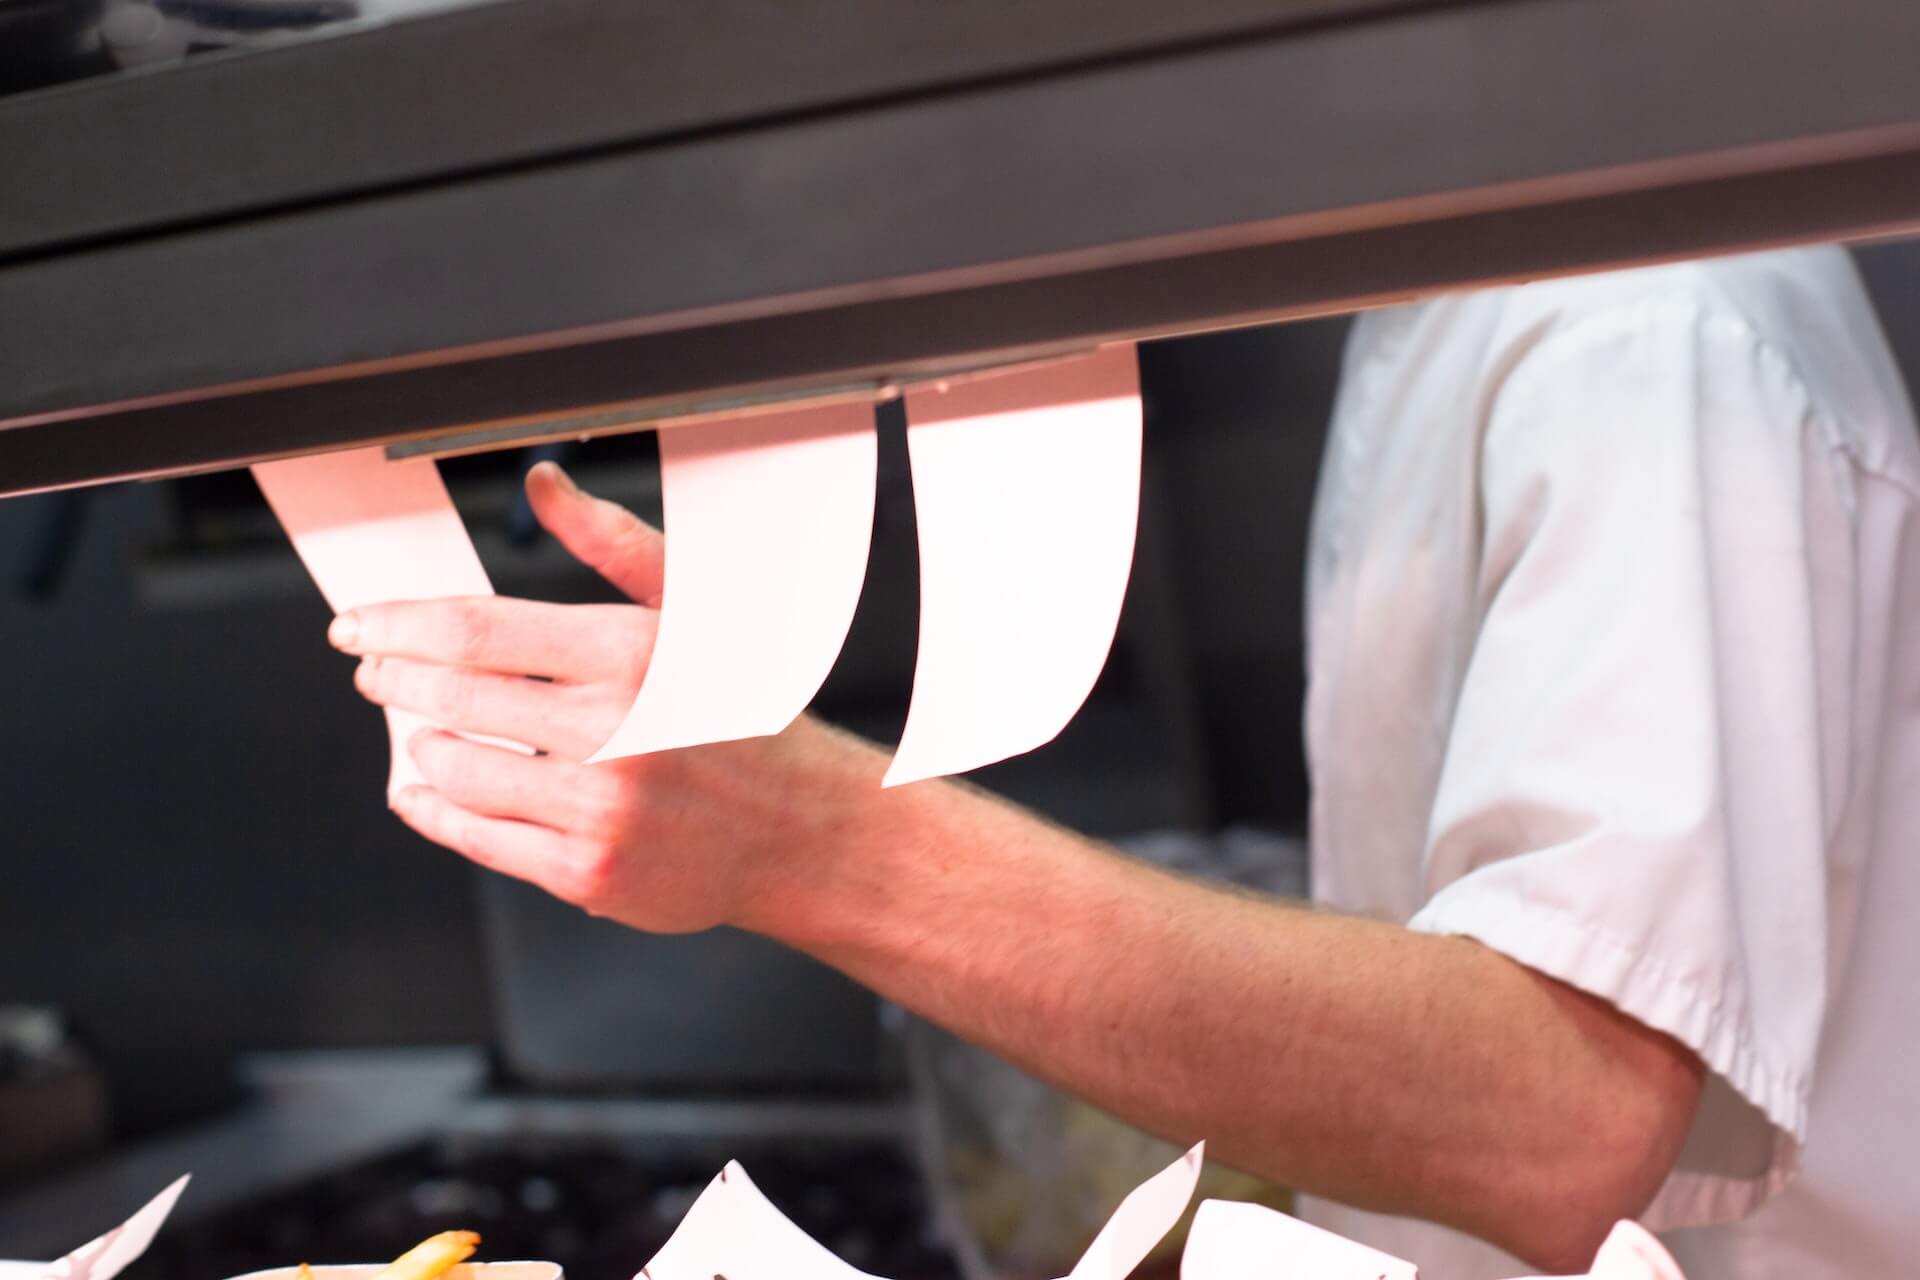
One of those is the speed of service, which benefits the team and the guest. While labor is necessary prior to service to prepare these drinks, kegged cocktails make up for all that effort. When the right cocktails are selected for the taps, they make it easy on the bar team to serve, and make it into the hands of guests in mere moments.
Another reason is the “novelty” of cocktails on tap. These drinks aren’t new yet many guests find the idea interesting, which piques their curiosity. Engaging guests is always good for business.
Now, think about bars and restaurants that include self-pour walls as a core feature of the concept. Guests have shown they’re interested in pouring their own beers and wines from pour walls. There are myriad reasons, including trying before they commit to something new to them. This applies to cocktails as well, and kegged cocktails are perfect for self-pour concepts.
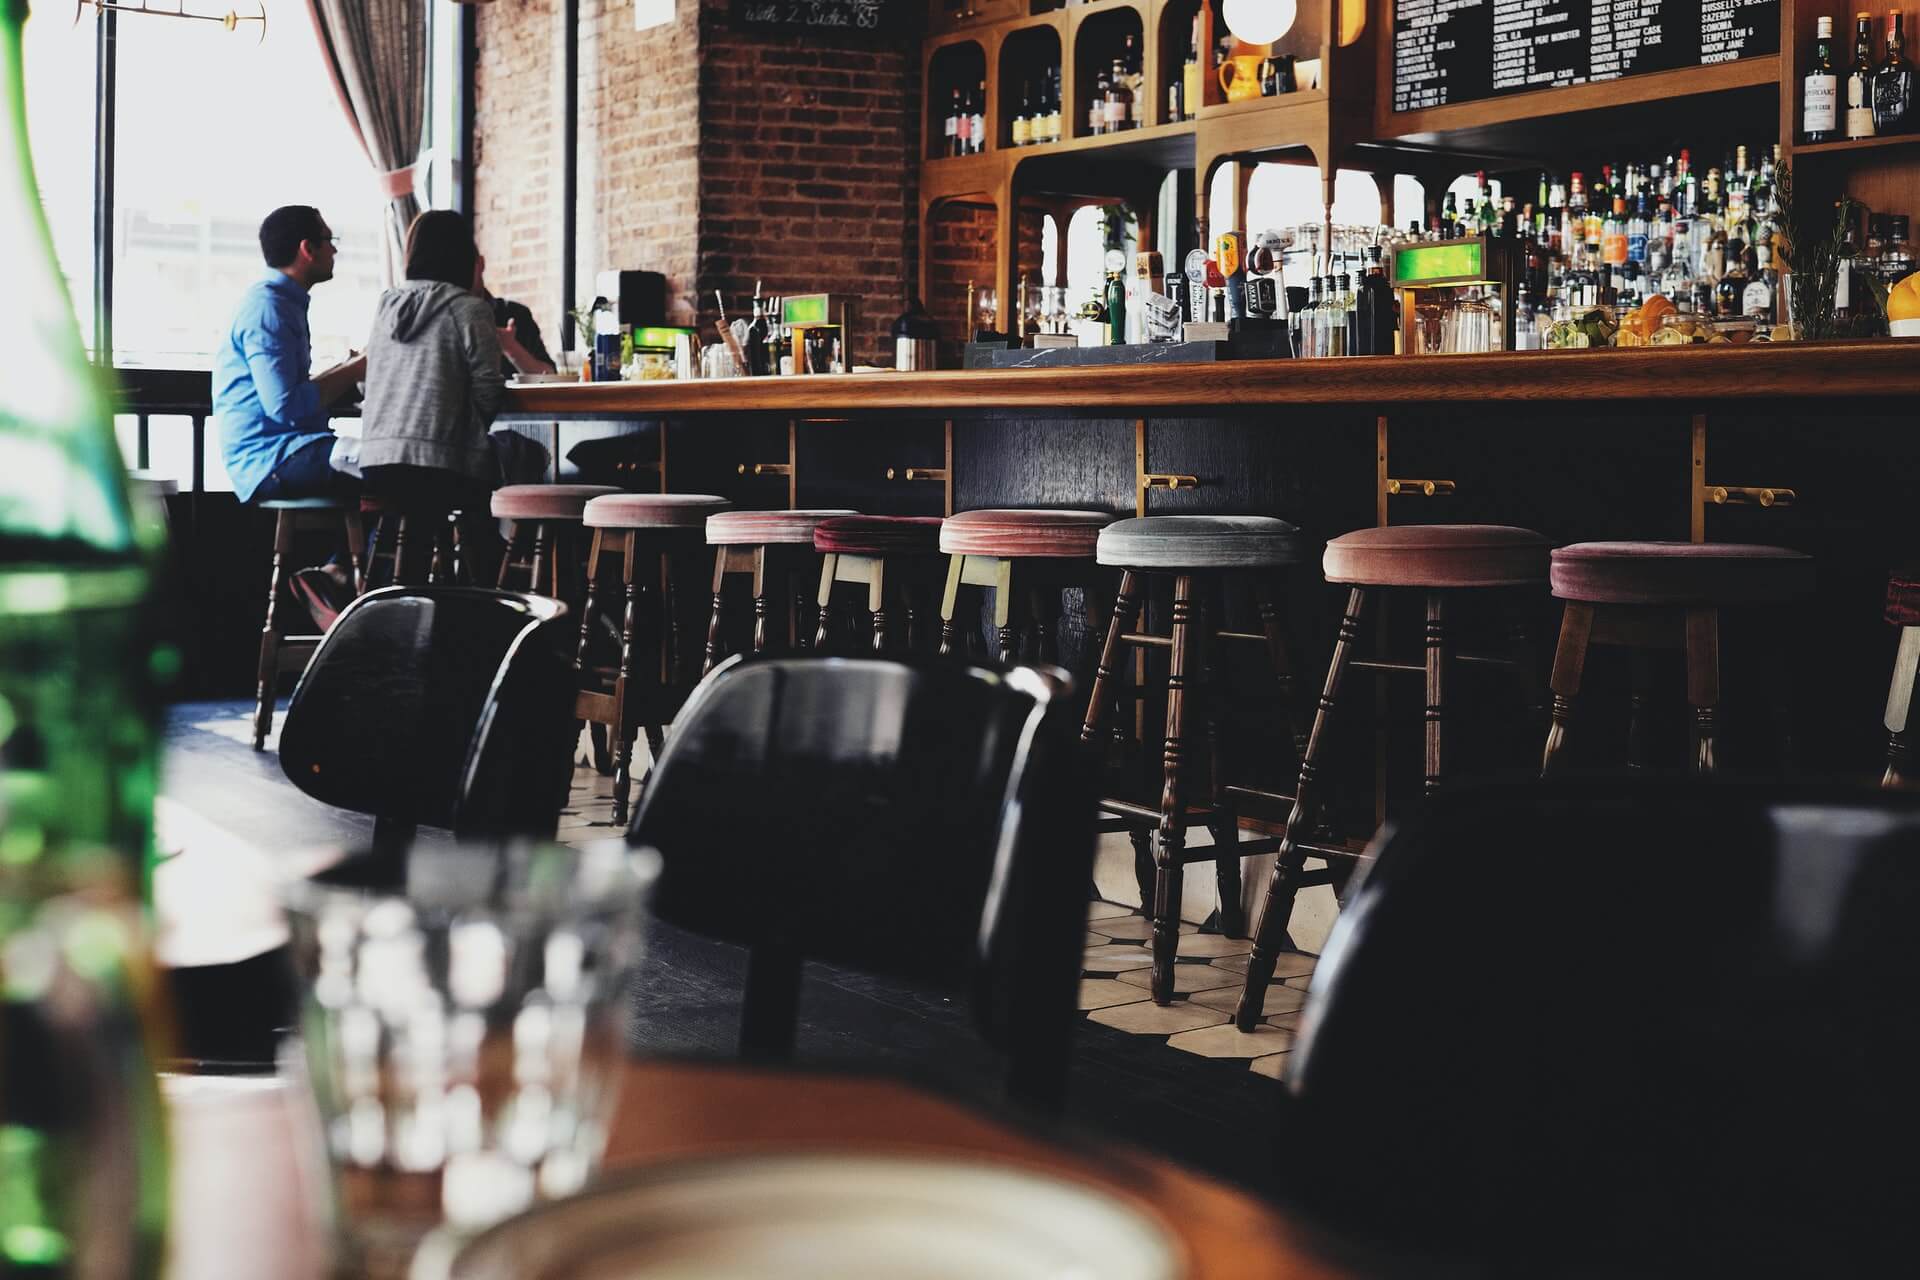
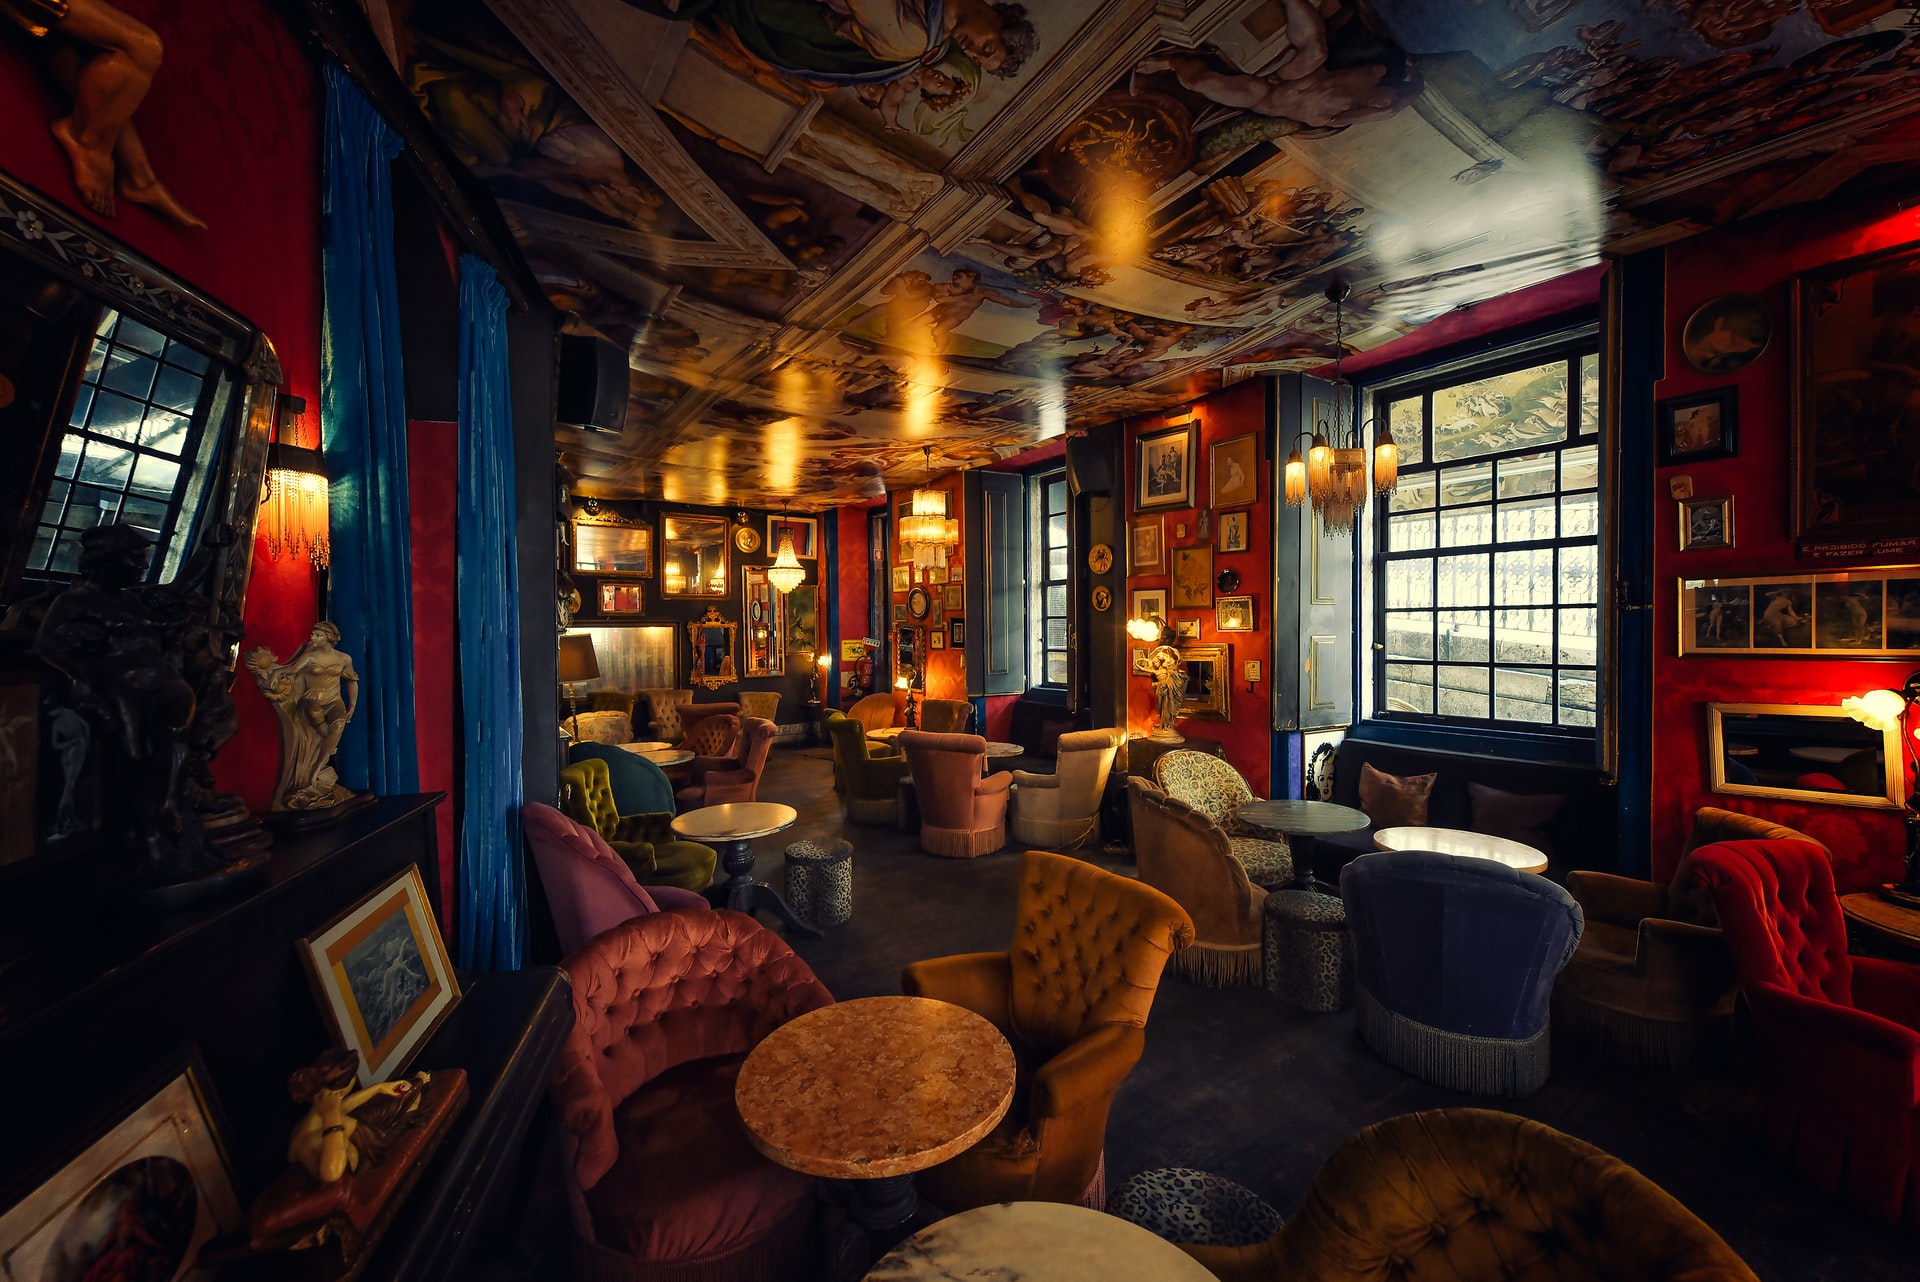
Finally, they work for just about every category of bar, from casual neighborhood watering hole to upscale cocktail bar. When an operator focuses on glassware, garnish, and presentation, a cocktail on tap can appeal to even the most discerning cocktailian.
Image: Microsoft Designer

Book Below to Setup a 30-Minute Complimentary Discovery Call and Request for Proposal.