Consumer trends

by David Klemt David Klemt No Comments

Menus in Canada: Who Wants What Items?

Menus in Canada: Who Wants What Items?

by David Klemt
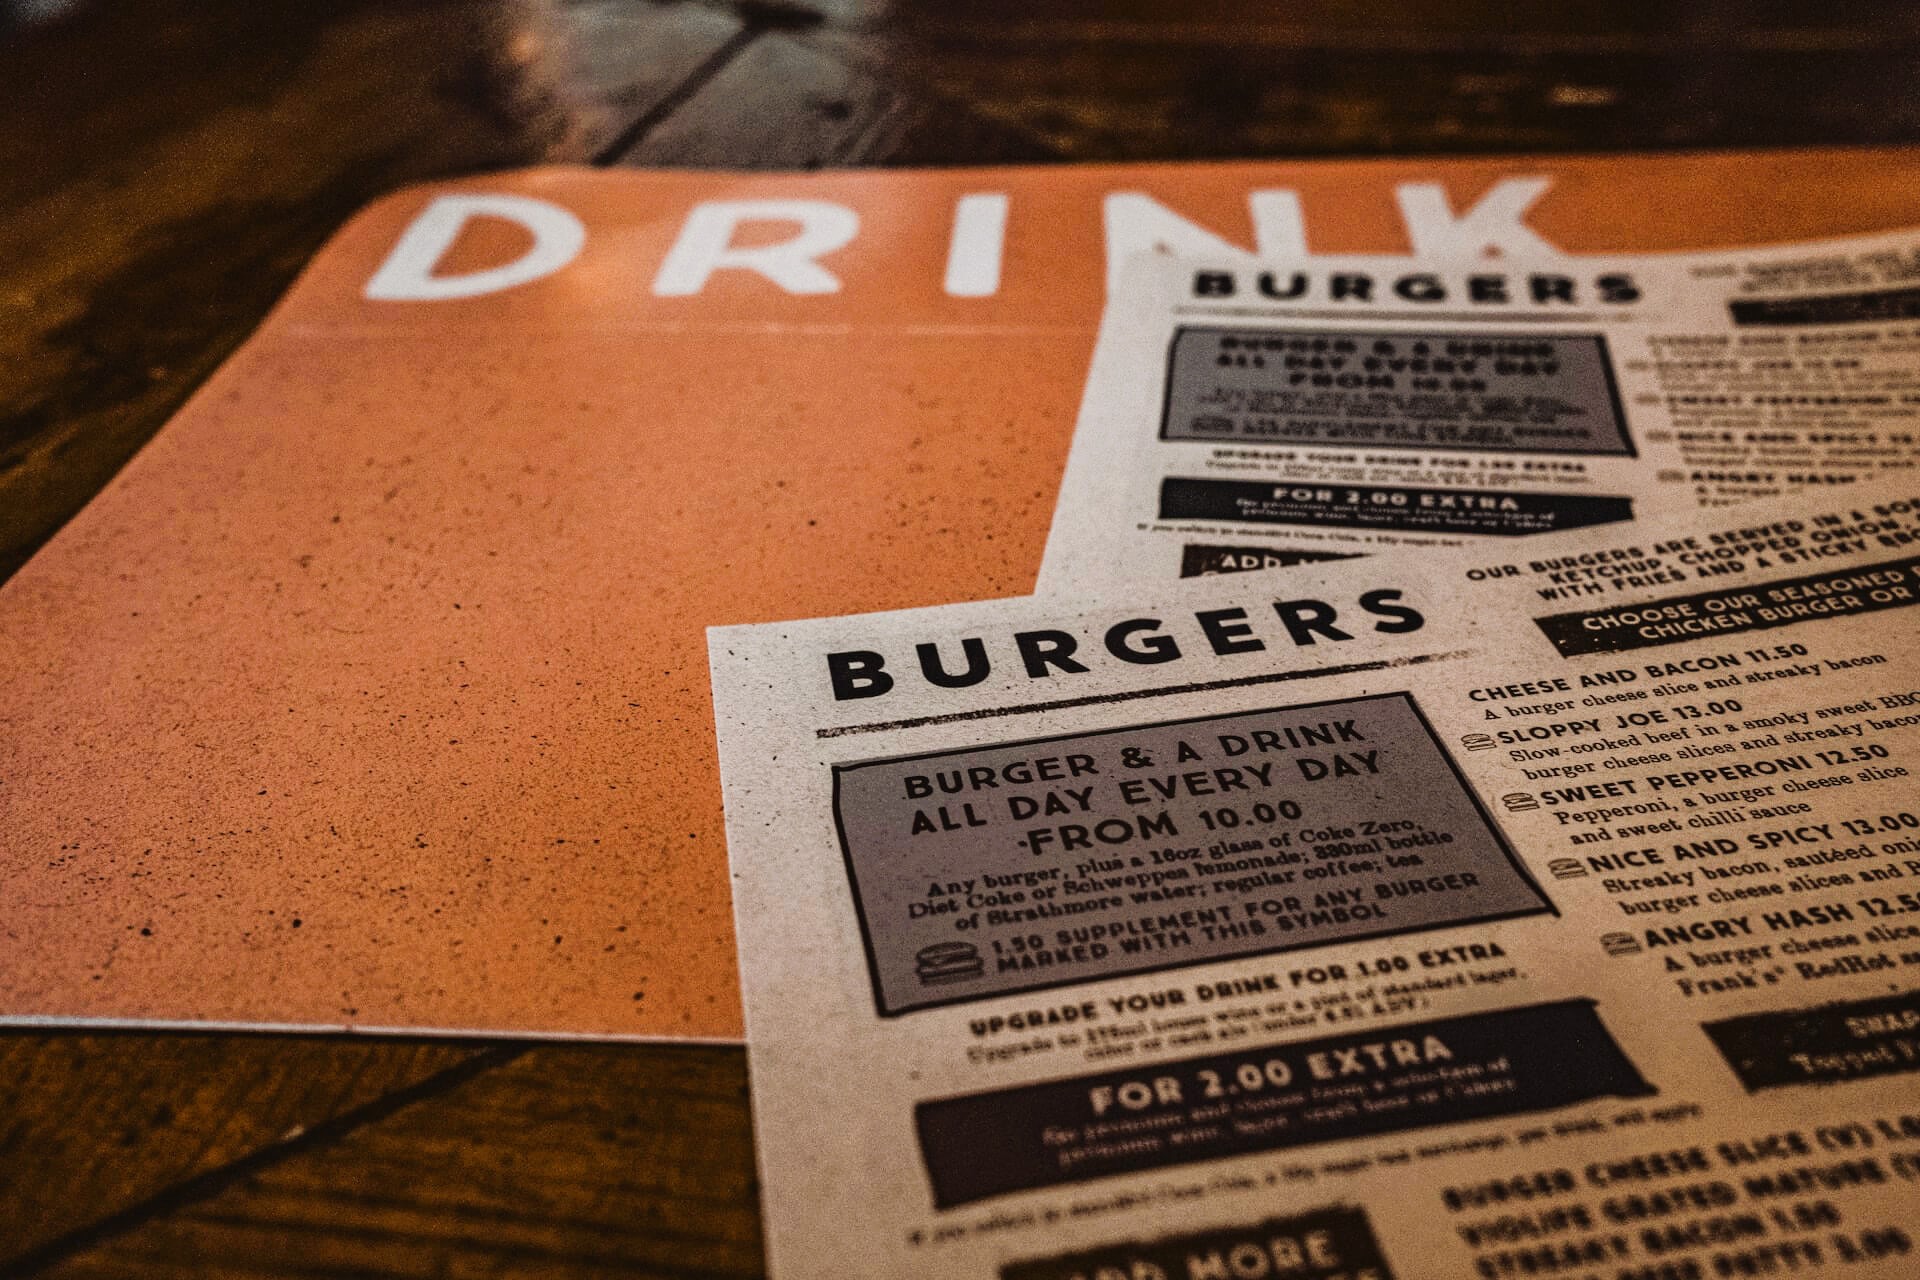
Bar and restaurant food and drink menus

Nobody has a crystal ball telling them what they should put on their menus to boost traffic and revenue, but we do have data.

In this instance, we have useful data regarding Canadian consumers specifically. Not only do we have helpful information from Restaurants Canada, David Henkes from Technomic has also weighed in. For those who are unfamiliar, Technomic is one of the best foodservice research and consulting firms.

Before we dive into Restaurant Canada’s menu trend information, this is not a review of the top menu item orders in Canada. For a deep dive into that topic in particular, please read our article “F&B in Canada: Top Menu Items.”

Instead, in this article we’re reviewing broader menu categories and interest in them among Canadian consumers. For your own copy of the 2022 Foodservice Facts report, click here.

Word of Warning

Now, it’s important to bear in mind that the data below is a snapshot. It’s important, informative data but it shouldn’t influence your menu completely.

In other words, when considering revising your menu in any way, make sure you’re staying true to your brand and the community you serve. If your data differs from Restaurants Canada and Technomic data, that’s okay.

Not only are there always outliers, not all data applies to every concept. So, don’t take drastic action on your menus based solely on the data below.

For this particular topic, Restaurants Canada asked three age groups about their interest in eight menu categories.

The groups are: 18 to 34, 35 to 54, and 55-plus. The industry advocacy group then reviewed the numbers for those who indicated they’re “very interested” or “somewhat interested” for each category or item.

Who Wants What?

The menu category generating the most interest from Canadian consumers, according to Restaurants Canada data, is food sourced from local farmers. Overall, 93 percent of survey respondents very or somewhat interested. Those in the 55-plus age group are the most interested.

More than 80 percent are interested in comfort foods, or creative riffs on comfort foods. Age groups 18 to 34 and 35 to 54 have the most interest. Precisely 80 percent are interested in trying globally inspired foods and flavors, led by the 18 to 34 age group.

Foods that promote health and wellness come next, with 79 percent of Canadian consumers showing interest. The 55-plus age group is particularly interested. However, dishes that utilize ingredients that boost one’s immune system are only popular among 53 percent of survey respondents. Interestingly, it’s the 18 to 34 age group with the most interest in this category.

In what’s possibly a contrast from American consumers, the final three categories have no more than 41 percent of survey respondents’ interest. Forty-one percent have interest in meatless and vegetarian items. Next, just 38 percent show interest in alcohol-free cocktails. Finally, just 33 percent are interested in plant-based burgers and sausages.

For each of those categories, the greatest interest comes from the 18 to 34 age group, and the 55-plus group shows the least amount of interest.

Recommended Reading

We’ve been reviewing the 2022 Foodservice Facts report from Restaurants Canada in depth for several weeks. To learn more about this important report, please read the following:

Image: Samuel Regan-Asante on Unsplash

by David Klemt David Klemt No Comments

F&B in Canada: Top Menu Items

F&B in Canada: Top Menu Items

by David Klemt

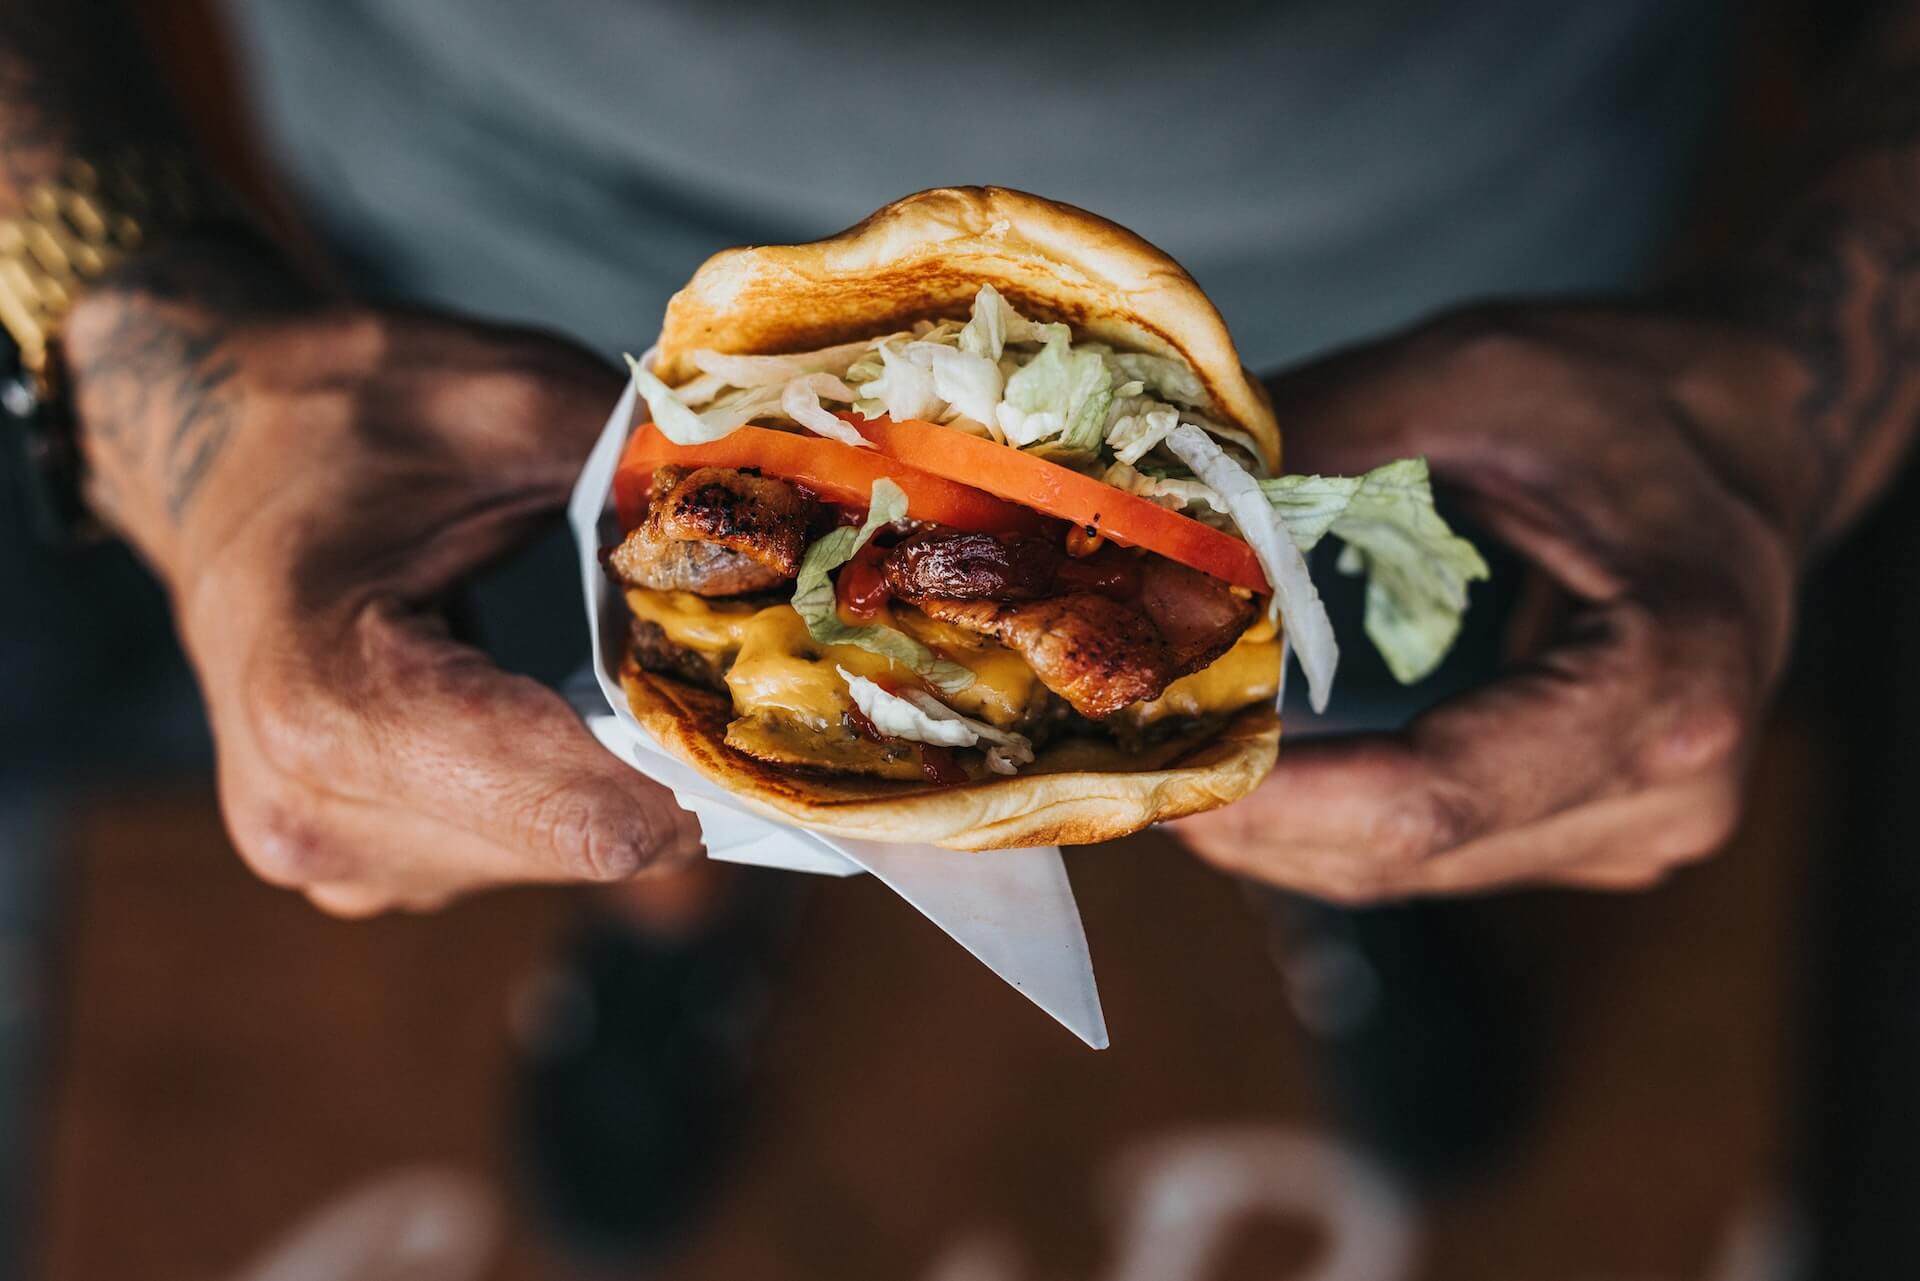
Closeup of hands holding burger

Those wondering what food and beverage menu items are performing best among consumers throughout Canada need wonder no more.

And why is that? Well, Restaurants Canada has the answers, revealing the top ten food and top ten beverage items.

Further, the organization compares each item’s performance. In this instance, Restaurants Canada analyses the percentage of orders that contained each food or beverage item from January to April 2022 in comparison to 2019.

These insights (and many more) are available in Restaurants Canada’s 2022 Foodservice Facts report. In fact, you can find our reviews of several of the restaurant advocacy group’s report topics via the links below:

For your own copy of this year’s Foodservice Facts report, click here.

Top 10 Canadian Drink Menu Trends

As you’ll see below, coffee is outperforming nearly every other beverage category. Specifically, Hot coffee is at the top, while Iced or frozen coffee is ranked third.

Unsurprisingly, Carbonated soft drinks / Pop / Soda split the two coffee categories. According to Restaurants Canada, the Carbonated soft drink category can credit its performance in large part to QSRs.

  1. Milk: 1.8% (2019) to 1.8% (2022)
  2. Iced tea: 2.9% (2019) to 1.6% (2022)
  3. Milkshakes / Smoothies: 2.1% (2019) to 2.0% (2022)
  4. Fruit juice: 3.8% (2019) to 3.0% (2022)
  5. Hot tea: 5.5% (2019) to 4.5% (2022)
  6. Alcohol beverages: 5.1% (2019) to 5.7% (2022)
  7. Water: 6.6% (2019) to 5.0% (2022)
  8. Iced or frozen coffee: 5.3% (2019) to 7.5% (2022)
  9. Carbonated soft drinks / Pop / Soda: 19.7% (2019) to 20.2% (2022)
  10. Hot coffee: 40.9% (2019) to 41.9% (2022)

Compellingly, Alcohol beverage performance in restaurants fluctuated by age group between 2021 and 2022. Alcohol order shares in restaurants, per Restaurants Canada:

  • Legal drinking Age (LDA) to 34: 46% (2021) to 43% (2022)
  • 35 to 49: 17% (2021) to 21% (2022)
  • 50-plus: 37% (2021) to 36% (2022)

Alcohol order shares in bars, according to Restaurants Canada:

  • LDA to 34: 35% (2021) to 35% (2022)
  • 35 to 49: 17% (2021) to 19% (2022)
  • 50-plus: 49% (2021) to 47% (2022)

Overall, the 35 to 49 age group appears to be consuming less alcohol in bars and restaurants in comparison to the LDA to 34 and 50-plus cohorts.

Top 10 Canadian Food Menu Trends

As Restaurants Canada notes, the Sandwich / Sub category has grown in 2022. Interestingly, the category just below it in growth, Chicken, is partially responsible for boosting Sandwich / Sub performance.

As far as entrees or “main attractions,” the Burger category remains at the top, beating out Breakfast, Sandwich / Sub, Chicken, and Pizza menu items.

  1. Cake / Squares / Muffins: 3.7% (2019) to 3.3% (2022)
  2. Salad: 4.3% (2019) to 3.8% (2022)
  3. Donuts / Beignets: 3.0% (2019) to 3.8% (2022)
  4. Breads: 4.3% (2019) to 3.4% (2022)
  5. Pizza / Panzerotti / Calzone: 4.1% (2019) to 4.3% (2022)
  6. Chicken: 7.6% (2019) to 8.5% (2022)
  7. Sandwich / Sub: 8.0% (2019) to 8.5% (2022)
  8. Breakfast: 10.8% (2019) to 11.4% (2022)
  9. Burger: 9.0% (2019) to 10.9% (2022)
  10. French fries / Potato / Sweet potato / Onion rings: 15.0% (2019) to 16.1% (2022)

Image: Nathan Dumlao on Unsplash

by David Klemt David Klemt No Comments

The Numbers on Food Delivery in Canada

The Numbers on Food Delivery in Canada

by David Klemt

Burger in container inside car

For most restaurants, delivery is now a crucial service element rather than a “nice-to-have” option a small percentage of guests expect.

This is true whether your restaurant is in the US or Canada. But who’s placing orders? How are they ordering? And will they continue to order for the foreseeable future?

Well, Restaurants Canada has answers to all those questions and more. So, we let’s take a look at what their 2022 Foodservice Facts report says about delivery.

To download your own copy of this informative report, click here.

Who’s Placing Orders?

In their 2022 Foodservice Facts report, Restaurants Canada looks at three age groups:

  • 18 to 34
  • 35 to 54
  • 55-plus

Perhaps unsurprisingly, the 18- to 34-year-old cohort leads the charge when it comes to ordering delivery. It’s also not surprising that 35 to 54 comes in second, and 55 and older is third.

However, the first two groups are closer than some may assume. Eighty-three percent of the the 18 to 34 cohort placed orders at quick-service or full-service restaurants between December 2021 and May 2022.

That number does drop for the same time period among the 35 to 54 group, but not by a significant amount. Of that cohort, 77 percent ordered delivery. Just over half of the 55-plus group placed delivery orders: 52 percent.

Now, those numbers are down a bit from 2021, which makes sense. Things were much more restrictive in 2021 and people were just getting back to a sense of normalcy at the start of this year.

In 2021, the delivery order percentages were:

  • 18 to 34: 89 percent
  • 35 to 54: 81 percent
  • 55-plus: 67 percent

Looking at these numbers, it appears the 55-plus cohort is more comfortable dining out in person. Conversely, the 18 to 34 age group is clearly comfortable making delivery a part of their everyday lives.

How do People Want to Order?

Believe it or not, your website still matters. I’ve been saying this for years but the pervasiveness of delivery and takeout ordering is really driving this point home.

The fact is, a notable percentage of your guests want to support your restaurant and staff directly. Over the past couple of years, consumers have become well aware that third-party delivery services are incredibly costly for operators.

Consumers are also aware of third-party delivery debacles, such as the abysmal Grubhub “Free Lunch” mess from May of this year.

So, direct delivery is something that operators need to at least consider. Implementation is often less difficult than most business owners believe. And many platforms, SevenRooms, for example, make implementing direct delivery simple and affordable.

Interestingly, Restaurants Canada data supports the need for direct delivery. Back in May, the industry advocacy organization asked survey respondents how they prefer to place delivery orders from restaurants.

Preferences for QSR customers:

  • No preference: 10 percent
  • Over the phone: 19 percent
  • Third party: 35 percent
  • Restaurant website or app: 36 percent

Full-service customer preferences:

  • No preference: 8 percent
  • Over the phone: 28 percent
  • Third party: 29 percent
  • Restaurant website or app: 35 percent

Honestly, I find it surprising anyone calls a QSR to place an order. However, I suppose that makes sense for an office or catering.

At any rate, make sure your website is up-to-date, you offer direct or “last-mile” delivery, and make it easy to navigate your menu and the ordering process.

Is Ordering Here to Stay?

Now, we all know why restaurant delivery has been supercharged the past two years. However, consumer trend data show that delivery was on the rise before the Covid-19 pandemic.

But now that people are eager to return to normal and the industry is on its way to returning to pre-pandemic levels, is delivery really here to stay?

According to another question asked of survey respondents by Restaurants Canada, more than half of QSR and full-service restaurant customers plan to stick with delivery.

For their 2022 Foodservice Facts report, Restaurants Canada asked back in May how often consumers planned to place delivery orders in the next six months.

Order frequency for QSR customers:

  • Never placed a delivery order and don’t plan to now: 29 percent
  • Order less often: 20 percent
  • Will order with the same frequency: 45 percent
  • Will order more often: 7 percent

Frequency of orders for full-service customers:

  • Never placed a delivery order: 24 percent
  • Order less often: 23 percent
  • Will order with the same frequency: 44 percent
  • Will order more often: 9 percent

Here to Stay?

Of course, there are multiple factors feeding the numbers above. Some people simply don’t like ordering and waiting for delivery. For these consumers, the practice doesn’t just seem convenient.

There’s also the consumer demand to return to in-person dining, socializing with family and friends. And, of course, meeting new people while dining out.

We must also consider inflation and rising costs. Often, restaurant spending is among the first to be reduced when consumers need to be more frugal. Rising menu costs are sure to curtail some delivery spending.

That said, it’s clear delivery is here to stay and must be considered a crucial element for most restaurant operations. QSR and full-service operators need to bear in mind is placing orders; how often they’re placing orders; and get them in the habit of placing orders directly.

Image: Oliur on Unsplash

by David Klemt David Klemt No Comments

Pumpkin Spice Season Descends Upon Us

Pumpkin Spice Season Descends Upon Us

by David Klemt

Jack o' lantern and smoke

Once again, the unstoppable march of the spooky season is upon us, bringing with it a frightening assortment of pumpkin spice items and expectations.

In the blink of an eye, hordes will descend on your restaurant or bar. “Pumpkin spiiiiiice,” they’ll croak.

Okay, so that’s overly dramatic. For the most part, pumpkin spice season is anything but scary. And really, very few people will transform into singularly focused pumpkin spice zombies.

However, fall is nearly here. So, you do need to finalize your fall/autumn menu. Beginning in September, that really does mean considering offering at least one pumpkin spice LTO item.

Interestingly, though, pumpkin spice may not deserve its perception as the flavor of fall. According to Datassential, there are ten flavors that index high enough to give pumpkin spice a challenge for the fall throne.

What are they? Well, it just so happens that Datassential has those answers, along with a bit of useful advice.

Lord of the LTO

Recently, Datassential released “Food Industry Trend Report: 2022 Pumpkin Spice Season.” As the research firm points out, pumpkin spice seems to be encroaching on summer more each year.

How far away are we, I wonder, from pumpkin spice claiming summer for itself? Will we be subjected to pumpkin spice dry rubs at summer barbecues? Is some intrepid operator going to create a pumpkin spice lemonade?

Those terrifying questons aside, pumpkin spice season coming earlier means more opportunities to benefit from LTOs. Just as it seems that pumpkin spice is descending upon us earlier and earlier, it also seems to dominate the LTO space.

In fact, per Datassential research, major chains executed 174 pumpkin spice LTOs. Now, that’s still with a five-percent drop in menuing for pumpkin space over the past 12 months. Further, that number doesn’t include small, regional chains and independents who also launched pumpkin spice LTOs.

Of course, there are also other fall flavors that deserve a place on operators’ menus. And they’re perfectly cromulent as LTO drivers.

Fall Flavor Favorites

To inspire operators to create LTOs that entice consumers this fall, Datassential has identitied ten flavors on which to focus. Helpfully, they separate them into two main categories.

Top five sweet fall flavors:

  • Vietnamese cinnamon
  • Spicy ginger
  • Allspice
  • Eggnog
  • Pumpkin pie

Top five savory flavors:

  • Coconut milk
  • “Oktoberfest”
  • Mustard cream
  • Turkey gravy
  • Cranberry sauce

Personally, I can see operators and their teams needing to get creative to leverage mustard cream and turkey gravy. Interestingly, Datassential suggests a few flavors not on either list above.

According to their report, Datassential expects apple and blood orange to be popular for LTOs this year. According to the firm, apple was popular last year. When it comes to blood orange, Datassential says 38 percent of consumers like or love the flavor.

Whichever flavors you choose, Datassential has the following advice, which we co-sign: Ensure your LTOs are fresh; make sure they’re easy and quick to make; and don’t discount them. In fact, you should create premium LTOs that come with a premium price.

Image: Colton Sturgeon on Unsplash

by David Klemt David Klemt No Comments

iPourIt Releases Fourth Annual Pour Report

iPourIt Releases Fourth Annual Pour Report

by David Klemt

Black and white beer taps

Self-serve beverage platform iPourIt’s informative fourth annual Pour Report identifies their top beer and wine pours from 2021.

iPourIt is a pioneer in the self-serve space, enhancing the guest experience and boosting revenue. However, their annual reports are another key reason operators should consider this platform.

Unlike other industry platforms, iPourIt doesn’t limit their resources to clients. Nor do they place resources like their annual Pour Report behind a pay wall. So, this is a transparent company that clearly views their relationships with clients as partnerships.

You can check out their resources for yourself by following this link. To download a copy of the 2021 Annual Pour Report, click here.

Below you’ll find key datapoints from the latest iPourIt report. I encourage you to download and review the report in its entirety.

Key Demographic Information

When it comes to men and women using iPourIt self-serve systems, men are respsonsible for 64 percent of total ounces poured.

On average, men served themselves 6.4 ounces per pour and spent $14.21 on iPourIt per visit. For men, the top pours were IPA, Lager, Cider, Hefeweizen, and Sour.

Conversely, women served themselves nearly 11 million ounces via iPourIt systems. That’s 36 percent of total ounces poured.

On average, women served themselves 5.3 ounces per pour and spent $11.95 per visit. For women, the top pours were Cider, IPA, Sour, Lager, and Hefeweizen.

Interestingly, the top pour for both men and women was Michelob Ultra.

Key Beer Takeaways

The 2021 Pour Report analyzes data from more than 300 iPourIt systems, over 8,800 taps, and 49 million total ounces of beer and wine poured.

In total, patrons consumed nearly 14,600 total products. Further, the data above represents 1.9 million guests served 3.1 million pints. Compellingly, that’s $26.2 million in revenue generated by iPourIt systems.

In terms of iPourIt systems and patrons, cider claimed the number two slot for the top 15 poured beer styles. Perhaps unsurprisingly, IPA claims the top spot. In fact, iPourIt systems served more than 10 million ounces of IPA.

As far as beer styles that are growing in popularity, three styles are on the rise. These climbers are Belgian, Cream Ale, and fruit beer. Conversely, Lager, Red Ale, and Witbier slipped down the list. Interestingly, Witbier slid four slots on iPourIt’s top 15 beer styles list. For the first time since iPourIt has been releasing reports, Seltzer made it onto the list, claiming the 11 spot.

Another interesting bit of data concerns consumer preferences. IPA may be the beer style seeing the most pours but domestic Lagers and light Ales are the top-selling products across iPourIt systems. The platforms interprets this as consumers trying small samples of IPA but going with Lagers and Ales for full serves.

Top Beer Pours by Category

Helpfully, iPourIt breaks down their Pour Report into several categories. So, let’s take a look at the top five from several of their lists.

As for the top products poured overall, Michelob Ultra claims the top spot. In descending order, it’s followed by Bud Light, Golden Road Mango Cart, Ace Pineapple Cider, and Modelo Especial.

For domestic pours, numbers one and two are the same as above. However, Coors Light, Miller Lite, and Pabst Blue Ribbon. The top five import products are Modelo Especial, Delirium Tremens, Rekorderlig Strawberry-Lime, Stella Artois, and Dos Equis Lager Especial.

Switching gears to craft and microbrew, Mango Cart claims the number one spot. Numbers two through five are Space Dust, 805, Kona Big Wave, and Big Storm Oak & Stone Snowbird Pilsner.

Of course, the report goes much deeper than just those four categories. There’s also the top 25 IPAs, and the top 15 Lagers, Ciders, Hefeweizens, Sours, Stouts, Blonde Ales, Pilsners, and Pale Ales.

New for the annual Pour Report are the top 15 fruit beers and Seltzers.

Key Wine Takeaways

Before we proceed, iPourIt systems aren’t limited to beer and wine. If it’s a beverage without pulp or sediment intended to be poured cold, iPourIt can handle it.

So, cold brew coffee, kombucha, sodas…these are all revenue-generating serves to pour alongside beer and wine.

Now, onto the 2021 report. The key wine takeaway focuses on sparkling wine. In short, sparking wines have proven popular with iPourIt patrons. So, the platform suggests using their systems to offer guests build-your-own Mimosas, as well as promoting self-serve as an enhancement to brunch.

Addressing the top-performing wines for iPourIt systems, the top five overall in descending order are:

  1. Boca Barrel Boca Frizzante
  2. Starborough Sauvignon Blanc
  3. Carletto Prosecco (up two spots)
  4. Stemmari Pinot Grigio
  5. Archer Roose Bubbly

Boca Frizzante is a “Prosecco-style” white wine sparkler. Archer Roose Bubbly is also a Prosecco-style white. An actual Prosecco climbed the top 10 to reach spot number three. Essentially, three Proseccos are among the top five most-poured wine products for iPourIt patrons.

Interestingly, the top five are all white wines. In fact, there are only two reds among the top ten, both of them Cabernet Sauvignons.

Image: Josh Olalde on Unsplash

by David Klemt David Klemt No Comments

What’s Up with Meat, Poultry and Seafood?

What’s Up with Meat, Poultry and Seafood?

by David Klemt

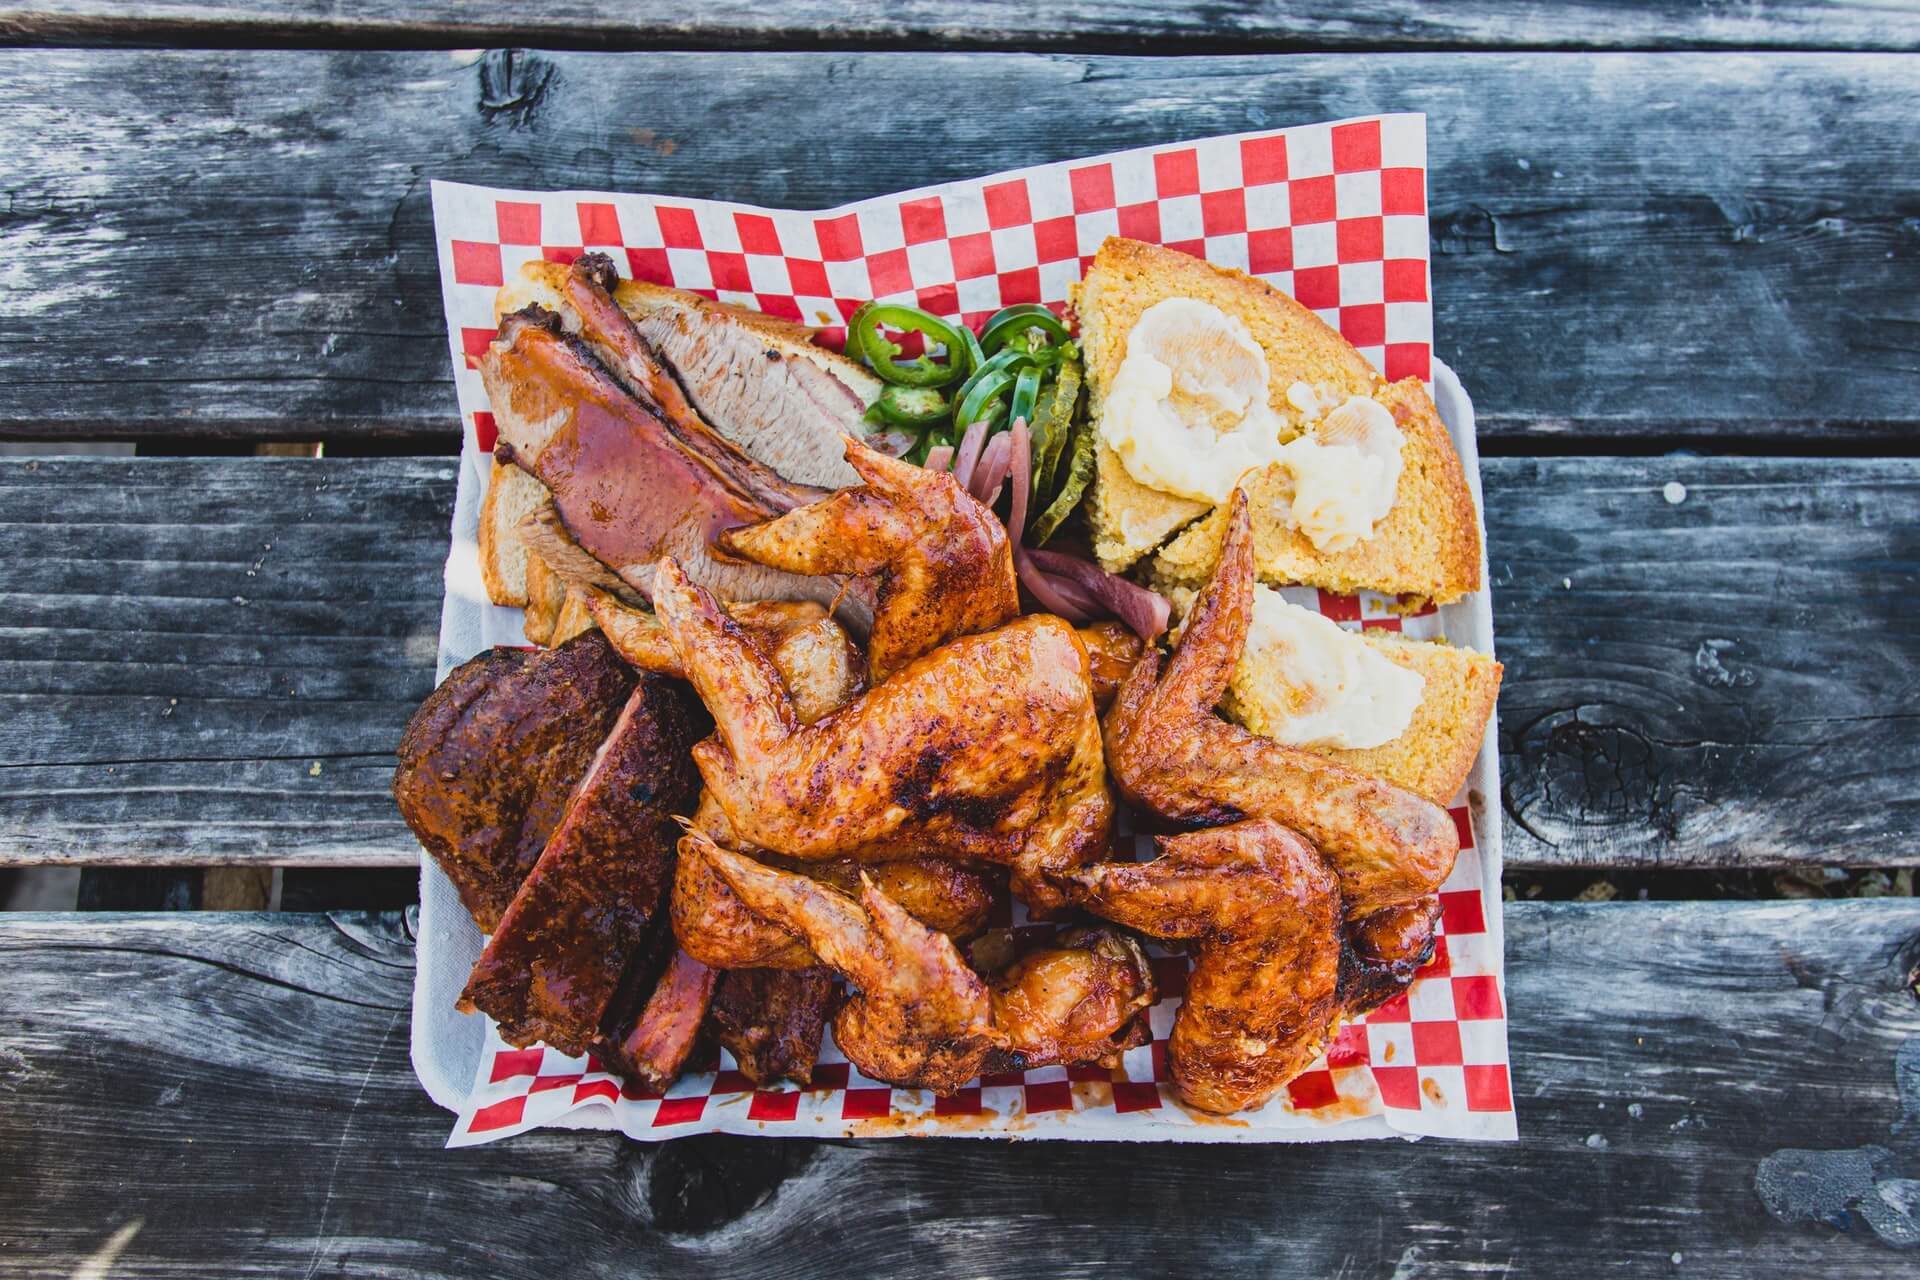
Barbecue food plate on wooden table

We know how plant proteins are performing with consumers but what do we know about how meat, poultry, and seafood are doing?

Well, because of a recent report from Datassential, we know many consumers are “meat-limiters.” And research from the World Resources Institute shows that plant-based performance is nuanced.

Interestingly, the performance of animal proteins on-premise appears to be following a beverage trend: Moderation. According to Datassential, more consumers are reducing their consumption of meat and poultry than increasing it in comparison with 2021.

So, meat-limiters may be indicative of the future of meat consumption.

Consumer Shifts

As the name implies, meat-limiters are limiting or otherwise reducing their consumption of animal proteins. Importantly, it doesn’t appear that a significant percentage of consumers are eliminating animal proteins from their diets.

Rather, many people are simply increasing the amount of plant-based items they’re eating. However, that increase is more aspirational than real in some cases.

Per Datassential’s survey of 1,500 consumers in the US, just over 70 percent of people are meat eaters. In contrast, nearly 25 percent are “flexitarian.” Just two percent are vegan or pescatarian, and only three percent are vegetarian.

So, the vast majority of Americans are still consuming meat, poultry, and seafood. We just now have reason to believe that more consumers may be leaning toward a flexitarian diet.

A bit over a quarter of consumers consume meat every day. Still, many people aspire to eat more vegetables, fruits, and whole grains, per Datassential.

However, there are more pescatarians, vegans, and vegetarians among Gen Z than the overall population. According to Datassential, this could indicate a shift away from animal proteins in the future.

Meat Performance is Nuanced

Just like plant-based performance, meat performance is nuanced. There are many factors at play.

Shifts in what consumers value are driving changes to the performance of proteins. Health, sustainability, the climate, taste, and affordability have an effect on all proteins, animal and plant.

Undeniably, inflation and shaken consumer confidence are impacting protein performance. Everything, it seems, is more expensive at the moment. Generally speaking, animal proteins are pricier than plant-based items.

It makes sense, then, that some consumers are reducing their intake of animal proteins and filling that void with fruits, veggies, and legumes.

Of particular note are shifts in daily and weekly consumption of animal proteins in 2022. Meat consumption once or more per week—beef, lamb, pork, veal—is up three percent. However, there’s a ten-percent increase in consumers eating poultry once or more per week.

Interestingly, daily poultry consumption is down seven percent in comparison with 2021. Likewise, daily consumption of seafood is also down seven percent, and fewer people are consuming it less than once per week.

Plant-based is Down

Despite what some would think, meat-limiters don’t appear to be driving up plant proteins significantly.

In fact, according to Datassential, the daily consumption of plant-based proteins is down. Per the research firm, seitan, tempeh, and tofu are the experiencing the greatest drop in daily consumption.

The fact is that across generations, more consumers eat animal proteins on a daily basis than their plant-based counterparts. Gen Z, per Datassential, consumes more animal proteins on a daily basis than other generations.

So, how does it make sense that people are reducing their meat intake but plant-based isn’t seeing a sizable jump in consumption?

In part, the answer is the growing popularity of plant-forward dishes. These are items, like bowls, that offer a small amount of meat, poultry, seafood or dairy. The majority of these menu items consists of plants but are not free of animal proteins completely.

The path forward may indeed be a plant-forward menu. Of course, this is heavily reliant on a specific concept or brand. Still, it’s likely many restaurants can do well offering mixed dishes, those heavier on plant proteins than animal proteins.

Image: Peter Pham on Unsplash

Note: This article is based on information from Datassential’s “2022 Plant-Forward Opportunity” report. To access a number of free reports, sign up with Datassential today.

by David Klemt David Klemt No Comments

What Consumers Expect from Delivery

What Consumers Expect from Delivery

by David Klemt

Delivery or takeout food order in brown paper bag

Consumers are developing specific behaviors and opinions regarding delivery that impact their perception of restaurants and brands.

Over the course of two years and three surveys, Deloitte has attempted to learn more about consumers and delivery.

In total, Deloitte surveyed 1,550 restaurant customers. Additionally, the multinational interviewed highly positioned executives from ten casual, fast-casual, and QSR brands.

What Consumers Want

First, it should come as no surprise that delivery is here to stay. None of Deloitte’s survey results indicate otherwise.

In fact, it appears that some consumers are showing an interest in additional delivery methods. Half of survey respondents are willing to try driverless or drone delivery.

More than half—64 percent—don’t expect to return to pre-pandemic dining habits by March of this year. Illustrating the habit of ordering takeout and delivery, 61 percent of respondents engage with restaurants that way at least once per week. That represents a 32-percent increase from June 2020 to September 2021.

When dining off-premise, 57 percent of Deloitte survey respondents prefer to place orders via an app. However, 40 percent of respondents prefer a restaurant’s own branded website or app. That shows that:

  1. A restaurant’s website matters. A significant percentage of consumers want to get information, get a feel for a restaurant, and place orders with a business directly.
  2. Direct delivery is feasible. Consumers want to know and feel as though they’re supporting a restaurant directly rather than a third-party business.

Own the Delivery Experience

Of course, quality is a concern with consumers who place delivery orders. This points to another pitfall regarding third-party delivery beyond the fees.

Unfair as it is, three out of five restaurant customer survey respondents have quality expectations. Specifically, they expect the same food experience off-premise as they receive on-premise. That means the same quality and the same freshness.

They also indicate that wait times of up to 30 minutes are acceptable. Here’s where the risk to restaurants comes into play. Consumers will fault the restaurant for late orders; cold food (or melted or room-temperature food for cold items); iced drinks becoming watered down; and other order issues even if they’re delivered by third-party services.

So, operators must look into and invest into what they can to improve the quality of delivery orders. Containers that keep hot food hot, French fries and other fried foods crisp, and cold foods cold are paramount.

Unfortunately, problems that occur after an order has left a restaurant—which are out of the business’ hands—are often attributed to the venue. Another reason, then, to consider and implement direct delivery.

Image: Yu Hosoi on Unsplash

by David Klemt David Klemt No Comments

Global Cuisine Performance

Global Cuisine Performance

by David Klemt

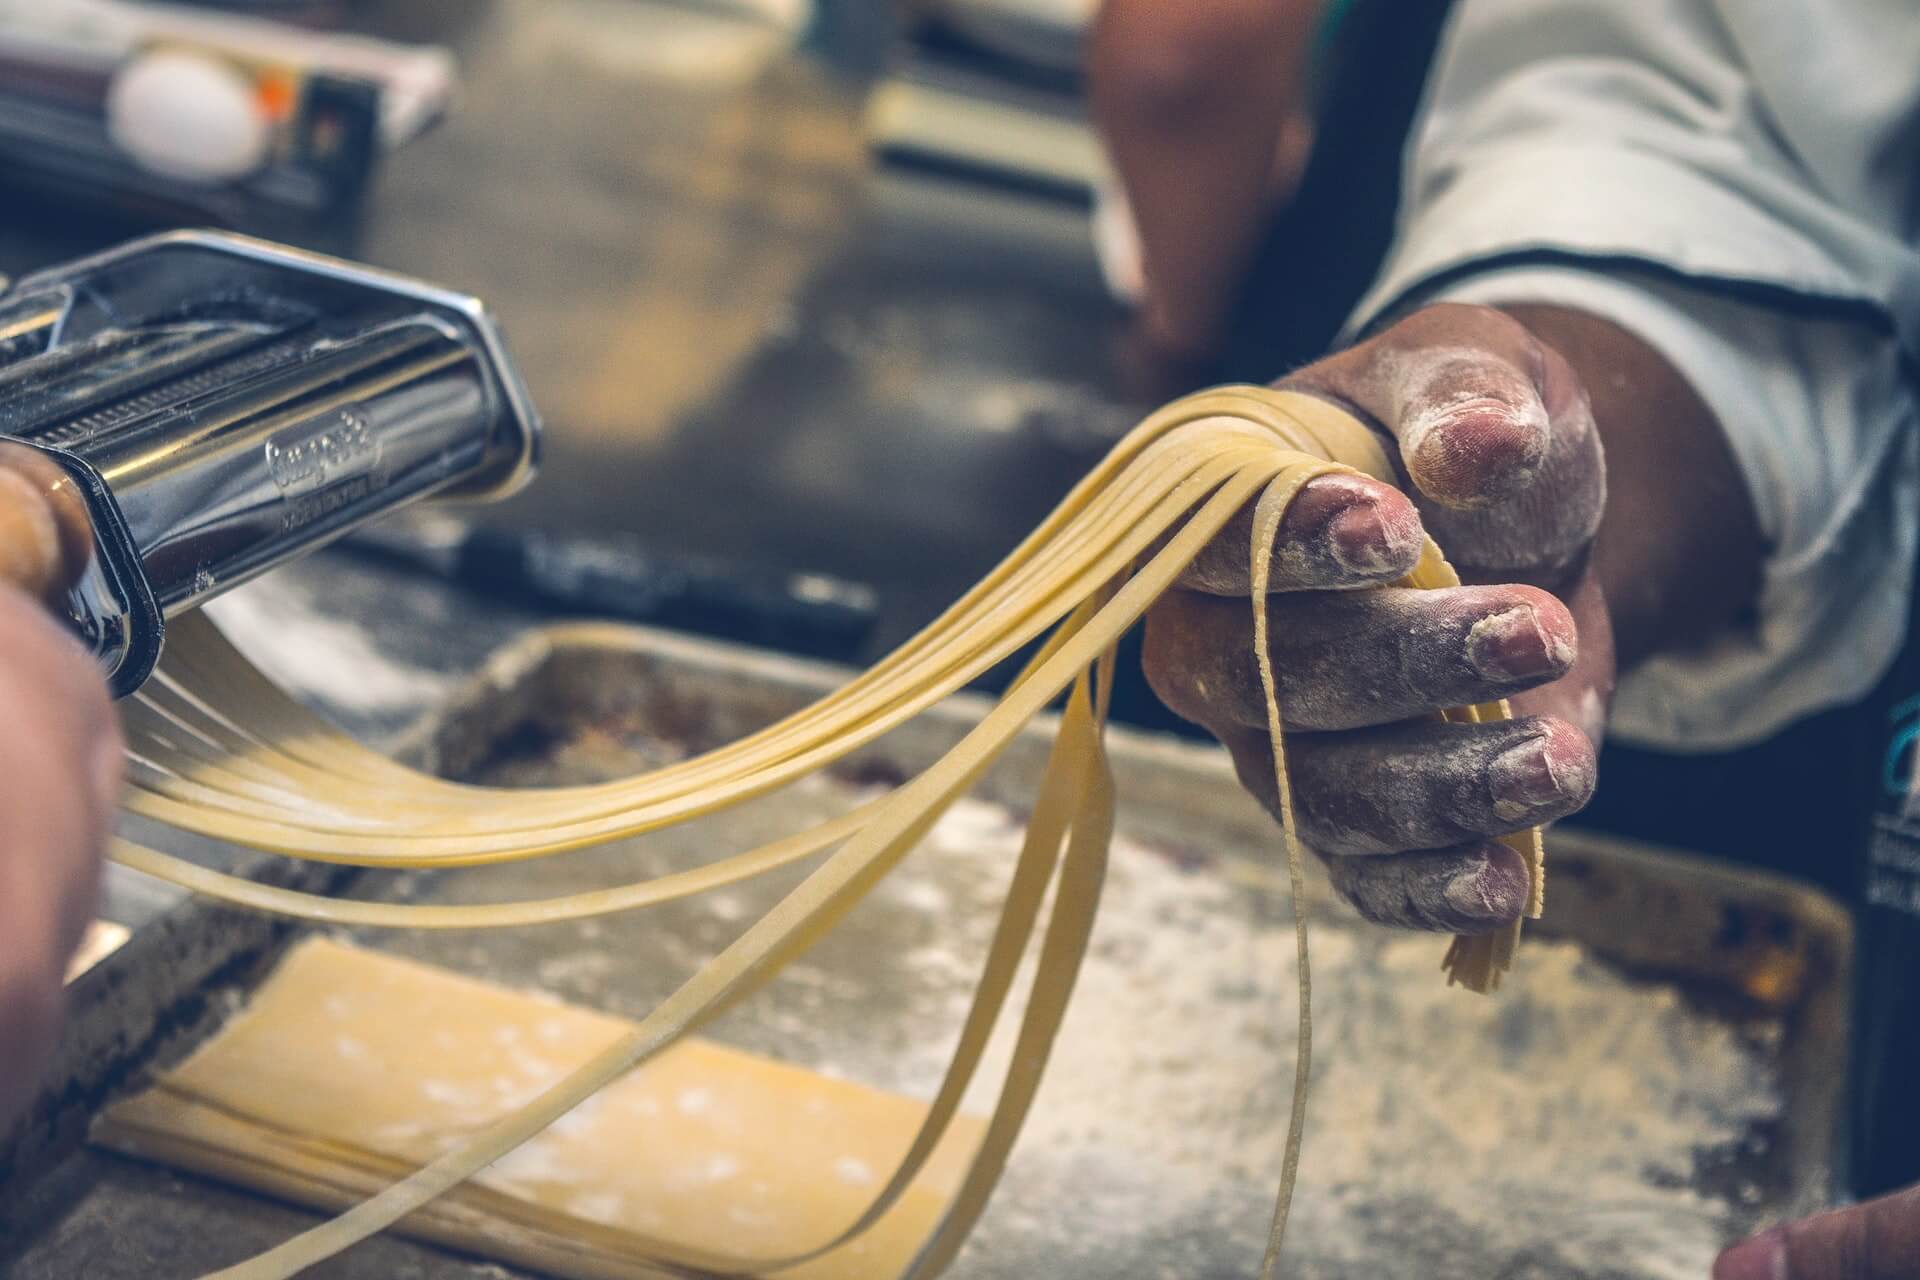
Cook making handmade pasta noodles

We don’t have a crystal ball to help us see which cuisines will be most popular. Obviously, the same holds true for knowing which are just now getting recognition.

However, we do have the next-best thing: data from Datassential.

Recently, the food and beverage analytics firm ranked dozens of global cuisines according to their current state of popularity among diners.

Then, they shared that information in October during their “Around the World in 80 Trends” webinar.

“Ubiquity”

When analyzing food and beverage trends, Datassential funnels them into four distinct designations: Inception, Adoption, Proliferation, and Ubiquity.

Arguably, once a trend reaches Proliferation and Ubiquity it becomes a mainstay. So, we can more than likely stop referring to it as a trend.

Now, the two most precarious stages for a trend are Inception and Adoption. Plenty of trends die on the Inception vine. Several won’t make it out of Adoption.

When you see Datassential’s list of global cuisines that fly under the Ubiquity banner, I doubt there will be much surprise:

  • Italian
  • Southern
  • Mexican
  • Creole/Cajun
  • Tex Mex
  • Chinese

So, any shocks to your system there? Most likely not.

“Proliferation”

Another to label this Datassential designation is “second most popular.” Each of these cuisines has a clear shot at reaching Ubiquity.

In fact, I find one of the global cuisines in this category surprising. It’s the first one in this list:

  • Japanese
  • Regional Italian
  • Regional Mexican
  • Greek
  • Mediterranean
  • Regional US
  • Southwestern
  • Cuban

As you’ll see, the lists grow longer steadily as we move down from Ubiquity.

“Adoption”

For me, it’ll be interesting to review follow-up data from Datassential regarding global cuisines.

As such, I’m eager to learn which cuisine from the list below reaches Proliferation in 2022:

  • Caribbean
  • Indian
  • French
  • Regional Chinese
  • Oaxacan
  • German
  • Middle Eastern
  • Korean
  • Ashkenazi
  • Hawaiian
  • Vietnamese
  • Venezuelan
  • Spanish
  • Sicilian
  • Jamaican
  • Israeli
  • Thai
  • British

To be honest, my first reaction to seeing French cuisine under the Adoption banner was surprise. Of course, I then thought back to how many French restaurants we have here in Las Vegas.

Sure, this little city in the desert is a foodie destination. However, French restaurants don’t dot the landscape like those that focus on other cuisines.

“Inception”

That brings us to the first stage of any trend: Inception.

Now, the first thing you’ll notice is that this category contains the most global cuisines. Whereas Adoption features 18, Proliferation lists eight, and a mere six have reached Ubiquity, Inception identifies two dozen.

They are as follows:

  • Brazilian
  • Mizrahi
  • Russian
  • Malaysian
  • Croatian
  • Moroccan
  • Lebanese
  • South African
  • Native American
  • Central American
  • Argentinian
  • Peruvian
  • Filipino
  • Appalachian
  • Sephardic
  • Ethiopian
  • Senegalese
  • Scandinavian
  • Sonoran
  • Nigerian
  • Iranian
  • Persian
  • Turkish
  • Polish

Again, there are some surprises here, at least for me. For example, I expected Ethiopian cuisine to have reached Adoption by now.

Takeaways

Of course, there are multiple ways to interpret this data.

First, you can embrace Ubiquity, leveraging their incredible popularity. However, standing out and building traffic will be challenging.

Second, you can feature Proliferation cuisine. Sure, these have yet to reach the Ubiquity stage. But they’re close to doing so, and you’ll also face stiff competition.

Third, focusing on cuisine from the Adoption designation involves taking a risk but mitigating it somewhat. These cuisines are developing a following and guest demand.

Finally, the riskiest move, depending on location: featuring Inception cuisines. But with risk comes reward. Identify a gap in a certain area—something we can do with our signature feasibility studies—and you may realize staggering success.

So, what do you think? Did you find any of Datassential’s designations surprising for certain cuisines? Let us know on our Instagram, Facebook, Twitter or LinkedIn pages!

Image: Jorge Zapata on Unsplash

by David Klemt David Klemt No Comments

How is Plant-based Performing?

How is Plant-based Performing On-premise?

by David Klemt

Plant-based food bowl

With plant-based food options making their way to global fast food chains, it’s clear the category is continuing to heat up.

In fact, it’s likely time to stop referring to plant-based menu items as a trend. Obviously, they’re here to stay.

But how are these items actually performing on-premise? Is the category experiencing real growth or barely noticeable?

“Proliferation”

We’re full throttle into the holiday season. People are focusing on spending time with family and friends.

And what does that mean? Gathering for meals.

So, if restaurant traffic is going to tick up, it makes sense to see if plant-based should be more prevalent on menus.

To that end, Datassential revealed data on this category two weeks ago during their “Holidays Ahead!” webinar. Of four trend-tracking designations—Inception, Adoption, Proliferation, Ubiquity—Datassential notes plant-based menu items are in the Proliferation stage on-premise.

Analyzing data from 2011 to 2021, Datassential showed that the category started growing in terms of menu placement in 2018. As of this year, plant-based items are on nearly five percent of restaurant menus.

That may not seem like impressive growth. However, there was zero-point-zero-percent growth between 2011 and 2014. In 2015 and 2016, Datassential shows that only 0.1 percent of restaurants offered plant-based menu items. That growth doubled in 2017 (0.2 percent), then doubled again in 2018 (0.4 percent).

In 2019, the category quadrupled to inclusion on 1.6 percent of restaurant menus. Last year, that growth more than doubled to 3.5 percent.

According to Datassential, 28 percent of consumers like or love plant-based menu items. Interestingly, the research agency finds that all types of consumers like plant-based items, not just vegetarians or vegans.

The Datassential breakdown of plant-based menu proliferation by restaurant category is as follows:

  • Fast Casual: 11.5%
  • Casual Dining: 5.4%
  • Midscale: 3.9%
  • Quick Service: 3.4%
  • Fine Dining: 1.8%

Chains are more likely, at this time, to feature plant-based menu items.

Upscale Options

Wanting to include plant-based options and knowing where to start are two different things.

As it happens, Datassential featured a timely real-world menu to that should inspire operators this season.

Watercourse Foods in Denver, Colorado, offers mains and sides that will resonate with holiday diners:

  • Seitan Roast (wheat, soy, blend of herbs) which stands in for roast turkey.
  • Pot Pie consisting of carrots, celery, onions and mushroom.
  • Root Vegetable Stuffing made with root veggies (obviously), savory herbs, and housemade bread.
  • Mac and Cheese featuring shells tossed in cheese fondue and topped with shiitake “bacon” bits and breadcrumbs.

As you’ll notice, you don’t need to limit your menu to products from Beyond or Impossible. Obviously, you can leverage their brand recognition but you can also utilize your current plant-based inventory to create housemade menu items.

If you’re ready to embrace plants at your restaurant or bar, activate your kitchen team. With a bit of creativity you can take advantage on the rise in popularity of everything plant-based.

Image: Hermes Rivera on Unsplash

by David Klemt David Klemt No Comments

Consumers May Keep Eating at Home

Consumers May Keep Eating at Home

by David Klemt

Friends and family around a dinner table at home

A recent report suggests that consumer interest in eating at home more will continue even after we return to “normal.”

This is the finding from a survey conducted by the Food Industry Association (FMI)l, formerly known as the Food Marketing Institute.

The FMI surveyed grocery shoppers to determine habits influenced by the pandemic.

Emphasis on Nutrition

I look to a wide variety of sources to analyze consumer behavior. Even their grocery habits can be valuable for operators to know.

In this case, knowing about the dining habits of today’s consumer provides important insights. For instance, knowing what types of food items shoppers are purchasing can be very telling.

Per the FMI, nearly half of survey respondents (49 percent) indicate they’re choosing healthier foods when grocery shopping. Clearly, living through a public health crisis is influencing this decision.

Today’s consumer, with more information at their fingertips and the purchasing power to demand more transparency from company’s, has become increasingly focused on their health. That interest grew stronger during the pandemic as a healthier lifestyle can lead to a reduced risk for illness.

This particular finding should tell operators a few things. First, they may want to consider updating their menus with healthier items. Second, that’s not limited to food—many guests are interested in no- and low-ABV drinks. Third, operators who use healthier ingredients should make that clear via their menu item descriptions.

At-home Dining

The FMI also found that 41 percent of survey respondents plan to prepare and enjoy more meals at home moving forward than they did before the pandemic.

That ties directly to 44 percent saying they “like” or ‘love” cooking at home more now.

While this survey was intended to provide consumer behavior insights for grocers, there’s clearly value for operators.

As many learned during the pandemic, guests are interested in supporting restaurants and bars buy ordering meal and cocktail kits.

Since it’s important to meet guests where they are, operators may want to keep such kits on offer. People have shown they’re eager to engage with restaurants and bars via virtual tastings and cooking classes. Clearly, many are also happy to order meal kits from restaurants to make in the comfort of their own homes.

Yes, there’s pent-up demand set to be unleashed. And yes, people are eager to get back out there and socialize. But there are also financial, health, and safety concerns that will keep some people from dining out as often as they did pre-pandemic.

That doesn’t mean they’re out of reach of restaurants and bars entirely. However, it does mean operators will need to adapt and get creative to earn their business.

Image: fauxels from Pexels

Top