Data

by David Klemt David Klemt No Comments

iPourIt Releases Fourth Annual Pour Report

iPourIt Releases Fourth Annual Pour Report

by David Klemt

Black and white beer taps

Self-serve beverage platform iPourIt’s informative fourth annual Pour Report identifies their top beer and wine pours from 2021.

iPourIt is a pioneer in the self-serve space, enhancing the guest experience and boosting revenue. However, their annual reports are another key reason operators should consider this platform.

Unlike other industry platforms, iPourIt doesn’t limit their resources to clients. Nor do they place resources like their annual Pour Report behind a pay wall. So, this is a transparent company that clearly views their relationships with clients as partnerships.

You can check out their resources for yourself by following this link. To download a copy of the 2021 Annual Pour Report, click here.

Below you’ll find key datapoints from the latest iPourIt report. I encourage you to download and review the report in its entirety.

Key Demographic Information

When it comes to men and women using iPourIt self-serve systems, men are respsonsible for 64 percent of total ounces poured.

On average, men served themselves 6.4 ounces per pour and spent $14.21 on iPourIt per visit. For men, the top pours were IPA, Lager, Cider, Hefeweizen, and Sour.

Conversely, women served themselves nearly 11 million ounces via iPourIt systems. That’s 36 percent of total ounces poured.

On average, women served themselves 5.3 ounces per pour and spent $11.95 per visit. For women, the top pours were Cider, IPA, Sour, Lager, and Hefeweizen.

Interestingly, the top pour for both men and women was Michelob Ultra.

Key Beer Takeaways

The 2021 Pour Report analyzes data from more than 300 iPourIt systems, over 8,800 taps, and 49 million total ounces of beer and wine poured.

In total, patrons consumed nearly 14,600 total products. Further, the data above represents 1.9 million guests served 3.1 million pints. Compellingly, that’s $26.2 million in revenue generated by iPourIt systems.

In terms of iPourIt systems and patrons, cider claimed the number two slot for the top 15 poured beer styles. Perhaps unsurprisingly, IPA claims the top spot. In fact, iPourIt systems served more than 10 million ounces of IPA.

As far as beer styles that are growing in popularity, three styles are on the rise. These climbers are Belgian, Cream Ale, and fruit beer. Conversely, Lager, Red Ale, and Witbier slipped down the list. Interestingly, Witbier slid four slots on iPourIt’s top 15 beer styles list. For the first time since iPourIt has been releasing reports, Seltzer made it onto the list, claiming the 11 spot.

Another interesting bit of data concerns consumer preferences. IPA may be the beer style seeing the most pours but domestic Lagers and light Ales are the top-selling products across iPourIt systems. The platforms interprets this as consumers trying small samples of IPA but going with Lagers and Ales for full serves.

Top Beer Pours by Category

Helpfully, iPourIt breaks down their Pour Report into several categories. So, let’s take a look at the top five from several of their lists.

As for the top products poured overall, Michelob Ultra claims the top spot. In descending order, it’s followed by Bud Light, Golden Road Mango Cart, Ace Pineapple Cider, and Modelo Especial.

For domestic pours, numbers one and two are the same as above. However, Coors Light, Miller Lite, and Pabst Blue Ribbon. The top five import products are Modelo Especial, Delirium Tremens, Rekorderlig Strawberry-Lime, Stella Artois, and Dos Equis Lager Especial.

Switching gears to craft and microbrew, Mango Cart claims the number one spot. Numbers two through five are Space Dust, 805, Kona Big Wave, and Big Storm Oak & Stone Snowbird Pilsner.

Of course, the report goes much deeper than just those four categories. There’s also the top 25 IPAs, and the top 15 Lagers, Ciders, Hefeweizens, Sours, Stouts, Blonde Ales, Pilsners, and Pale Ales.

New for the annual Pour Report are the top 15 fruit beers and Seltzers.

Key Wine Takeaways

Before we proceed, iPourIt systems aren’t limited to beer and wine. If it’s a beverage without pulp or sediment intended to be poured cold, iPourIt can handle it.

So, cold brew coffee, kombucha, sodas…these are all revenue-generating serves to pour alongside beer and wine.

Now, onto the 2021 report. The key wine takeaway focuses on sparkling wine. In short, sparking wines have proven popular with iPourIt patrons. So, the platform suggests using their systems to offer guests build-your-own Mimosas, as well as promoting self-serve as an enhancement to brunch.

Addressing the top-performing wines for iPourIt systems, the top five overall in descending order are:

  1. Boca Barrel Boca Frizzante
  2. Starborough Sauvignon Blanc
  3. Carletto Prosecco (up two spots)
  4. Stemmari Pinot Grigio
  5. Archer Roose Bubbly

Boca Frizzante is a “Prosecco-style” white wine sparkler. Archer Roose Bubbly is also a Prosecco-style white. An actual Prosecco climbed the top 10 to reach spot number three. Essentially, three Proseccos are among the top five most-poured wine products for iPourIt patrons.

Interestingly, the top five are all white wines. In fact, there are only two reds among the top ten, both of them Cabernet Sauvignons.

Image: Josh Olalde on Unsplash

by David Klemt David Klemt No Comments

Datassential Identifies Top Design Trends

Datassential Identifies Top Design Trends

by David Klemt

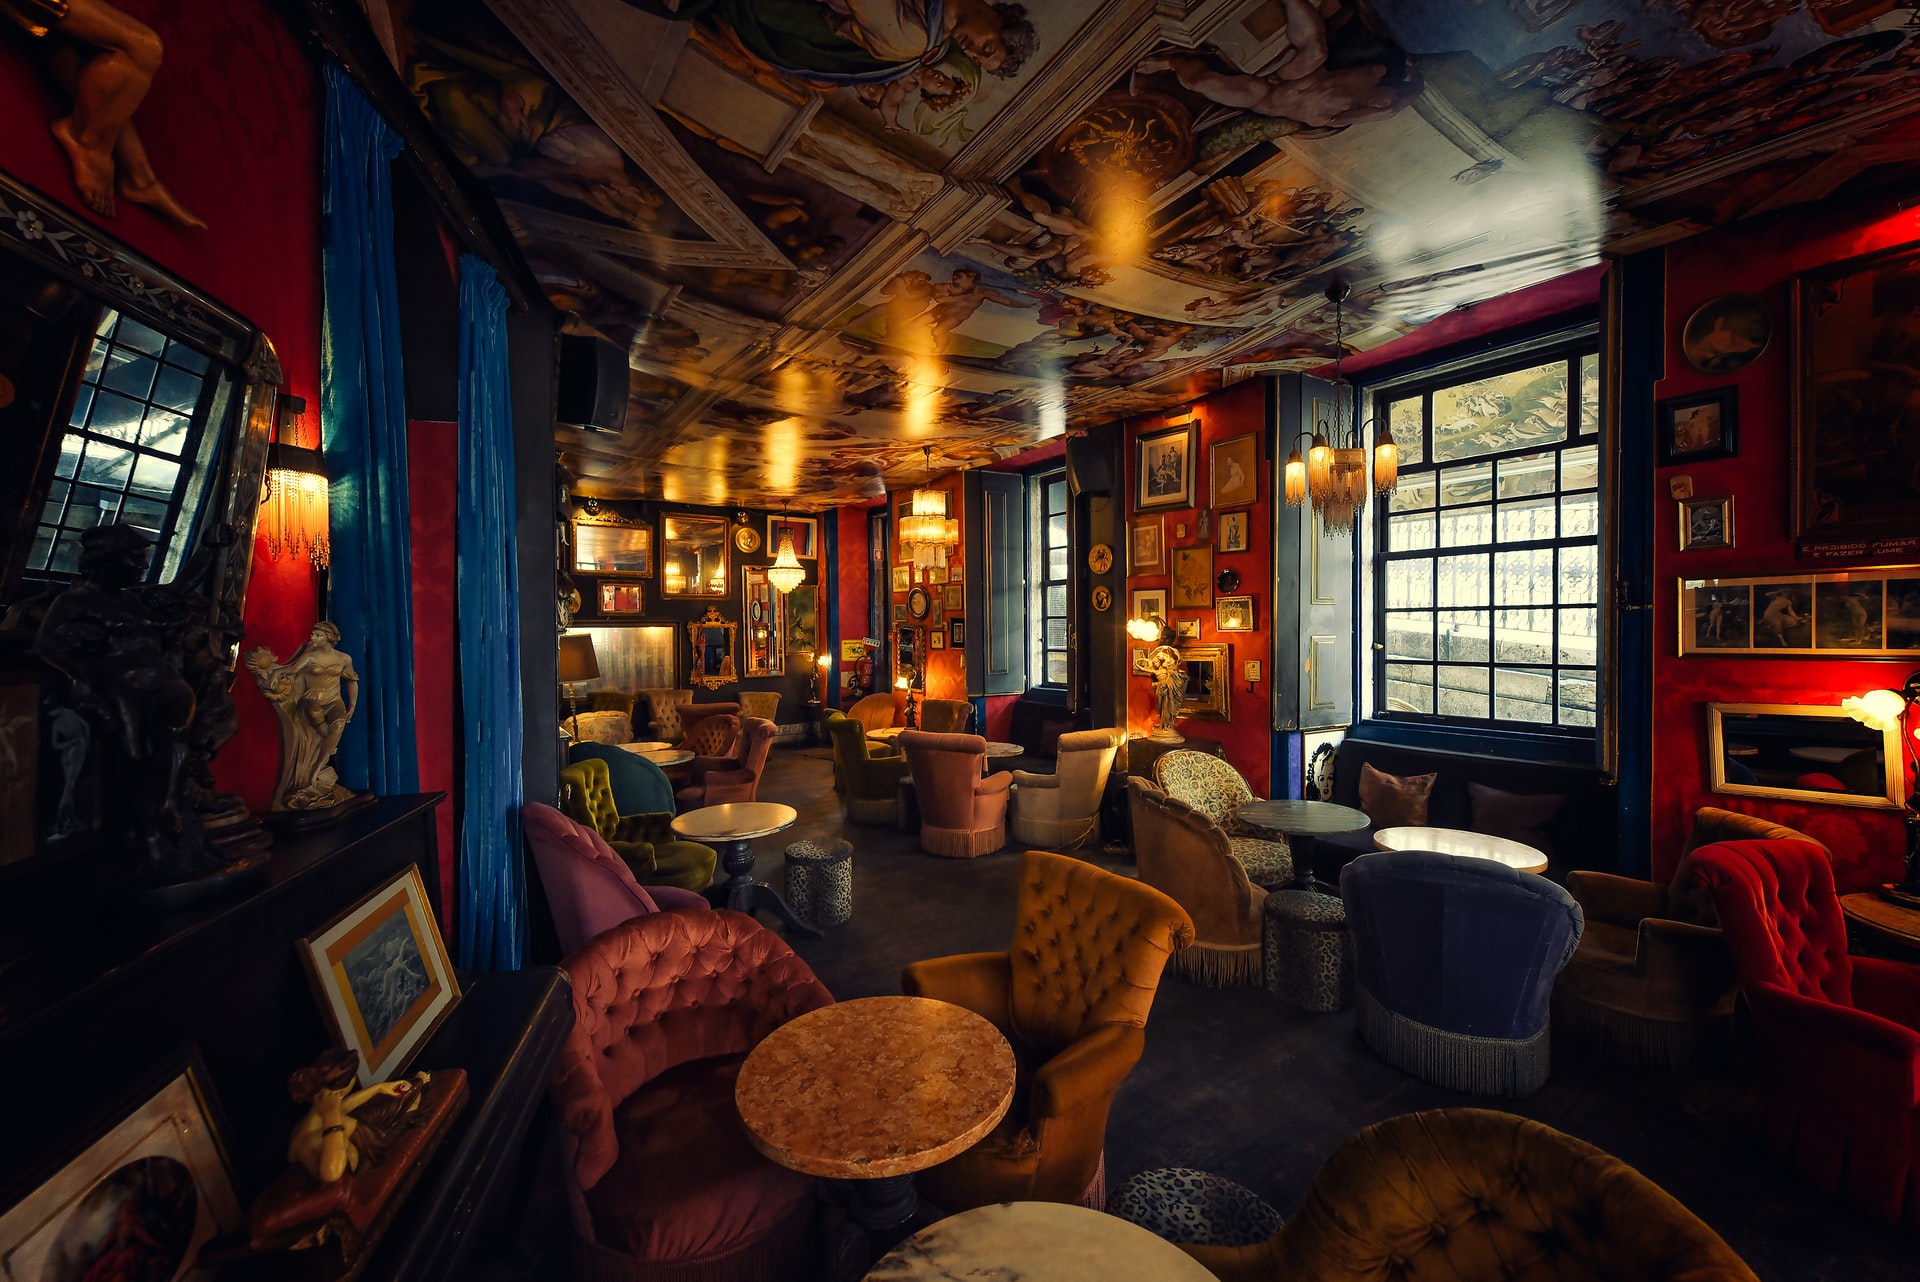
Maximalist interior bar or restaurant design

For their latest FoodBytes research topic, Datassential tackles some of the top restaurant design trends.

Click here to download Datassential’s “Foodbytes: Restaurant Design Trends” report. If you haven’t already, you’ll need to sign up for FoodBytes reports.

As the title states, this Datassential resource addresses the state of restaurant design. Now, we recommend reading the report for yourself but below you’ll find the points that really stand out to us.

If you’re among the 22 percent of operators that Datassential says are either considering a dining room redesign or have completed one, this report is particularly relevant to you.

Back-0f-house Design

Unsurprisingly, most people envision the interior dining area when considering restaurant design. However, as Lauren Charbonneau of Reitano Design Group says in Datassential’s latest FoodBytes, “Restaurants are living spaces that need to be agile.”

That means considering the entire space, not just the front of house. There’s also this stat from Datassential: 64 percent of operators think shrinking their footprint would be detrimental. If that’s the case, making the BoH smaller rather than the front may be the way forward.

So, let’s take a look at what Charbonneau identifies as BoH design trends to consider.

Clearly, it’s crucial operators consider their back-of-house teams. Providing a better workplace experience and improving efficiency can be done through design. Per Charbonneau, operators can use clever design and equipment choices to reduce steps, movement, labor, footprint, and costs.

Additionally, sustainability is not only crucial to responsible operation, being sustainable can reduce costs. Selecting Energy Star, Water Sense, and multi-functional equipment can make tasks easier for BoH teams, make a business more sustainable, and, again, drive down costs.

Maximalist Design

Finally, it seems, the minimalist design trend is losing its stranglehold on restaurant design. Of course, if that approach and design language works for a particular concept, it works.

However, maximalism is growing in popularity. For this type of design, think lots of color and bold patterns. Then, think about using multiple patterns and textures, including on the floors.

So, wallpaper, artwork, plush seating, loud tiles… Per Datassential, maximalism appeals to younger guests. In part, this is because these spaces can offer so many Instagrammable moments.

Monochrome Design

Okay, before we begin, “monochrome” doesn’t only mean a black-and-white palette. While that can work very well depending on the concept, monochrome also means using different tones of a single color.

Of course, there are multiple ways to approach this design trend. For example, if one does want to select a black-and-white scheme, Matte Black Coffee in Los Angeles is compelling.

Not only is the design monochrome, guests feel as though they’re inside a two-dimensional image. Per Datassential, this type of design is growing in popularity across the US specifically.

In terms of colorful monochrome, a great example is NYC’s Pietro Nolita. Not only have they chosen pink for their palette, it’s a core element of their branding: Pink AF.

Yet another way to approach this trend is for operators to use varying tones of particular colors to delineate different spaces. So, the dining room may be tones of pink while the bar is green and a private dining room is blue.

Nostalgic Design

As we’re all well aware, the pandemic derailed people’s plans. In particular, people hit the pause or cancel button on travel and vacations. Now, people appear to restarting their travel plans and getting back out there.

However, we’re also dealing with inflation. So, many people are holding off on spending money on travel. This is where restaurant design comes into play.

According to Datassential, “nostalgic escape” is a trend to watch moving forward. While very specific, this trend combines a dive into the past and capturing vacation vibes.

Per their FoodBytes report, Datassential identifies the following elements as key to this design approach:

  • Soft shades of colors. In particular, pink.
  • Tropical designs.
  • Fifties, Eighties, and Nineties design elements.

One concept that leverages this trend and did so before the pandemic is the Hampton Social. Currently, there are eight locations and two more are on the way.

Of course, it’s imperative that operators commit only to design language that’s authentic to their concepts. Pursuing a trend simply to pursue it is a clear path to disaster. That said, these design trends have massive appeal and can work for many operators and their brands.

Image: Davide Castaldo on Unsplash

by David Klemt David Klemt No Comments

US Cities with Greatest Outflow and Inflow

US Cities with Greatest Outflow and Inflow

by David Klemt

Brickell in Miami, Florida

Seattle-based real estate brokerage Redfin reveals the US cities seeing the greatest numbers of people leaving and moving in.

Obviously, real estate brokers need to know where people are selling and where they’re buying. Going deeper, they also need to know if populations are growing, remaining the same, or dwindling.

However, there’s another group of people who need this information: restaurant, bar, and hotel owners, operators, and workers.

Regardless of experience, owners and operators know site selection is one of the most important decisions they’ll make. Seriously, is there anyone who hasn’t heard the maxim, “Location, location, location” at this point?

Let’s say a new operator is considering where they should locate their business. When looking at major cities, it’s important to understand out- and inflow trends. The same holds true for operators seeking to expand. Clearly, it’s beneficial to know what cities are growing. Equally as important to consider: Is it best to open a location in the heart of the city or the surrounding suburbs?

Of course, there are considerations when looking at outflow and inflow data. For example, operators in cities seeing an influx need to strategize to leverage the area’s growth. How will they appeal to new residents? What can they do to convert them to regulars? Looking at operations, do they need to fill roles and are these new residents looking for work?

Now, when people are leaving cities in significant numbers it affects business. So, if there’s a noticeable downturn, it could be a good idea for operators to contact landlords. And for new operators, an exodus can be a bargaining chip to use during lease negotiations.

Outflow

According to Redfin, these are the top ten cities experiencing outflow.

  1. Minneapolis, Minnesota
  2. Chicago, Illinois
  3. Denver, Colorado
  4. Detroit, Michigan
  5. Boston, Massachusetts
  6. Seattle, Washington
  7. Washington, DC
  8. New York, New York
  9. Los Angeles, California
  10. San Francisco, California

Of particular note, Redfin reports that the average cost of a house in San Francisco is now over $1.5 million. No wonder so many people are leaving. Selling a home in that market can give sellers an influx of cash that will go much further elsewhere.

Inflow

Conversely, these are the ten American cities seeing the greatest inflow.

  1. Dallas, Texas
  2. San Antonio, Texas
  3. North Port, Florida
  4. San Diego, California
  5. Cape Coral, Florida
  6. Las Vegas, Nevada
  7. Sacramento, California
  8. Phoenix, Arizona
  9. Tampa, Florida
  10. Miami, Florida

Now, looking at this list, Florida is crushing it in terms of homebuyer growth. So, new and veteran operators should look into the Sunshine State for their first location or expansion.

Of course, the rest of this list is also certainly worthy of consideration, per Redfin’s data analysis. However, the brokerage notes that net inflow for Dallas, Las Vegas, Phoenix, and Sacramento is slowing in comparison to 2021.

Interestingly, to me, half of the outflow list is on Time Out’s 2022 top cities list: Boston, Chicago, Los Angeles, New York, and San Francisco. On the other hand, Miami is also on the Time Out List.

This is to say that data can be interpreted a multitude of ways, so always proceed with caution. The best way to select locations is with focused feasibility studies that drill down to particular ZIP codes and neighborhoods.

Image: Ryan Parker on Unsplash

by David Klemt David Klemt No Comments

What’s Up with Meat, Poultry and Seafood?

What’s Up with Meat, Poultry and Seafood?

by David Klemt

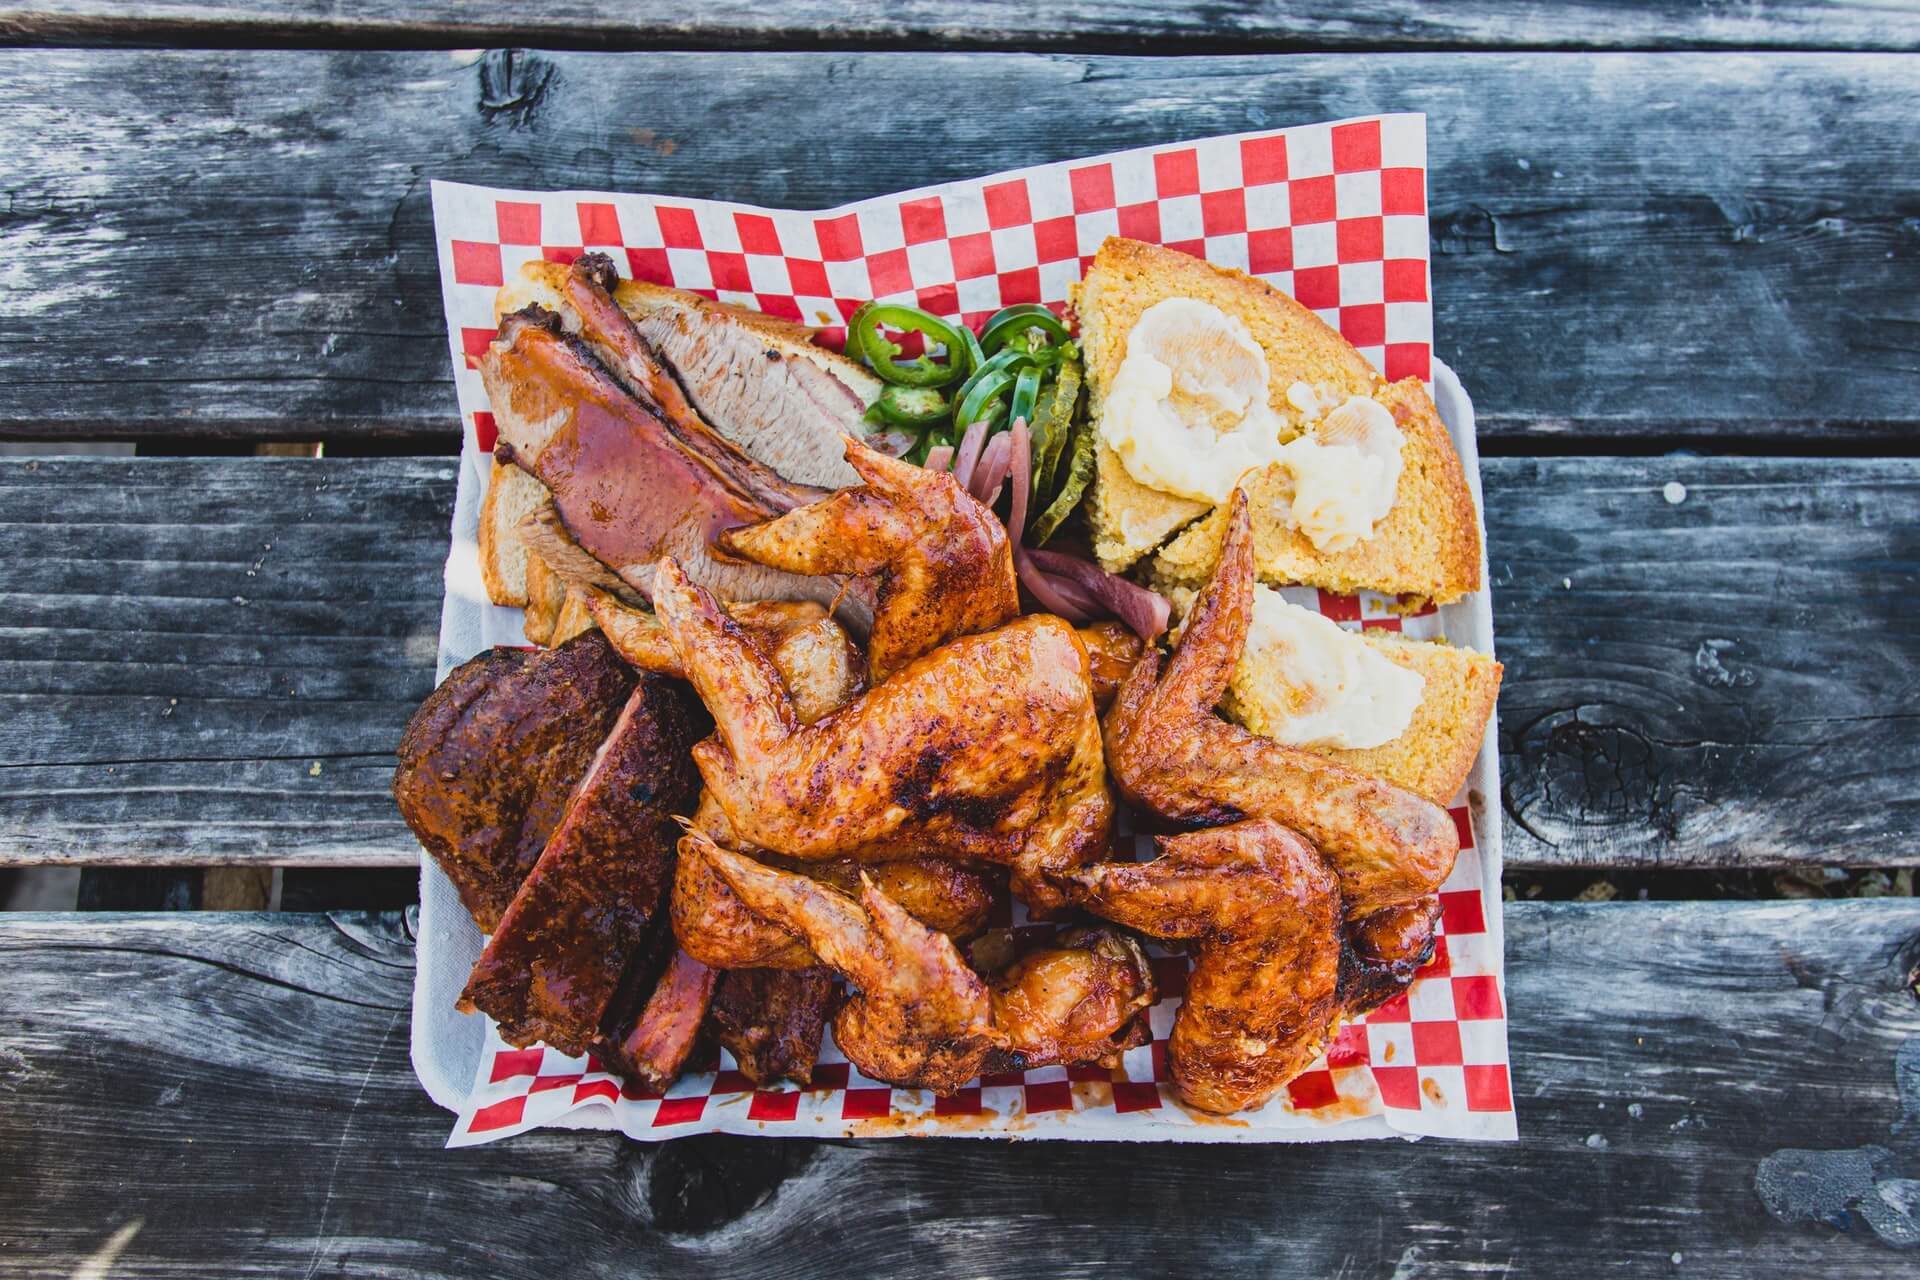
Barbecue food plate on wooden table

We know how plant proteins are performing with consumers but what do we know about how meat, poultry, and seafood are doing?

Well, because of a recent report from Datassential, we know many consumers are “meat-limiters.” And research from the World Resources Institute shows that plant-based performance is nuanced.

Interestingly, the performance of animal proteins on-premise appears to be following a beverage trend: Moderation. According to Datassential, more consumers are reducing their consumption of meat and poultry than increasing it in comparison with 2021.

So, meat-limiters may be indicative of the future of meat consumption.

Consumer Shifts

As the name implies, meat-limiters are limiting or otherwise reducing their consumption of animal proteins. Importantly, it doesn’t appear that a significant percentage of consumers are eliminating animal proteins from their diets.

Rather, many people are simply increasing the amount of plant-based items they’re eating. However, that increase is more aspirational than real in some cases.

Per Datassential’s survey of 1,500 consumers in the US, just over 70 percent of people are meat eaters. In contrast, nearly 25 percent are “flexitarian.” Just two percent are vegan or pescatarian, and only three percent are vegetarian.

So, the vast majority of Americans are still consuming meat, poultry, and seafood. We just now have reason to believe that more consumers may be leaning toward a flexitarian diet.

A bit over a quarter of consumers consume meat every day. Still, many people aspire to eat more vegetables, fruits, and whole grains, per Datassential.

However, there are more pescatarians, vegans, and vegetarians among Gen Z than the overall population. According to Datassential, this could indicate a shift away from animal proteins in the future.

Meat Performance is Nuanced

Just like plant-based performance, meat performance is nuanced. There are many factors at play.

Shifts in what consumers value are driving changes to the performance of proteins. Health, sustainability, the climate, taste, and affordability have an effect on all proteins, animal and plant.

Undeniably, inflation and shaken consumer confidence are impacting protein performance. Everything, it seems, is more expensive at the moment. Generally speaking, animal proteins are pricier than plant-based items.

It makes sense, then, that some consumers are reducing their intake of animal proteins and filling that void with fruits, veggies, and legumes.

Of particular note are shifts in daily and weekly consumption of animal proteins in 2022. Meat consumption once or more per week—beef, lamb, pork, veal—is up three percent. However, there’s a ten-percent increase in consumers eating poultry once or more per week.

Interestingly, daily poultry consumption is down seven percent in comparison with 2021. Likewise, daily consumption of seafood is also down seven percent, and fewer people are consuming it less than once per week.

Plant-based is Down

Despite what some would think, meat-limiters don’t appear to be driving up plant proteins significantly.

In fact, according to Datassential, the daily consumption of plant-based proteins is down. Per the research firm, seitan, tempeh, and tofu are the experiencing the greatest drop in daily consumption.

The fact is that across generations, more consumers eat animal proteins on a daily basis than their plant-based counterparts. Gen Z, per Datassential, consumes more animal proteins on a daily basis than other generations.

So, how does it make sense that people are reducing their meat intake but plant-based isn’t seeing a sizable jump in consumption?

In part, the answer is the growing popularity of plant-forward dishes. These are items, like bowls, that offer a small amount of meat, poultry, seafood or dairy. The majority of these menu items consists of plants but are not free of animal proteins completely.

The path forward may indeed be a plant-forward menu. Of course, this is heavily reliant on a specific concept or brand. Still, it’s likely many restaurants can do well offering mixed dishes, those heavier on plant proteins than animal proteins.

Image: Peter Pham on Unsplash

Note: This article is based on information from Datassential’s “2022 Plant-Forward Opportunity” report. To access a number of free reports, sign up with Datassential today.

by David Klemt David Klemt No Comments

Hotels, Guest Data and Guest Expectations

Hotels, Guest Data and Guest Expectations: A Chat with SevenRooms

Fountains outside Bellagio Las Vegas

We sit down with Austen Asadorian, vice president of sales at SevenRooms, to chat about pent-up demand for travel.

People are eager to get back out there and hotels, of course, play a crucial role in their travel plans. However, we’re not engaging with the same guests we were pre-pandemic.

No, today’s guest demands more from the hotels and resorts they select. And a key to delivering on guest demands is collecting guest data.

But while operators know they’re supposed to be collecting guest data, there’s some uncertainty about what to actually do with it. Enter: SevenRooms.

More accurately, meet Austen Asadorian of SevenRooms. Not only can he address meeting guest demands through tech, he can address how to use guest data responsibly and effectively.

Hi Austen, thank you for taking the time to speak with us. Can you tell us a little about yourself and your role at SevenRooms?

Thanks, David! My name is Austen Asadorian and I’m the Vice President of Sales at SevenRooms. I first started my career in hospitality early in high school, getting a job at a local restaurant in New Jersey, learning everything from protein fabrication to catering and dealing with daily customers, even managing events. I continued working in hospitality through college, while going to the Culinary Institute of America for a degree in hospitality management, and ultimately, landed at Hillstone Restaurant Group where I ran back of house operations as well as the company’s Manager Training Program. Before joining SevenRooms, I worked as Peloton’s Director of Sales, leading their go-to-market strategy for retail growth and expansion from 2014-2017.

Today, I support SevenRooms’ global expansion efforts to accelerate our goal of being the best-in-class solution for hospitality operators around the world. Having previous experience in the hospitality industry, I joined SevenRooms because I was hyper aware of the pain points in the industry surrounding technology and the need for better guest management after having lived it day-to-day for several years. More importantly, I believe in SevenRooms’ vision and have a true passion for helping hospitality businesses, big and small, drive revenue, and create loyal guests for life.

Let’s talk hotels. What does the hotel industry look like two years after (or into) the Coronavirus pandemic?

When the pandemic struck, travel came to a complete halt and hotel occupancy in the US fell from 70% in March 2019 to less than 25% in March 2020—rooms were empty. Now, as the world is back to what we can consider a new “normal,” we’re seeing an extreme surge in travel and hotels are busier than ever.

However, what guests expect from hotels experience-wise has changed and they demand more. They’re making up for lost time and they want to make it count. Coming out of the pandemic, hotel operators are taking a harder look at their entire tech stack. It’s no longer optional to have a tech stack that is fully integrated from top to bottom across their operations—it’s a must-have—and technology providers are adapting to meet those needs. Additionally, operators have put a strong emphasis on the importance of ownership over their guest data. Both trends have positioned SevenRooms incredibly well within the hotel sector, as this has been our business philosophy from day one.

How can hotel operators and managers live up to these high expectations?

The simple answer is by taking advantage of technology solutions into their everyday practices and processes. These tech solutions can be anything from a QR code for mobile order and pay, allowing guests to order food and drink from anywhere on the property without ever needing a server to approach them, to an integrated customer relationship management (CRM) platform that speaks to and pulls data from their F&B CRM, easily sharing that information across teams at the hotel. For example, passing information along to a guest services team to ensure that in-room amenities don’t include nuts if a guest has a peanut allergy.

Operators and managers should also make sure they’re utilizing loyalty programs. According to a recent SevenRooms survey of American consumers, 44% say that loyalty programs play a part in their hotel choice and there are certain incentives that will bring them back.

For example, some want loyalty points to enjoy on property restaurants and bars, whereas others want a personal greeting when they check in, or a complimentary glass of champagne waiting for them when they get to their room.

Technology and loyalty programs both play into an exceptional experience and it’s important for operators to use both to create the total package.

You mentioned collecting guest data. Can you tell us a little bit more about why that is so important?

When we talk about data and hotels, we’re talking about using it to power a one-of-a-kind unique experience. We don’t mean taking or selling personal information, and that’s an important distinction.

The data we’re collecting for operators centers around a guest’s profile—who they are and what they like. This can be anything from their dietary preferences to their favorite table in the hotel restaurant’s dining room, to what dessert they order most often when they visit.

By having this data, operators can build a direct relationship with these guests and, in turn, build an incredible experience that keeps them coming back. For example, if a guest stays at a specific hotel on their vacation and takes full advantage of the pool cabanas, the data collected on those visits can then be used to retarget them with a special marketing promotion or offer to visit their local hotel property for a staycation, complete with a discount on a cabana day rental.

Creating these unique, personalized experiences not only increases revenue for operators, but also drives loyalty, as a loyal guest is more important than a one-time guest.

About Austen

Austen Asadorian is the Vice President of Sales at SevenRooms, where he is tasked with supporting SevenRooms’ global expansion efforts and accelerating the company’s goal of being the best-in-class solution for hospitality operators globally. Prior to joining SevenRooms, Austen was Peloton’s Director of Sales, leading the company’s go-to-market strategy for retail growth and expansion. He started his career at Hillstone Restaurant Group where he cut his teeth learning how to run efficient and profitable restaurants at scale. Austen was ultimately promoted into an executive role where he oversaw the company’s Manager in Training Program and Back of House Operations. Austen graduated from the Culinary Institute of America (CIA).

Image: Antonio Janeski

by David Klemt David Klemt No Comments

Datassential IDs LTO Keys

Datassential Identifies Limited-time-offer Keys

by David Klemt

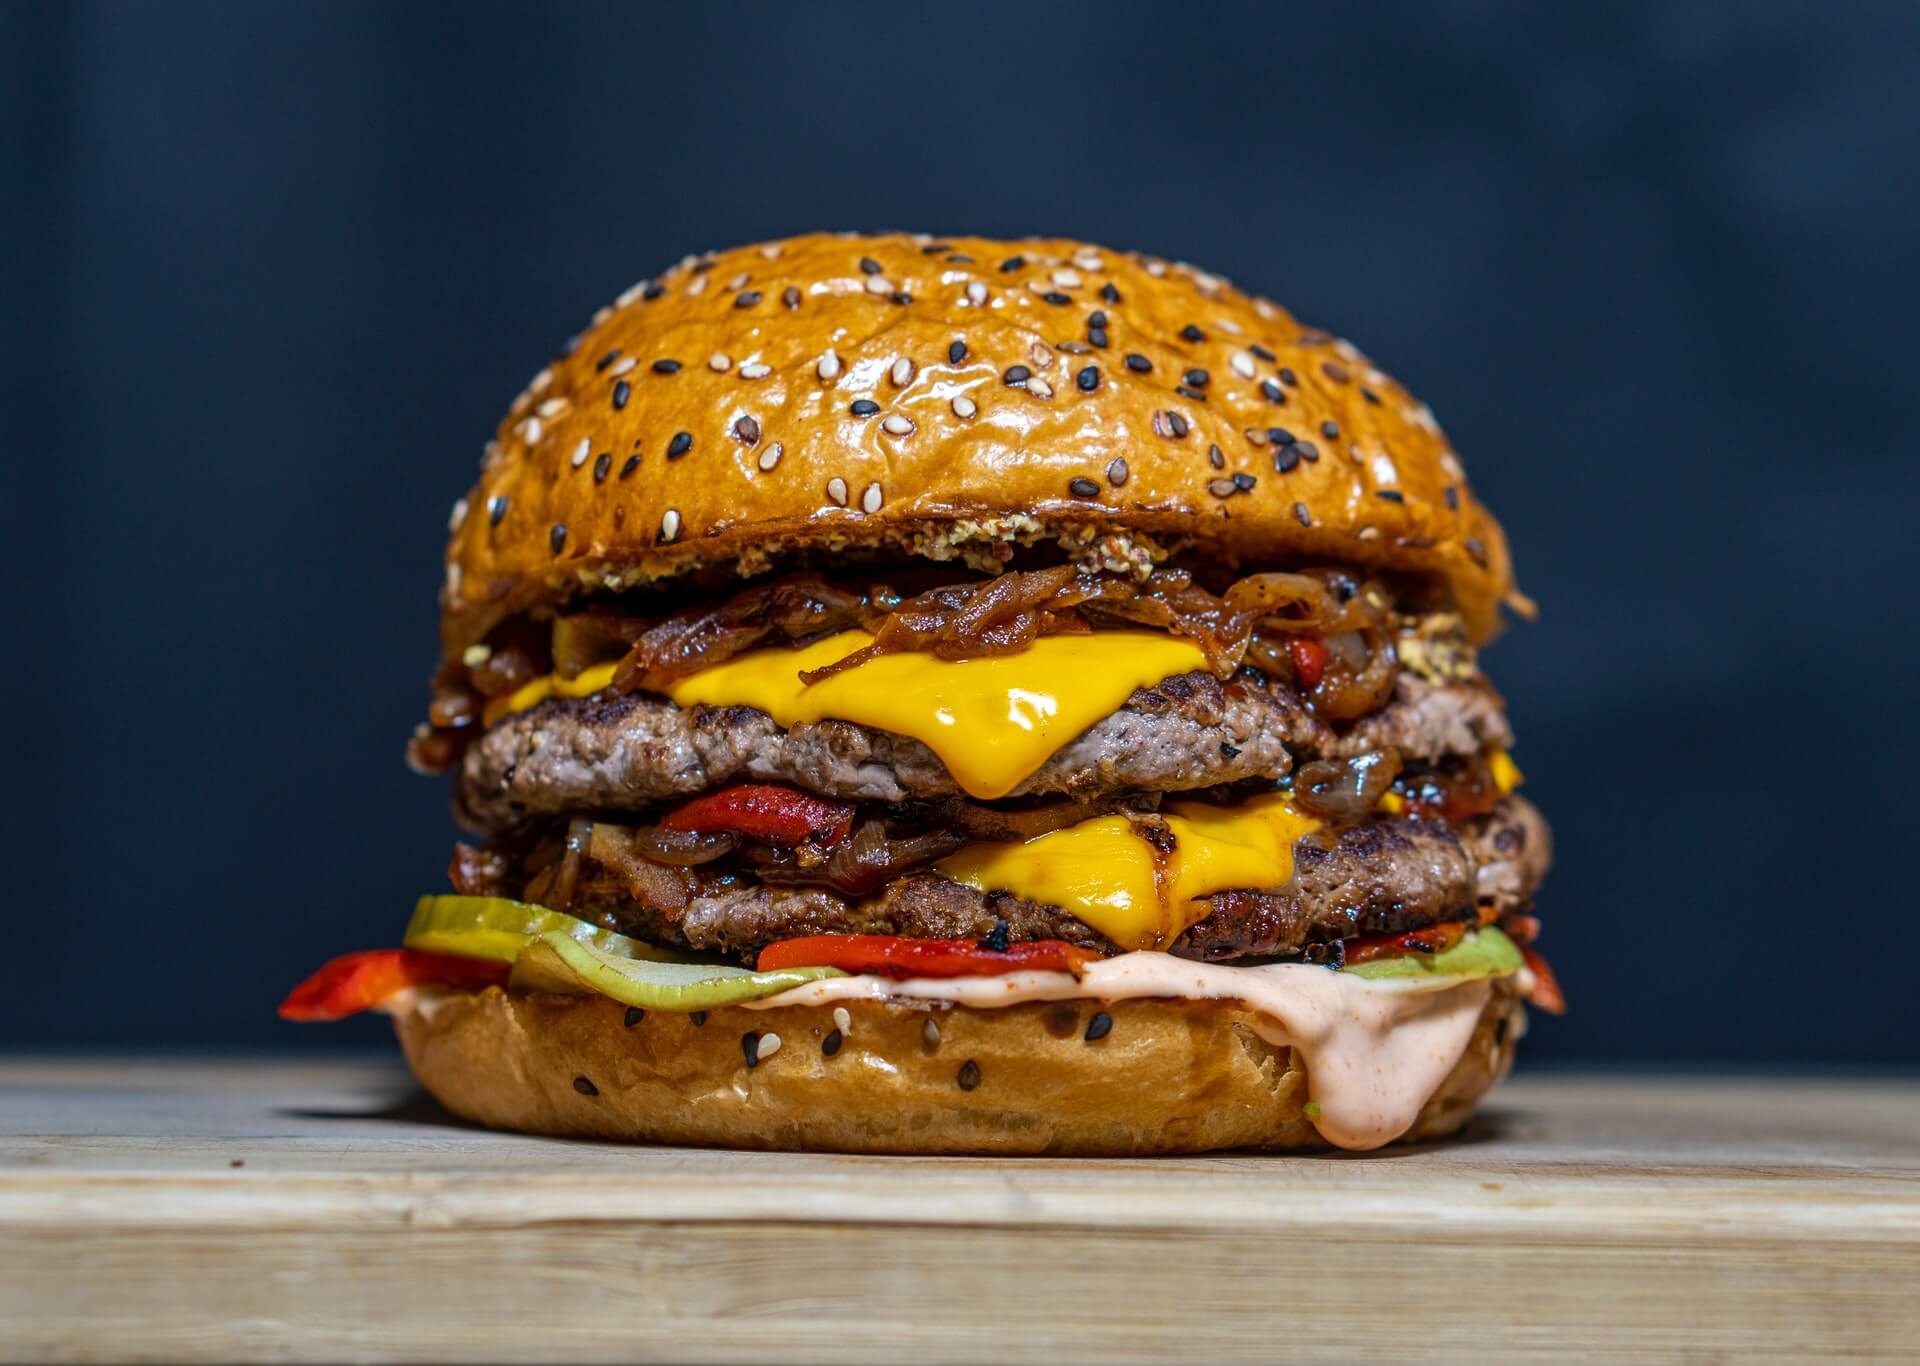
Double cheeseburger on sesame bun

Food and beverage market research firm Datassential turns their attention to limited-time offers in one of their latest reports.

Part of the FoodBytes series of resources, “A Look at Limited-time Offers” is a free Datassential trend report. If you have yet to do so, sign up for Datassential FoodBytes reports.

There are several ways for savvy operators to drive traffic. Loyalty programs and subscriptions are two popular modern-day solutions.

However, the LTO is tried, true, and can boost traffic, engagement, loyalty, sales, and revenue.

Of course, there are different ways to execute LTOs. There’s the recurring, anticipation-driving item: McDonald’s McRib. Then there’s the seasonal offering: Starbucks Peppermint Mocha. And the return of a popular item eliminated years prior: Taco Bell Mexican Pizza and Wendy’s Spicy Chicken Nuggets.

Some LTOs have been going strong for years, others are leveraging a sense of nostalgia. In fact, some appear to be a direct response to Internet chatter.

Which LTO?

Per Datassential, 63 percent of LTOs most recently purchased by consumers were impulse decisions. And when the firm dives into LTOs in general, they find that one product stands above the others.

The top-performing LTO food item in terms of order frequency is the burger.

Now, does that mean you have to menu an LTO burger to succeed with this type of promotion? Of course not.

A successful LTO is one that’s authentic to your brand. And, clearly, it needs to be one that interests your guests. If you’ve been reading KRG Hospitality articles for a while, you know what I’m going to say next.

But for those who are new around here, I’m going to tell you to review your consumer data. What items are performing best? What flavors are resonating with your guests?

Now, look at the industry. What flavors and items are trending? How can you leverage them—in an authentic way—into an LTO?

If a burger may not work, will a different type of sandwich do the job? How about nuggets, breakfast items, a dessert, or a beverage?

Know your brand, know your guest, know what’s bringing the heat.

How Long?

Once you know what you’re offering, the next question should be obvious. How long are you going to make it available?

Every concept is different. What works for one may not work for another. However, analyzing what others do in terms of LTO duration and frequency can help inform you.

And as it turns out, Datassential’s latest FoodBytes report addresses “LTO cadence.”

The majority of operators—43 percent—run an LTO once every one to three months. Considering the popularity of seasonal LTOs, this frequency makes sense.

Interestingly, a quarter of operators offer an LTO more than once per month. Just about as many execute one every three to six months.

Far, far less common is running an LTO once every six to 12 months. In fact, this is the approach of just seven percent of operators. A mere two percent of operators run an LTO less than once every 12 months.

Again, there’s no “right” answer here. Some operations can succeed with multiple LTOs each month, some find success rarely offering one at all.

Takeaway

Operators know their brands best. They should know their guests equally as well, or at least strive to do so. As such, an operator should have an idea of what to offer in terms of LTO food or beverage items.

And, of course, operators should data-obsessive. That’s the only real way to have an idea of what LTOs will work, how often they should run, and how frequently one should be available.

But there’s more to know. Datassential also reveals challenges that deserve serious consideration before executing any LTO:

  • Do you have time to train staff on the new item?
  • Is your staff strong when it comes to upselling?
  • Will your guests complain when the new product is no longer available?
  • Do you have to source one or more ingredients for this item?
  • Is/Are the ingredient(s) necessary readily available?

The LTO is a proven marketing and promotion tool when done well. Challenging, yes, but worth the effort.

Image: amirali mirhashemian on Unsplash

by David Klemt David Klemt No Comments

This Year’s Big Trend: Moderation

This Year’s Big Trend: Moderation

by David Klemt

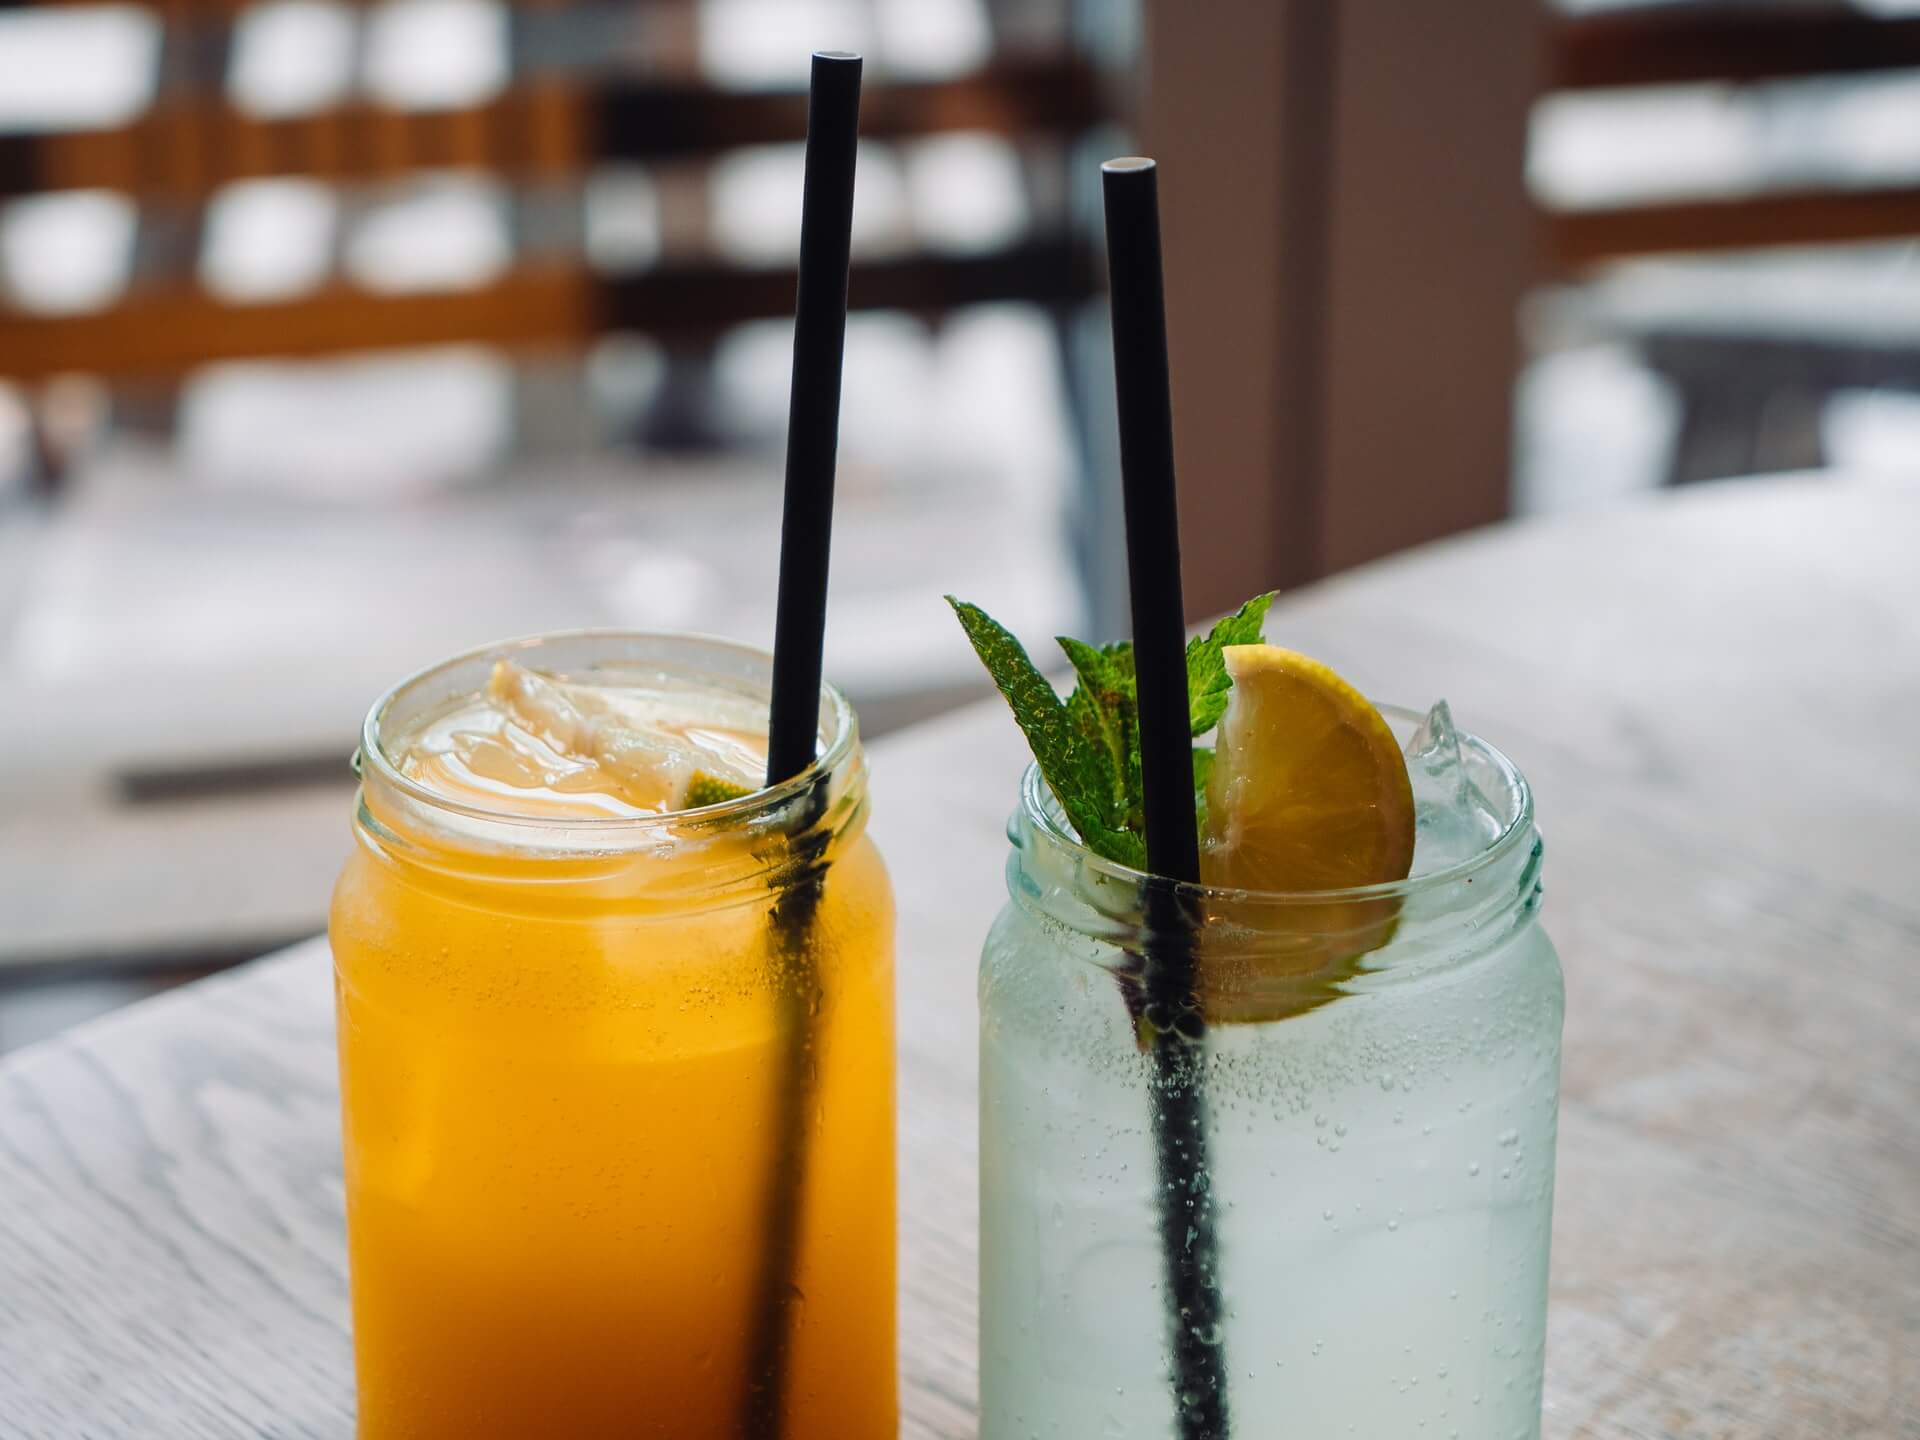
Two drinks in mason jars

Beverage-top media platform Ripples is reporting 2022’s big drink trend, focusing heavily on Gen Z imbibing habits.

The unique company produces devices that make it possible to print images atop drinks. With beverages of all types as their focus, the company is a great position to study drink trends.

Interestingly, Ripples focuses primarily on Gen Z drinking habits. However, the company’s data identifies an intriguing trend that transcends a single generation.

Let’s jump in.

Zero-proof Beverage Growth

At KRG Hospitality, we appreciate numbers; we’re a data-driven agency. Well, amongst all the stats Ripples latest findings reveal, two are massive.

First, in comparison to 2019, zero-alcohol products are up 166 percent. Second, the non-alcohol category is growing four times faster than its low-ABV counterpart.

Another impressive number? Non-alcohol spirits have grown by over 113 percent since 2020.

Per Ripples, Gen Z is driving the growth in the no-alcohol space. According to the beverage-tech company, this is likely due to social media presence.

I’m sure you read articles at least from time to time about Gen Z social media habits. Those written by their older counterparts make it seem like Gen Z doesn’t understand the risks of recording their every action.

Well, it’s highly likely that much of Gen Z would rather not have their drunken shenanigans on display on every social platform.

Values Drive Purchase Decisions

Beyond risk aversion, Ripples identifies values as key to Gen Z purchase and consumption decisions.

Generally speaking, members of Gen Z value transparency and authenticity. Brands that share those values are more likely to succeed with Gen Z.

And, again, speaking broadly, smaller, independent brands are often perceived as more transparent, authentic, and responsible. Large, mainstream brands are often seen as anything but green and responsible, never mind transparent or authentic.

Ripples posits that small indies aren’t encountering daunting barriers to entry. So, small-batch, craft non-alcohol brands are apt to find Gen Z support.

Craft sodas, RTDs offering health benefits, and zero-proof cocktails in cans or bottles are flooding the market. And they’re finding success. In fact, according to Ripples, RTD sales are up 400 percent on Drizly since 2019.

The Big Trend

If you’re a listener of our Bar Hacks podcast you’ve likely heard our episodes with David Allison. If you haven’t heard them, they’re episode 46 and episode 67.

As the founder of the Valuegraphics Project, Allison isn’t a fan of focusing on demographic stereotypes. Instead, he recommends a focus on values in conjunction with demographic and psychographic data.

In part, the Valuegraphics Project approach encourages business owners and operators to identify and target their customers’ values. This is, according to Allison, far more powerful than focusing on age and sex. As important is the fact that demographics tend to divide us, and stereotypes are dangerous.

So, he and the Valuegraphics Project team probably wouldn’t like all the focus on a single generation in this article and Ripples’ findings. Well, there’s some good news and it pertains to what’s likely this year’s biggest drinking trend.

Across all generations, one drinking trend is common: Moderation. An interest in no- and low-alcohol beverages is shared among all generations.

In fact, according to Ripples, 78 percent of consumers purchasing zero-proof drinks aren’t doing so exclusively. These consumers are still buying they’re favorite full-alcohol beverages.

Takeaway

Leveraging the moderation trend is fairly simple. The growth of all zero-proof categories means operators can succeed with alcohol-free spirits, beer, and wine.

RTD cocktails—full-, low- and zero-proof—are selling very well and work in restaurants and bars.

In short, ensure you have low-ABV and zero-alcohol versions of your full-ABV drinks on your menu. Include these in a dedicated non-alcohol section.

Operators don’t need to be afraid of guests drinking more moderately. The stereotype that guests who choose zero- or low-proof drinks are bad for the bottom line simply isn’t true.

Image: Chris Curry on Unsplash

by David Klemt David Klemt No Comments

Eatertainment Poised to Come Roaring Back

Eatertainment Poised to Come Roaring Back

by David Klemt

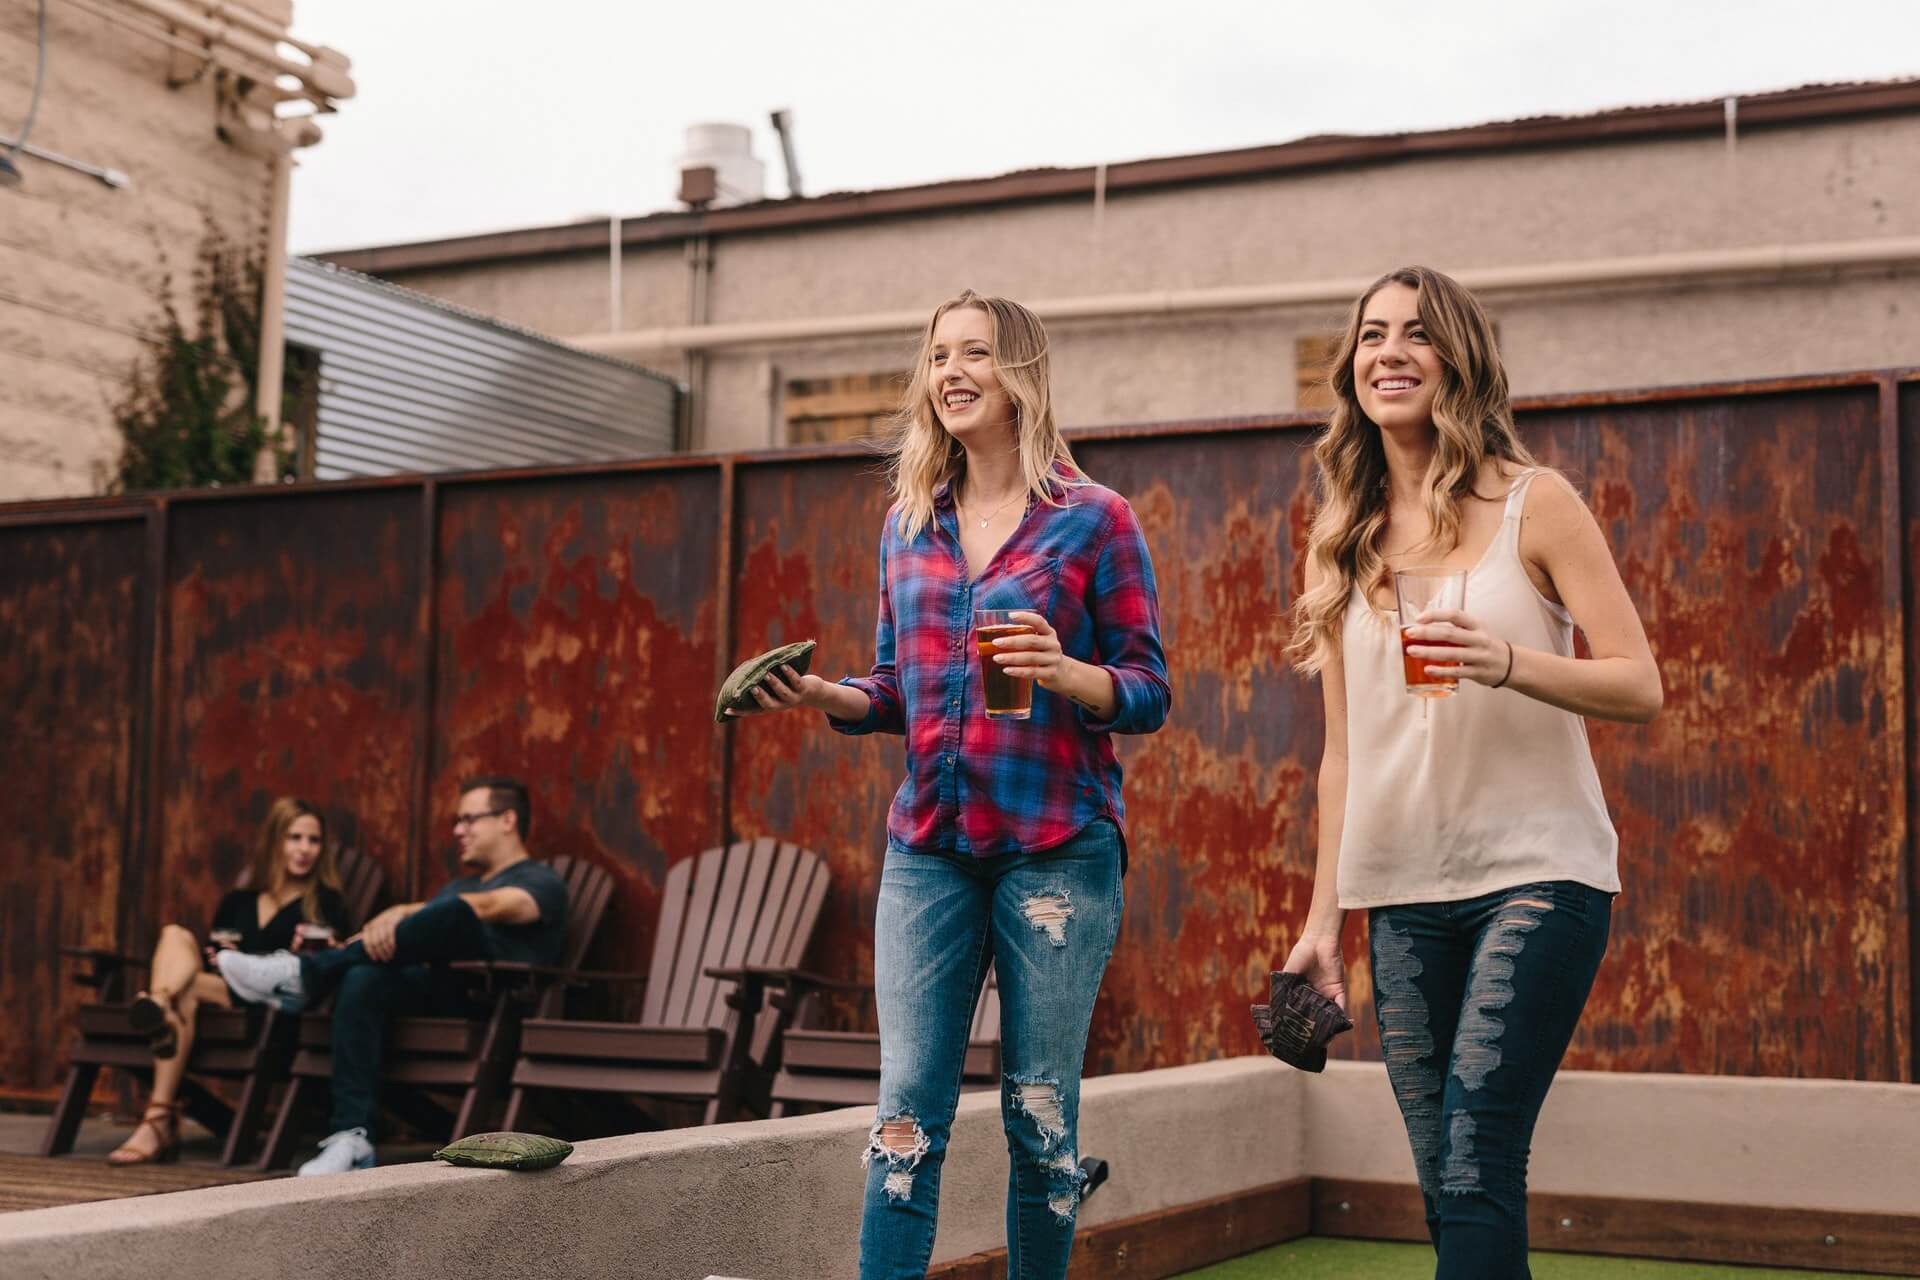
Two women playing cornhole

People are eager to return bars and restaurants, and that focus is beneficial to the growth of one hospitality category in particular: Eatertainment.

As the name suggests, an “eatertainment” venue operates as both an entertainment space and restaurant.

Those who have been to such a concept know the key elements that define eatertainment. A robust F&B program; an array of bar games and other entertainment; room enough to play games and attract groups, but so large it draws massive crowds; and an interest in extending guest stays rather than constantly turning and burning.

Pre-pandemic, the eatertainment category was heating up, steadily growing in popularity. As recently as 2019, SevenRooms and YouGov partnered to study these concepts. When your category draws the attention of data-focused platforms and research firms, you know it’s a winner.

So, what did SevenRooms and their research partner conclude? That eatertainment venues are the new nightclub.

Eatertainment Muscles in on Nightlife

Per the SevenRooms report from 2019, nightlife preferences in the United States were shifting away from traditional nightclubs. This switch was, according to SevenRooms, partially driven by three factors:

  • Nightclubs draw large crowds;
  • they play very loud music; and
  • such venues embrace exclusivity.

Now, that isn’t to say that the nightclub is dead. Particularly in destination cities like Las Vegas and Miami, nightclubs are a major draw.

However, as people reach their thirties or seek out more casual spaces, eatertainment becomes increasingly attractive. For the most part, people can leave work and go straight to an eatertainment concept to meet up with friends. They’ll be able to carve out a space, grab a bite and a drink, and socialize while engaging with an array of entertainment options.

Such venues also tend to be open seven days per week, from noon or early afternoon into late night. Their F&B programs, focus on entertainment, and hours of operation position them to play an important role: the third place.

Home Away from Home

As any dive or neighborhood bar operator knows, becoming a person’s third place is crucial. The third place, for those unfamiliar with the term, is the spot you go to in between the workplace and home.

So, becoming someone’s home away from home is a big deal. It’s the ultimate in consumer loyalty. Become someone’s third place and you’ll be on your way to building an army of brand advocates.

The third place is where we unwind after work. We’re friendly with the staff: they know us, know our usual orders, and know what recommendations to make.

Now, what if a regular’s third place offered not just quality F&B but also entertainment and an atmosphere that shifted with dayparts? You’d have a supercharged third place, a.k.a. an eatertainment concept.

Eatertainment will Continue to Grow

Where should people go when they decide they’re beyond their nightclub years? Feeling uncomfortable in a nightclub doesn’t mean the interest in nightlife simply disappears.

Well, they turn to eatertainment. And why do they find these concepts appealing? For several important reasons driven by shifts in consumer behavior.

One, I think we’re all tired of endless text and DM exchanges attempting to organize an outing. An eatertainment venue is a restaurant, bar, entertainment space, and nightclub in one place. No more planning to travel to a restaurant, then a bar for drinks afterward, and then a nightclub, concert, or lounge.

Two, today’s consumer is seeking out restaurants and bars that offer more inclusive, more welcoming, more personalized experiences. Again, eatertainment hits all those marks.

According to SevenRooms, there are key datapoints that indicate eatertainment will continue to grow. And while their report was published in 2019, their findings are still relevant given the past two years:

  • Around a quarter of Americans want more eatertainment venues close to them.
  • A quarter of Americans prefer a venue that combines quality food and drinks with fun activities in one space.
  • Nearly 30 percent of Americans consider food quality when deciding where to spend their time and money.
  • Close to 20 percent want a venue to offer something to do beyond drinking.

More recently, May of this year, in fact, Datassential also found that eatertainment is on the rise again. Per their data, half of consumers “are very interested in revisiting an eatertainment experience.

Takeaway

Eatertainment concepts are positioned to perform well moving forward.

Think about it: people are eager to socialize without being packed together; guests are showing interest in innovative, high-quality F&B items; people want entertainment that spans live music and DJs to cornhole (or bags, if you want to have that argument), axe throwing, and arcade games; and having access to an incredible, personalized experience in one venue is an attractive prospect.

Punch Bowl Social, Topgolf, Pinstripes, and Flight Club are among the best representatives of the category. Do you have the idea for the next big eatertainment brand? Let us know!

Image: Elevate on Unsplash

by David Klemt David Klemt No Comments

Back of House Report: The Labor Challenge

Back of House Report: The Labor Challenge

by David Klemt

Employees wearing black staff T-shirts

A recent report from Back of House reveals opportunities for operators amidst the current staffing challenge.

In their report, the restaurant technology platform suggests effective hiring and retention solutions. For example, helping staff find meaning in their work.

To download and access the report in its entirety, please visit BackOfHouse.io.

For some of the platform’s insights into staffing, keep reading.

Why People Leave the Industry

Obviously, people take jobs for a variety of reasons. Often, a person’s first job has one or two motivations: money and/or experience.

Some estimates put a gig in the restaurant industry as the first job for a third of Americans. In Canada, restaurants are the top employers for those under 25 years of age.

However, Back of House sees value in looking at a different metric: Why people leave the industry.

As Back of House states, knowing why someone would leave their job helps an operator determine what benefits to offer to retain talent.

Now, it may be tempting to assume pay is the top reason people leave jobs. Per Back of House, however that’s not the case. Broken down by age group, below you’ll find the reasons people are leaving hospitality:

  • Pay: 26 to 35
  • Schedule: 46 to 55
  • Lack of opportunities: 26 to 35
  • Lack of benefits: 26 to 35
  • Work environment: 18 to 25

Look at these issues through the lens of someone moving through life. When first entering the workforce, more people want to find the right employer and workplace. From their twenties to thirties, more concern is placed on moving up, making more money, and receiving benefits. And, per Back of House’s findings, time becomes more of a consideration as people age.

Meaning and Value

Per Back of House, there are two important elements of employment that keep people engaged.

One, meaning in the work they do. In other words, feeling that their work has value. Two, staff want to feel that they’re employers value them.

Of course, both make sense, no? If a person doesn’t see their role in the industry as valuable, they’ll always be looking for the escape hatch. And if they feel that they’re employer doesn’t value them, why would they continue working for them? People, as they say, quit bosses, not jobs.

So, Back of House recommends that operators demonstrate they value their team members by:

  • investing in their staff;
  • supporting their staff; and
  • respecting their staff.

Now, good leaders should already do all of the above. It should go without saying but if someone feels a lack of respect, support, and interest from their employer, they’re not going to remain in their role for long.

And who could blame them? That seems like a terrible workplace and a waste of a hospitality professional’s valuable time. Time, of course, that can be better spent finding a good leader to work for who will help them progress in their career.

There are further insights one can glean from Back of House’s report. To download “Understanding the Staffing Challenge,” please click here.

Disclaimer: Neither KRG Hospitality nor its representatives received compensation to promote this report. The team at KRG simply feels all operators will find value in downloading and reading it, and considering the information contained therein.

Image: Joao Viegas on Unsplash

by David Klemt David Klemt No Comments

Forward Progress: Trends by Venue Type

Forward Progress: Trends by Venue Type

by David Klemt

High contrast image of blue cocktail with lemon zest

One notable difficulty with considering new trends is that they’re not all necessarily a universal fit for all venue types.

For example, what may work well in an upscale restaurant perhaps won’t perform as well in a sports bar. Pursuing a trend that isn’t a good fit, obviously.

As any operator with experience knows, chasing fads and trends just to chase them can be costly. Doing so costs money (inventory, training, labor hours) and time deserving of better allocation.

However, failing to embrace any trends can also be costly. Watching a lucrative trend pass by can cost an operator guest engagement, perception, and traffic.

Take, for instance, the success of White Claw. Plenty of operators and consumers scoffed at the hard seltzer category as a whole at first.

Then, some people decided it was a drink category “for women.” As it exploded in popularity, hard seltzers proved immensely popular with men.

Basically, it’s an incredibly strong beverage alcohol category that resonates with a wide range of consumers. On some menus, hard seltzers are listed alongside beers.

So, hard seltzer, led largely by White Claw, showed itself to be a worthwhile trend to adopt.

Clearly, however, hard seltzer doesn’t resonate with all guests on all occasions in all types of hospitality venue types. For instance, generally speaking, a bucket of White Claws likely to be a top seller in a high-end restaurant specializing in seven- to nine-course meals.

Drink Trends by Venue

During Bar & Restaurant Expo in March of this year, Amanda Torgerson of Datassential presented 2022 drink trends operators should know.

One trend has essentially proliferated the industry. Really, it’s likely wise for us to all view this trend—hard seltzer—as mainstream now.

In the context of Torgerson’s presentation, Datassential is saying that hard seltzers are here to stay.

Among other trends, Torgerson shared Datassential’s data-backed view of drink trends segmented by venue category.

While every venue is unique and not every trend will work for every bar or restaurant in a given category, the results are no less intriguing.

Pubs: Dry-hopped beers, pastry stouts, and hard or spiked coffee.

Sports Bars: Mini-beers, hard seltzer, and reusable growlers.

Casual Bars: Seltzers with unique flavors, hard tea, hard lemonade, and drinks featuring local ingredients.

Upscale Bars: Negroni, wine-barrel-aged spirits, and flaming cocktails.

Nightclubs: Hard seltzers served with spirits, cocktails and punch bowls served with dry ice, and flaming cocktails.

Casual Restaurants: Wine cocktails, elevated brunch cocktails, and tea-based alcohol beverages.

Upscale Restaurants: Flaming cocktails (smoked may be better), all-natural wines, and made-to-order cocktail cart presentations.

Hotels, Resorts and Casinos: Made-to-order cocktail carts, alcohol vending machines, and drinks made with cold-pressed juices.

Interestingly, a few of the above trends identified by Datassential appear in multiple venue types.

The main things for an operator to keep in mind is what will resonate with their guests and what’s authentic to their brand. When it comes to trends, one size doesn’t fit all and an individual venue’s mileage will vary.

However, the above list should at least show operators what Datassential sees resonating with guests in an array of venues.

Image: Ozge Karabal on Pexels

Top