Hiring and Training Staff for Consistency
by Nathen Dube
Every restaurant needs to hire staff. This is probably the second most important pre-opening task after deciding on a concept.
Hiring can be an arduous process and hiring the wrong person is often detrimental to success. It costs time, money, and effort to replace and repair the damages.
Putting a fully developed onboarding plan in place—compelling job ads, effective interview and selection processes, in-depth training manuals, and training schedules—can help streamline hiring and retention, and make new hires feel welcome and confident in their roles.
Hiring and Onboarding
Creating a strategy to onboard all staff, adjusting for differing positions (cooks, servers, managers, etc.), will help to identify potential employees that fit your needs skill- and attitude-wise.
A strategic plan will streamline the entire process, start to finish. Think of it as your recruiting and hiring “recipe.”
Answering phone calls, scribbling notes, writing emails, losing phone numbers… Operating without a plan can be very frustrating and time consuming for everyone. After all, running your restaurant is far more important than being your own HR department.
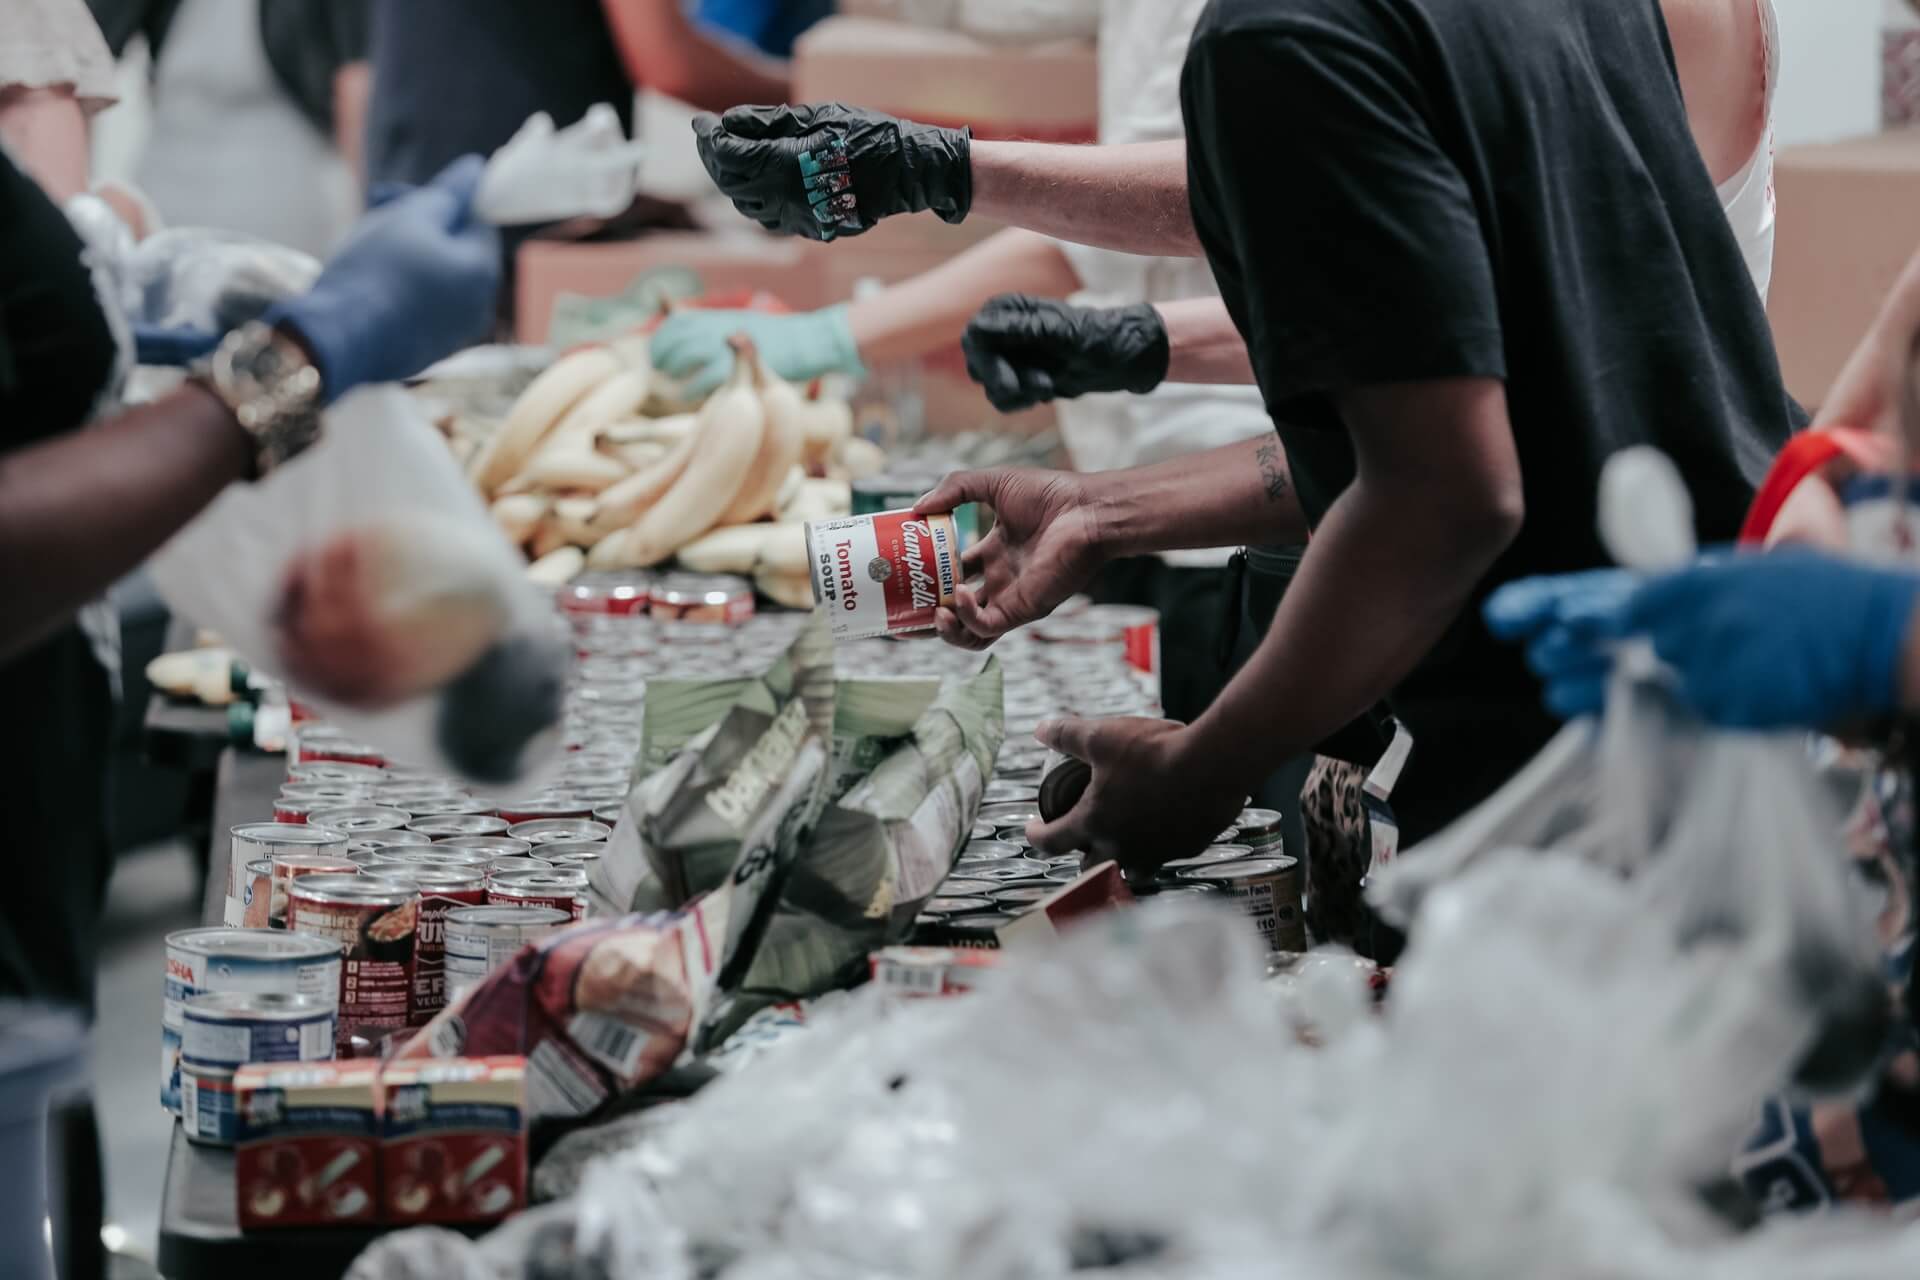
The problem is that many organizations see training as an expense and not as an investment. Untrained employees will, inevitably, lack the motivation and knowledge to use company resources properly.
A lack of training in the hospitality industry leads to:
- costly waste;
- employees who feel unappreciated in their job;
- employees with a general sense that their job doesn’t matter; and
- unsatisfactory guest interactions that impact guest retention negatively.
At this point, employees either leave or get fired for poor performance.
While it may seem simple just to replace one worker with another, consider this: Hiring someone can cost up to 30 percent of the job’s salary. For an employee that makes $40,000 a year, that could equal around $12,000 to hire someone new.
However, training an existing employee correctly might only cost a few hundred dollars, reducing invested time. Even if replacing one employee doesn’t sound that bad, consider that for every three employees who need to be replaced, that will equal an entire salary with no real gains.
Clearly Define Roles and Responsibilities
From the outset, outlining job roles and daily responsibilities properly is extremely important to ensure that all staff are on the same page.
Building and maintaining a well-oiled machine takes time and planning. However, identifying and distributing responsibilities as equitably as possible will help things flow smoothly.
Differing service times can lead to staff friction when tasks are not being completed effectively for the next shift. The lack of a clear plan regarding responsibilities such as prep, stocking fridges, putting away orders, cleaning, and maintenance will inevitably cause confusion.
Yes, writing out a daily walkthrough and task list from shift start shift end time for each role in your organization will take some time and effort. No, it isn’t the most fun job you’ll do.
But doing so will make onboarding and training a seamless and less time-consuming transition overall.
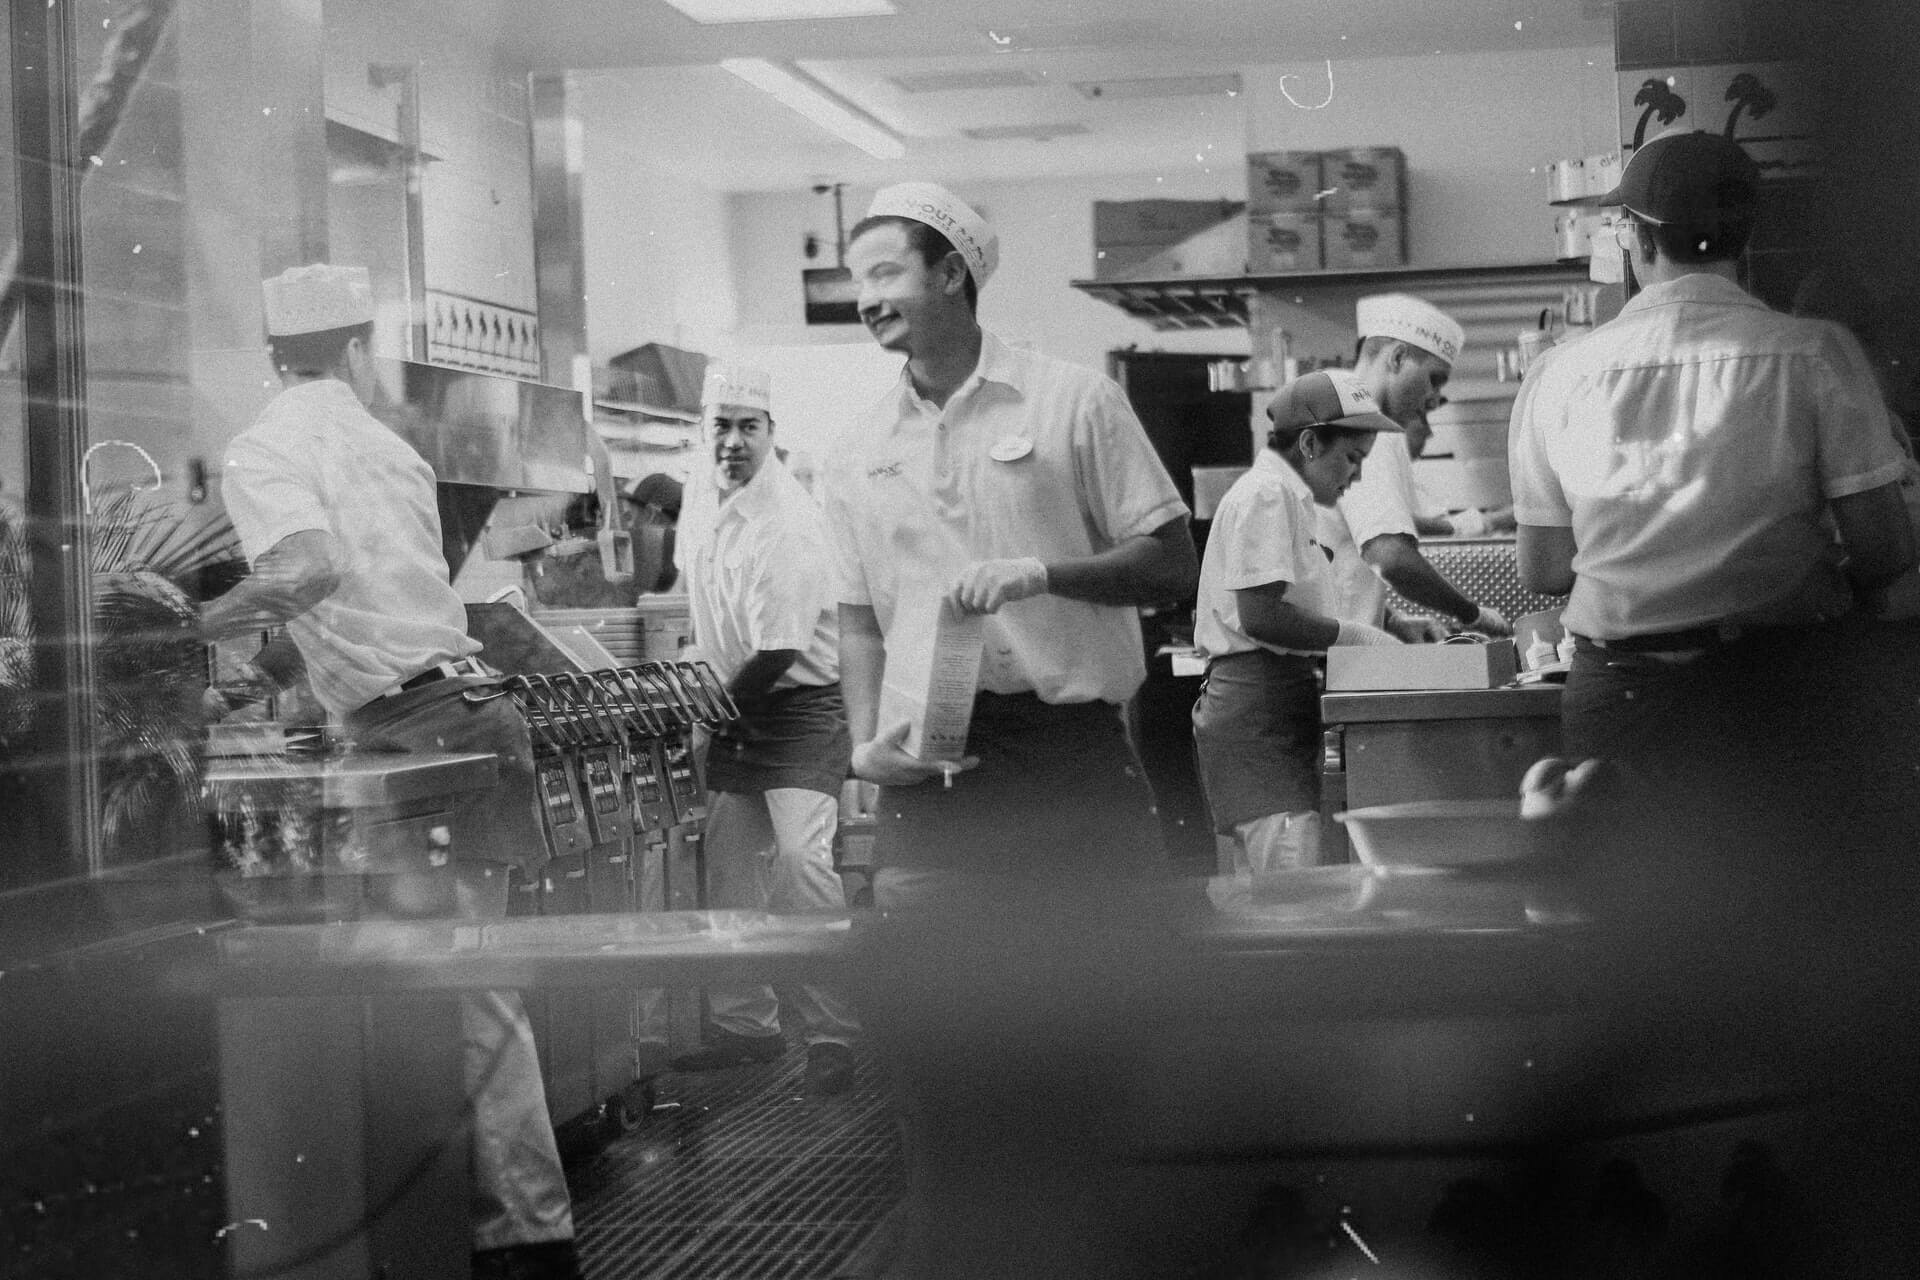
How to Train New Restaurant Employees
When you’ve completed the interviews, made your hire, and are now bringing in your new staff, where do you start? Who is responsible for training? (Yes, this should be delegated in your plan!) What station do they start on and what is the timeline for moving them along?
Having a plan for onboarding that is mapped out in an employee manual will help to clearly explain your company’s policies and expectations; training modules; and all other helpful information to a new hire.
Expecting a line cook, who may even be green themselves, to convey this to a new employee is like playing the telephone game in grade one: it doesn’t work and is irresponsible.
Setting up detailed, specific workstation plans is the first step. The second step is to plan training shifts and specify who is going to be training new hires.
Batch training can make this process easier. Have your head chef or front-of-house manager spend time to train all the new hires, not just the one or two who happen to be working that day. Be sure to include other positions like sous chefs and floor staff.
This last step, along with a solid training manual, helps eliminate starting the whole process over again every time a position turns over. It also completely mitigates the disaster of staff members being trained differently. Consistency will be solid across the board.
Different Strategies for Part-time Staff
A great part-time employee program can elevate your full-time staff.
With the peaks and valleys of busy restaurant periods fluctuating around lunch and dinner, for example, full-time staff can be overworked and then swiftly underutilized. Part-time employees on the other hand, when scheduled correctly don’t experience the swing in workload.
Although part-time staff offer flexibility in scheduling, it can be difficult to find time to train them. However, part-time workers should not be excluded from training just because their hours are limited.
Organizing training specifically for your part-time employees is crucial to the success of your team. Scheduling a part-timer to come in on a busy Saturday lunch shift and flounder around strains and stresses out the rest of the staff. That’s the last thing you want or need.
Part-time staff benefit from shorter periods of training engagement than your full-time staff. You do want to include them in your large training sessions but will certainly have some who can’t make it.
Since their schedules are limited, you can train part-time staff via 15-minute lessons during pre-shift meetings. These talks can cover can anything from kitchen hygiene reminders, menu walkthroughs, customer service, and proper table setting.
Using your best staff for on-the-job training can also be beneficial to your part-timers. Shadowing during shifts provides a visual, real-world representation of everything written out in your employee manual. Following in the footsteps of someone in the role a part-timer has been hired for is an excellent way for them to understand their responsibilities and tasks in real-time.
Not only is it an opportunity to understand how the whole team functions, it’s a chance to meet colleagues and bond with the team.
Streamline Your Menu
As mentioned in a previous post, the streamlining of your menu benefits everyone from the top down.
Trying to train a new employee on how to cook (or serve) every single item on a large menu can be daunting. Keeping your menu narrow and focused will make an employee’s transition into their new position.
This is where your employee manual will come into play again. Recipes and pictures, along with training and tastings, will give new staff the confidence to cook and serve the dishes skillfully. Shadow shifts will complete the picture for them with hands-on training.
Conversely, having a large menu creates unnecessary confusion and takes a longer time for staff to feel comfortable.
Everything on your menu needs to be something that your kitchen and serving staff can handle efficiently without putting undue burden on your staff. Choose recipes that include ingredients that you know fit within your budget and concentrate on making them the best they can be. Good food is more about taste than presentation.
Seasonal menu changes should be addressed via staff meetings, updated recipe cards, tastings, and even testing for all staff. Consider using these events to train and onboard your new staff to start them on the right foot and avoid them having to play catch-up.
Don’t Discount Human Communication
Everyone wants to implement the latest technology to save money, resources, labour costs, and to deliver superior product.
One thing that needs to be remembered when training staff is this: even with all these new processes, human interaction is still necessary for a functioning business.
That is, human skill is still required to cook and plate delicious, Instagram-worthy food, and to deliver that food to the guests at the table. For the time being, human interaction is what creates memorable dining experiences and keeps guests coming back!
The opposite end of that spectrum happens when technology fails or crashes. Troubleshooting and problem-solving skills are required by your staff every day.
Train staff how to utilize your technology stack but also understand the “old-fashioned” ways.
Effective Troubleshooting Ability: Importance of Teamwork, Repetition, Consistency
A solid training strategy produces a staff that values teamwork, a team with effective troubleshooting skills, and consistent results.
When you identify the roles you are looking and the responsibilities that come along with them, plus delegate and train properly, you are essentially giving your staff the ability to individually and collectively trouble shoot any issues that arise.
These problems can relate to customer service, broken equipment, inventory problems, and other issues that might come up when you or your leadership team aren’t there to fix things.
Everything talked about here is the foundation you should be building on to create an environment that thrives on teamwork. From the minute you onboard new staff they are comfortable in what is being asked of them and are given plenty of opportunity to work alongside colleagues.
Excellent teamwork leads to consistency and repetition of food, drinks, and service regardless of who is working the front or back of house. There is nothing more disappointing than returning to a restaurant only to have a substandard experience.
Implementing these programs even before opening day will help to keep you and, more importantly, your staff happy, thriving, and creating an amazing experience for your guests time and again!
Image: nick jenkins on Unsplash