Notice: Function _load_textdomain_just_in_time was called incorrectly. Translation loading for the smart-post-show-pro domain was triggered too early. This is usually an indicator for some code in the plugin or theme running too early. Translations should be loaded at the init action or later. Please see Debugging in WordPress for more information. (This message was added in version 6.7.0.) in /var/www/wp-includes/functions.php on line 6114
Independent restaurant | KRG Hospitality

Independent restaurant

by David Klemt David Klemt No Comments

2023 State of the Menu: Datassential

2023 State of the Menu: Datassential

by David Klemt
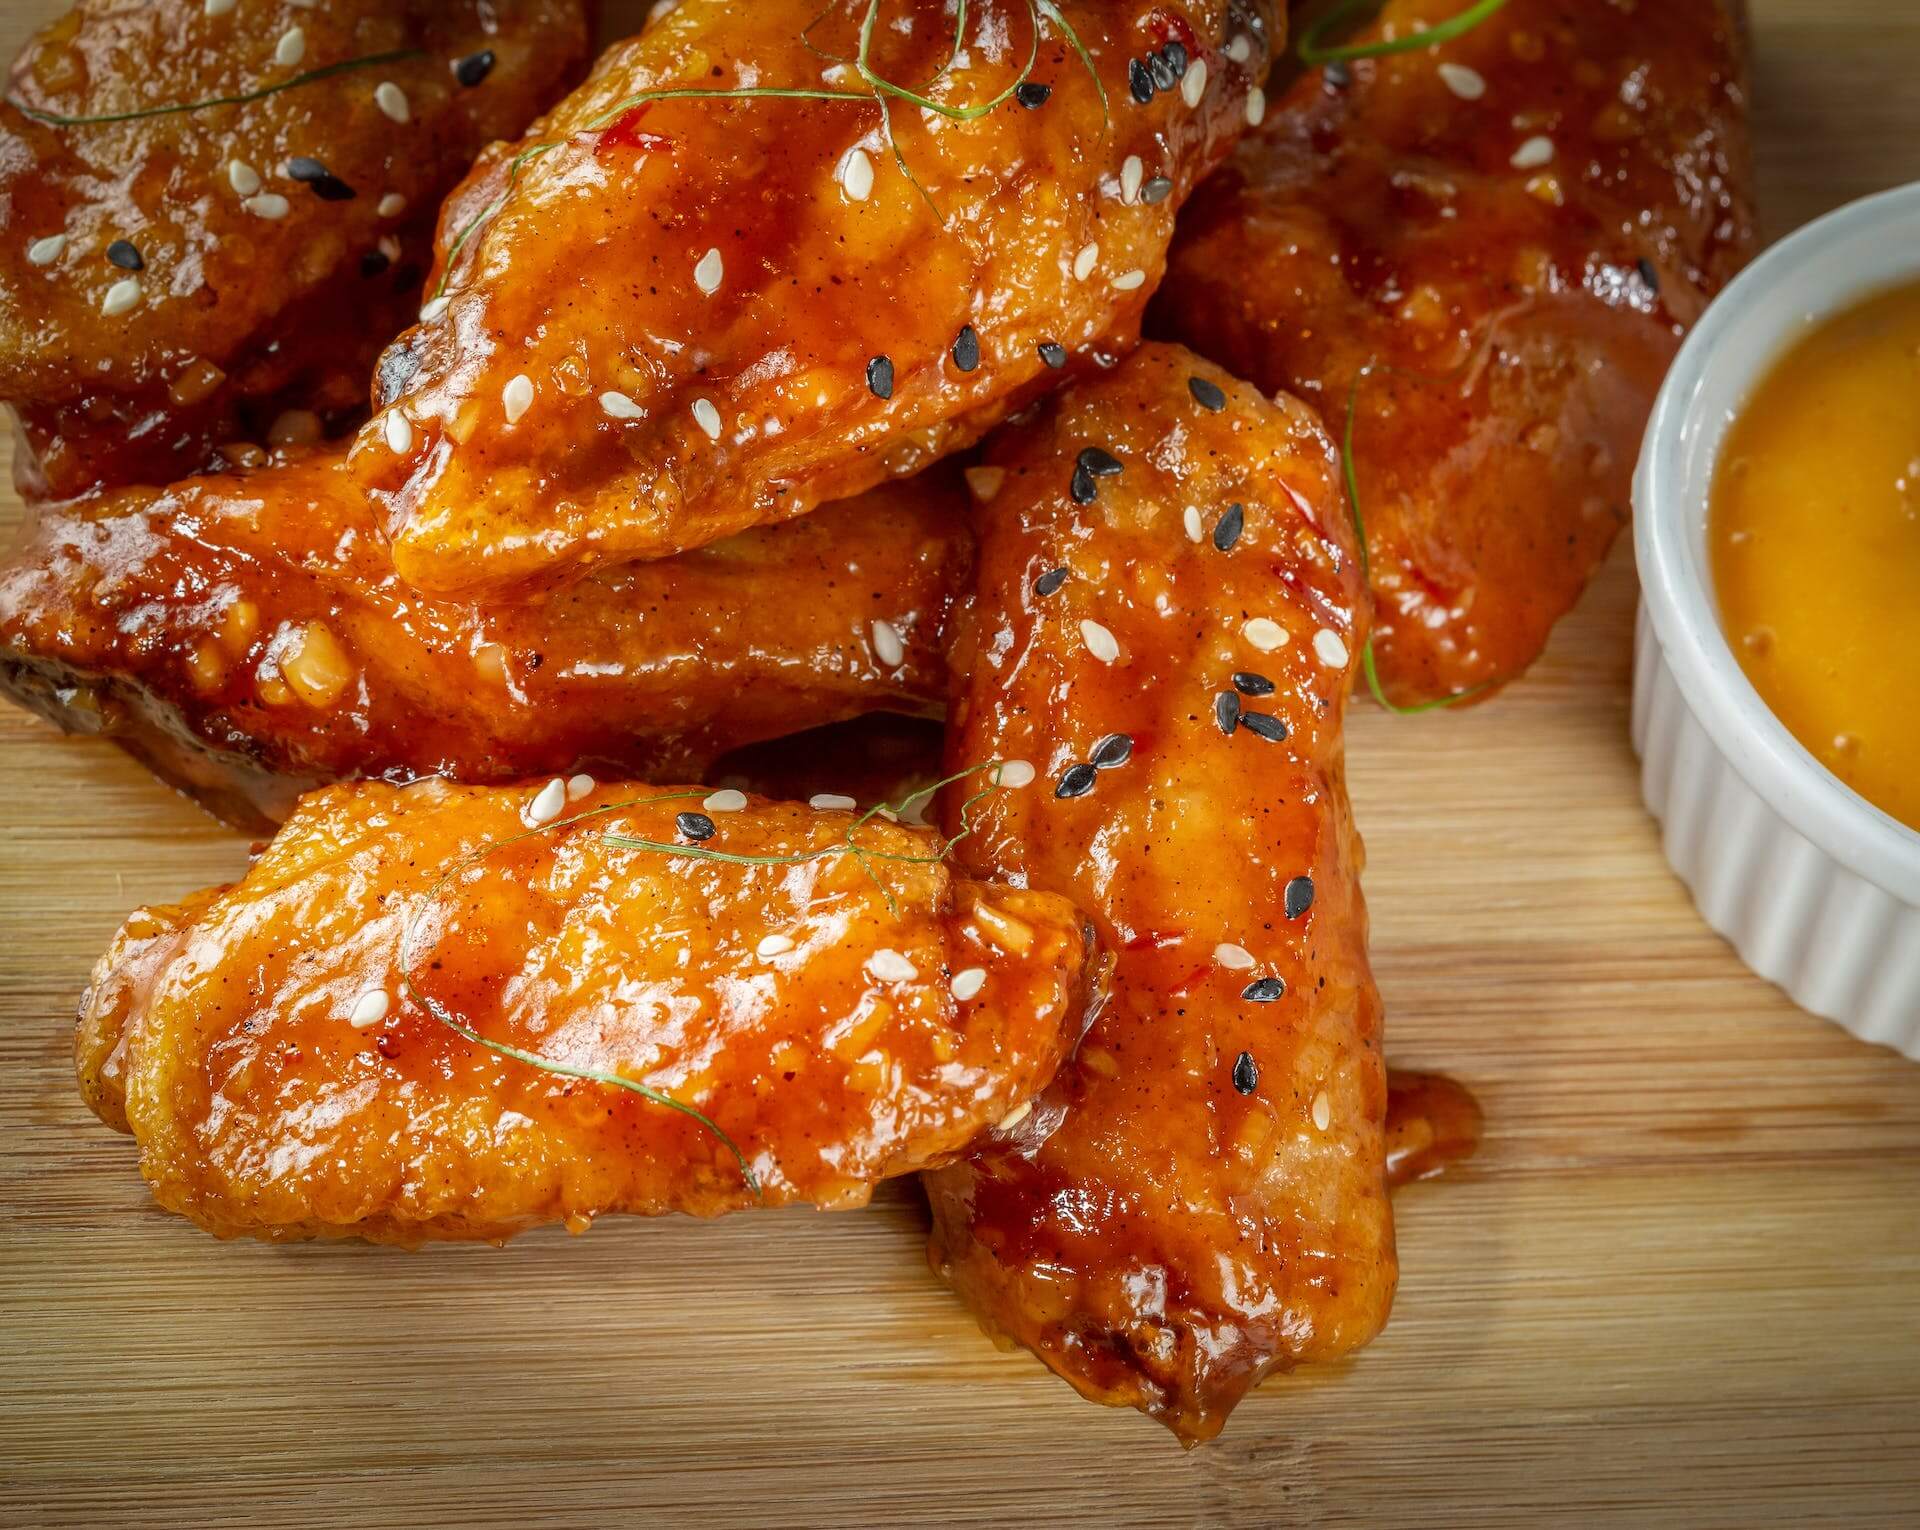
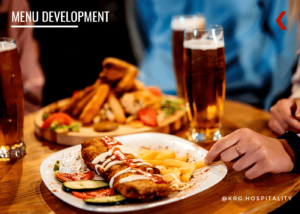
Korean fried chicken wings

The annual 2023 State of the Menu by Datassential includes an interesting metric to gauge restaurant recovery: menu size by segment.

Hosts Jack Li, Mike Kostyo, and Claire Conaghan discuss a handful of topics during this webinar. Host Li touches on food-forward cities at the beginning of this presentaiton. Kostyo shares some of the most innovative menu items out there right now. And Conaghan dives deep into menu trends.

Industry professionals interested in watching this webinar on demand can register to do so here.

There are a handful of metrics people are using to measure post-pandemic restaurant recovery. Labor is, of course, receiving a lot of attention. People are also tracking traffic, average check size, revenue, and profits.

One metric Datassential is keeping tabs on is menu size per restaurant segment. Additionally, they’re tracking each segment’s top-growing food and beverage items.

Notably, however, in tracking menu size, Conaghan focuses solely on food and non-alcohol beverage items, omitting catering and alcohol.

Chains vs. Independents

Starting things off, Conaghan addresses the overall menu size trend. That is, menus are noticeably smaller in comparison to pre-pandemic sizes.

Interestingly, chain restaurants don’t appear to be in any rush to move away from this trend. In fact, Conaghan notes that chains appear to be further reducing the size of their menus. This has been the trend over the past 12 months.

According to Conaghan, fine dining also seems to be happy to shrink their menus. Menu size shrunk the most among restaurants in this segment. In comparison, quick-service menu sizes decreased the least.

However, independent restaurant operators appear to be going in the opposite direction from their chain counterparts. In contrast, indies have been growing the size of their menus the past 12 months.

Menu Size by Segment

Fast Casual

Per Conaghan, the only segment to reach pre-pandemic menu size is fast casual. In fact, this category of restaurant is often exceeding pre-pandemic items-per-menu size.

This increase in menu size is attributable to operators “leaning into” core cuisine items. For example, sandwiches, Mexican entrees, and pizza.

However, the fastest-growing food item on fast-casual menus is the chicken wing. According to Conaghan, it’s easy for operators to innovate with chicken wings.

A restaurant doesn’t have chicken wings? All they have to do is add them, starting with simple preparations. If a restaurant does have chicken wings on the menu already, innovation is as simple as adding new flavors.

As far as the fastest-growing drink for fast-casual restaurants, it’s dessert beverages.

QSR, Casual Dining, and Midscale

These three segments are “very, very close” to reaching pre-pandemic menu sizes.

As midscale operators are likely very aware, this segment tends to have the largest menus. I wouldn’t be surprised, therefore, if a number of midscale concepts review their items per menu, their costs, and decide they can perform well with slightly smaller menus moving forward.

Unsurprisingly, chicken wings are the food item growing most quickly on QSR food menus. Oh, and barbecue chicken wings are the fastest-growing food item among casual dining restaurants.

Perhaps a bit more eyebrow-raising is the fastest-growing beverage type for QSRs: energy drinks. Boba and flavored iced teas are growing fastest on casual-dining drink menus.

For midscale restaurants, dessert samplers are the fastest-growing food items. Think “dessert charcuterie” when trying to picture a dessert platter. Another way to think about the dessert sampler is a static dessert cart with small bites of each dessert on the menu.

Fine Dining

Again, this segment is the furthest from pre-pandemic menu size. And, again, operators in this category seem happy with this trend.

An interesting note Conaghan makes about this segment is what many operators are using to fill out their menus: desserts. This is, she says, an area where fine dining can differentiate itself from other concepts.

Per Conaghan, bao, applesauce, and summer squash are growing the fastest on fine-dining food menus.

Now, I may have slipped into a fever dream during this portion of the Datassential webinar. Because unless I’m mistaken, the Shirley Temple has been identified as the fastest-growing beverage in the fine-dining space.

Pricing

Okay, so this segment of the 2023 State of the Menu webinar isn’t really a recovery metric.

However, it’s interesting, and something Jack Li says about chain restaurant pricing made me chuckle.

Most Expensive vs. Least Expensive

First, some straightforward data.

The following list identifies the five most-expensive ZIP codes for chain restaurant menu pricing. Anyone who wants the full list of 15 most-expensive ZIP codes can watch the webinar.

  • 10036 (New York, NY)
  • 96707 (Kapolei, HI)
  • 98902 (Yakima, WA)
  • 96815 (Honolulu, HI)
  • 99503 (Anchorage, AK)

It’s understandable to think this would consist entirely of New York City, Los Angeles, or San Francisco ZIPs. But when we consider what it costs operators to import food to Hawaii and Alaska. Additionally, Washington and New York are among the states with the highest minimum wage. Operators need to recover those costs somehow.

And now the five least-expensive ZIP codes:

  • 78526 (Brownsville, TX)
  • 75224 (Dallas, TX)
  • 76106 (Fort Worth, TX)
  • 31907 (Columbus, GA)
  • 31701 (Albany, GA)

Pricing Logic

Now, on to what Li says during the webinar that makes me laugh.

Nationwide, the average price of a McDonald’s Big Mac in the US is $5.26. (A caveat: This webinar took place in October. This price may have increased or decreased by now.)

However, the lowest price for a Big Mac is $3.49 at a location in Wilburton, Oklahoma.

So, what’s the highest price, and where can one find these pricey Big Macs? Three McDonald’s locations sell the burger for $8.29. That’s nearly two-and-a-half times the lowest-priced Big Mac.

Summarizing pricing variations among chain restaurants succinctly, Li made me laugh with the following: “Store pricing often just doesn’t make sense.”

Going further, Li says Datassential shows that the more franchised a restaurant chain is, the more variances in pricing will occur.

The full webinar can be viewed here.

Image: Leonardo Luz on Pexels

Bar Nightclub Pub Brewery Menu Development Drinks Food

by David Klemt David Klemt No Comments

New Review Platform Rejects Negativity

It’s Good: New Review Platform Rejects Negativity

by David Klemt

"Just be nice" sign on wall with graffiti

Combine equal parts incredible team of founders, love for food and travel, and respect for an expression that we should all adhere to more closely, and you get a new review platform.

The expression from which this team derives their platform’s ethos?

“If you don’t have something good to say, don’t say it at all.” But how can a review platform embody that age-old expression?

Well, it turns out that answer is rather simple: by refusing to allow negative reviews. That’s the foundation of how It’s Good plans to operate.

That is, of course, quite the departure from Yelp, Google Reviews, Tripadvisor, and other review platforms. In my experience, Yelp draws the ire of most operators. Obviously, it doesn’t help Yelp’s reputation among operators that people can review bomb a venue rather easily, among other issues.

On It’s Good, there’s no “star” ratings system. Negative comments? The platform is “not even built for” those, according to co-founder John Legend.

“Either you recommend [a place or experience] or you don’t,” says Legend, elaborating further on It’s Good.

The team of founders also includes Kevin Auerbach (who comes from Apple), Meghan Raab (from Snap), and director and photographer Mike Rosenthal.

With Auerbach and Raab guiding what is likely a top-notch engineering team, It’s Good should be simple and fun to use.

The User Experience

At the moment, It’s Good is an invite-only platform. According to articles online, Legend and Rosenthal have been working on the app for four years.

So, the initial idea is to lay the user foundation ahead of its public launch. Logical, since it would be challenging to sift through recommendations without a core user group populating the app first.

“Our mission is to be your go-to place for saving & sharing your most favorite places to eat and drink. Trustworthy recommendations for you, by you – from the people you know or admire, all in one beautiful space,” reads the waitlist confirmation email I received from Shirene Niksadat, It’s Good head of community.

Interestingly, one of the motivating factors behind this platform is Legend himself. Apparently, he’s a go-to source for recommendations amongst his friends.

“My friends always reach out to me for ‘my list’ of restaurants in the cities I’ve visited,” Legend is quoted as saying on the It’s Good website.

From what I can gather, the platform will allow people to find new restaurants, bars, and experiences via location-based and themed lists. I’m sure there’s more functionality, but the main takeaways are:

  • organized recommendations;
  • personalized recommendations from trusted sources and friends; and
  • recommendations that answer a simple question: Is this place or experience good?

“We believe a restaurant rec from 1 trusted friend is more valuable than recs from 10,000 strangers,” says the It’s Good site, right at the top.

That should give us all an idea of how this platform will operate, and what to expect when it goes live for the general public.

Obviously, I can’t provide a review of this review platform. But I can say that I’m looking forward to my opportunity to take it for a spin.

To get your name on the waitlist, click here.

Image: A A on Unsplash

KRG Hospitality Start-Up Restaurant Bar Hotel Consulting Consultant Solutions Plans Services

by David Klemt David Klemt No Comments

Indies in the US & Canada: The Numbers

Independents in the US & Canada: The Numbers

by David Klemt

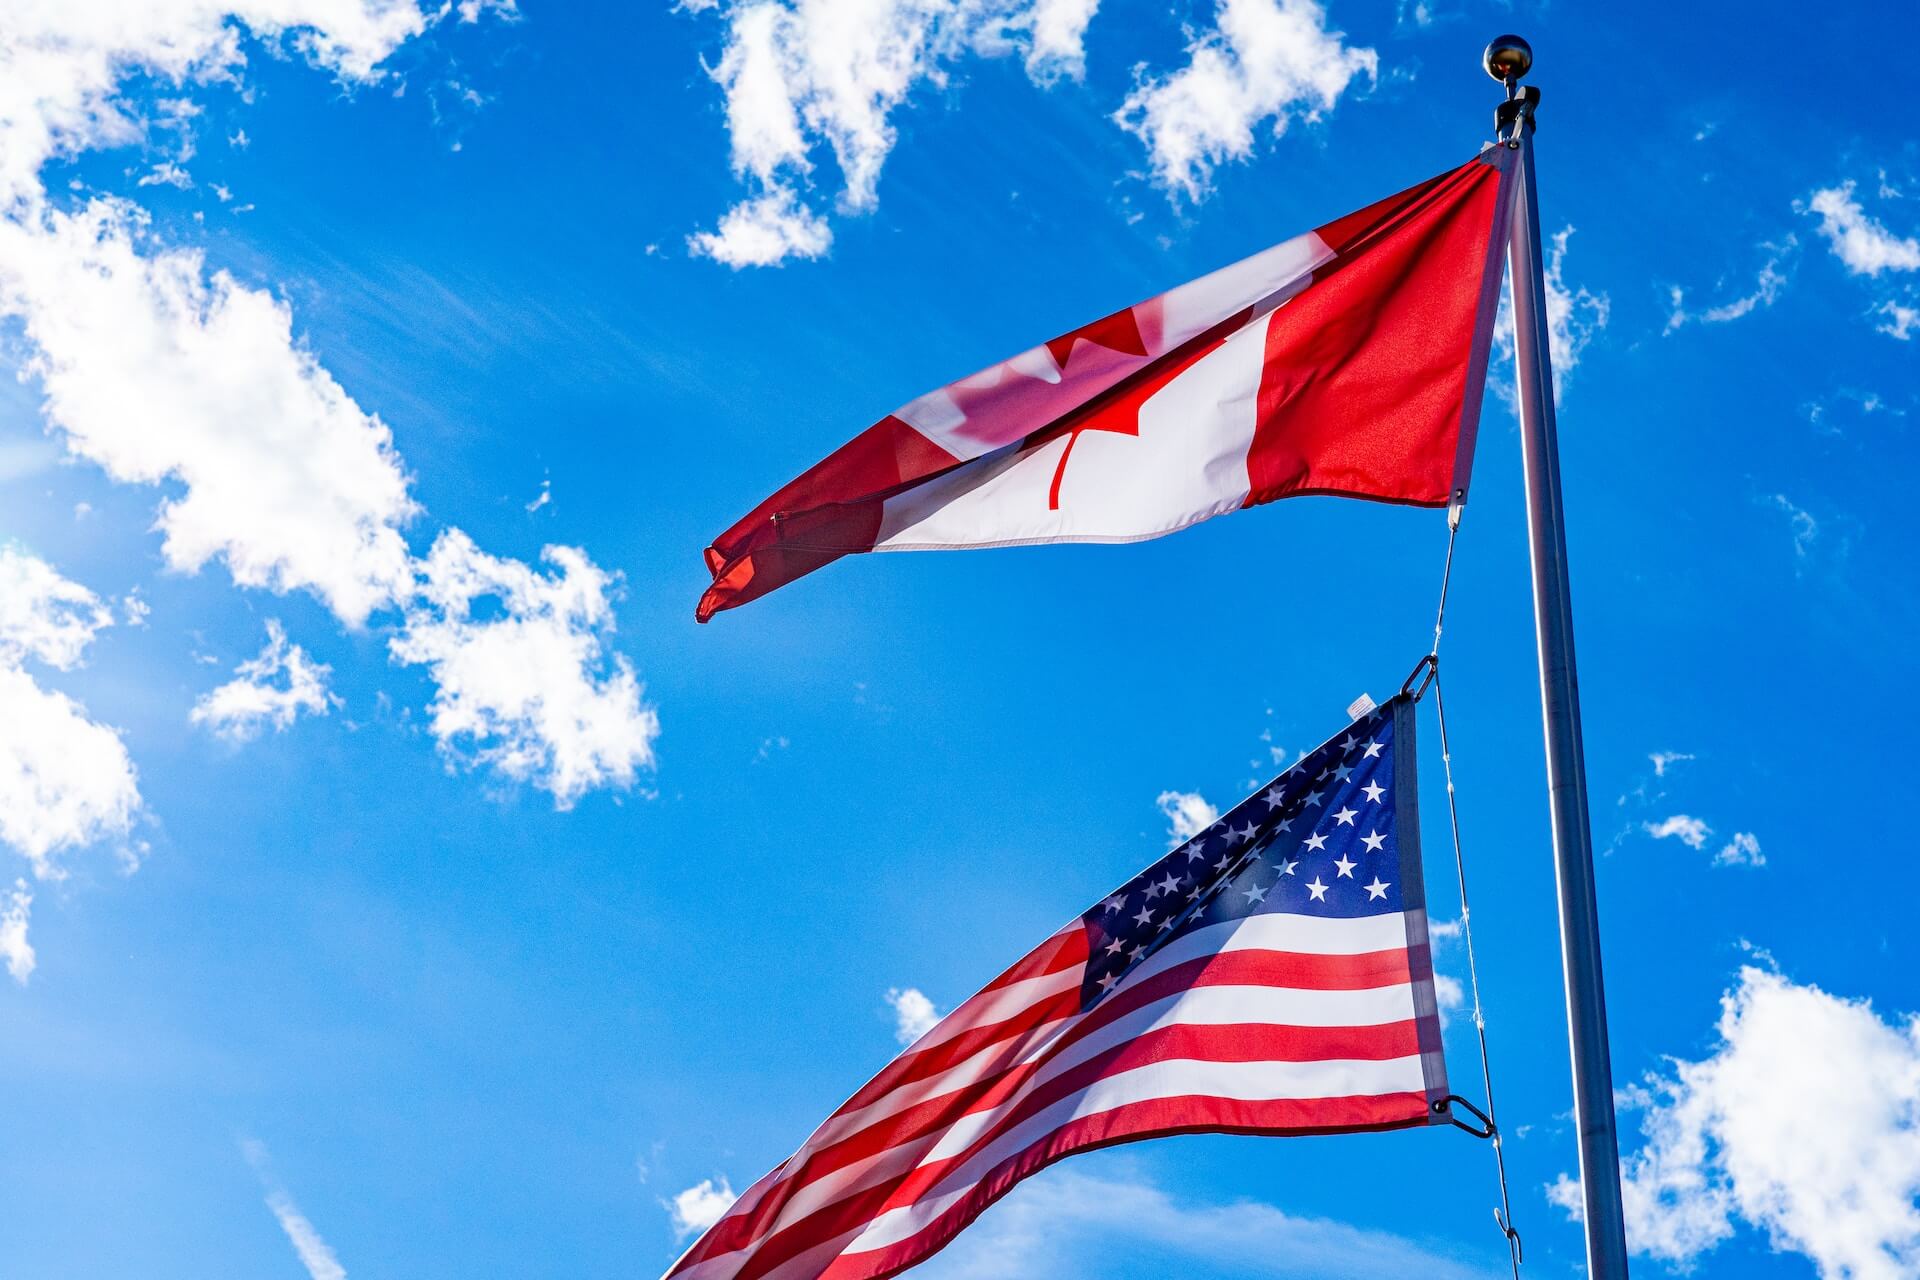
Canadian and America flags flying together

Operators who wonder how many independent restaurants there are throughout America and Canada finally have their answer thanks to Datassential.

The well-known food and beverage research and intelligence platform’s recent infographic reveals the state of indies in both countries.

For the purposes of their infographic, Datassential splits restaurants into two overarching categories. One major category is full-service restaurants, the other is limited-service.

From there, the platform organizes restaurants into five segments: casual, QSR, midscale, fast casual, and fine dining.

To my understanding, QSR and fast casual fall under Datassential’s limited-service designation. Casual, midscale, and fine dining are full-service restaurants.

To review the infographic yourself, please click here.

Number of Indie Restaurants: America

According to Datassential, there are 483,885 independent restaurants in the US.

Of those restaurants, 57 percent are full-service. It follows, then, that 43 percent are limited-service.

Close to half—44 percent—of full-service restaurants in the US boast more than five years of being open. Just a quarter of limited-service restaurants (26 percent) can claim the same.

This does, anecdotally, make some sense. QSRs and fast-casual brands have been on the rise over the past couple of years. In fact, some casual chains are developing and launching QSR brands off the strength of the category.

Finally, 21 percent of full-service restaurants in the US see annual sales under $500,000. That number climbs to 27 percent for limited-service restaurants.

Now, let’s take a look at independent restaurants in Canada.

Number of Indie Restaurants: Canada

Per Datassential, there are a total of 59,914 independent restaurants throughout Canada.

The split between full-service restaurants and limited-service restaurants is just about even. Fifty-one percent of indie restaurants in Canada are full-service. Forty-nine percent are limited-service operations.

A little under 40 percent of full-service independent restaurants in Canada (36 percent) can say they’ve been operating for more than five years. That number is 28 percent for limited-service restaurants.

Interestingly, just five percent of independent full-service restaurants in Canada bring in less than $500,000 in sales annually. That number jumps to 34 percent when we look at the limited-service category.

Indie Restaurants by Segment

The breakdown of the five Datassential independent restaurant categories is the same for America and Canada.

Most independent restaurants in either country are casual. Following, in descending order of number of restaurants, are QSR, midscale, fast casual, and fine dining.

For America, the numbers are as follows:

  • Casual: 37 percent
  • QSR: 34 percent
  • Midscale: 19 percent
  • Fast casual: 9 percent
  • Fine dining: 1 percent

And for Canada the breakdown is nearly identical:

  • Casual: 37 percent
  • QSR: 30 percent
  • Midscale: 18 percent
  • Fast casual: 14 percent
  • Fine dining: 1 percent

There are eight times as many independent restaurants in America as there are in Canada. But as you can see, the industry segmentation by country is nearly the same.

Future independent operators can look at this information a few different ways. They can choose to join the most popular segments and differentiate themselves from the competition. They can look for and fill a need for an indie fast-casual or fine-dining concept. Or they can shoot for the middle and go midscale, a segment that’s gaining traction across several hospitality industry sectors.

For you own copy of Datassential’s infographic, follow this link.

Image: chris robert on Unsplash

KRG Hospitality. Restaurant Business Plan. Feasibility Study. Concept. Branding. Consultant. Start-Up.

by David Klemt David Klemt No Comments

US Operators, Take Action Today

US Operators, Take Action Today

by David Klemt

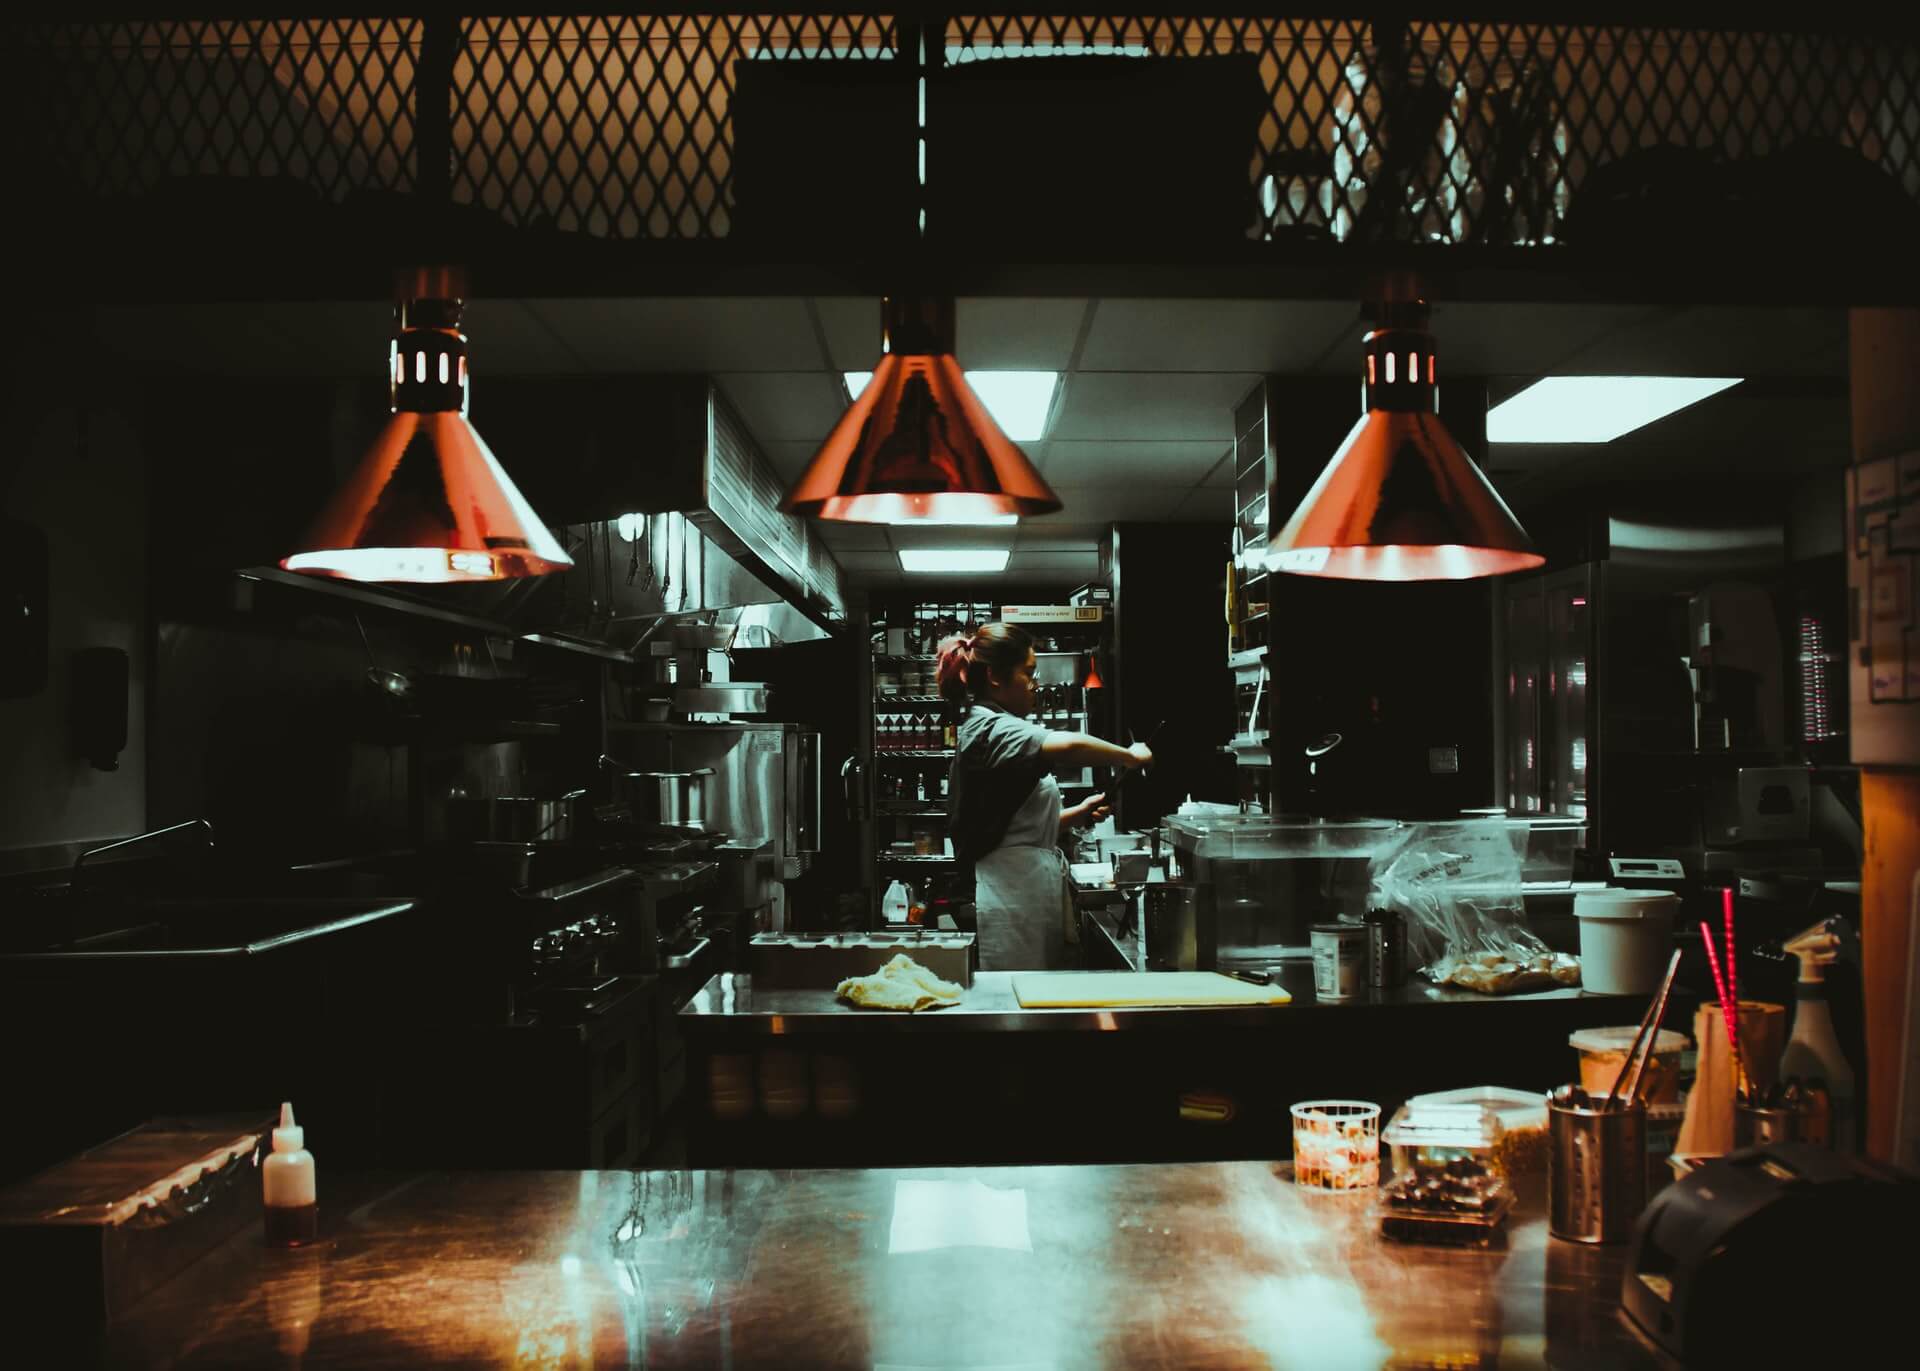
Chef doing prep alone in kitchen

Today is the day to let Congress know the clock has run out on our patience for them act on replenishing the RRF.

In all honesty, the industry’s tolerance for governmental inaction on the RRF ran out last year. Right around the time, I’d say, the RRF application portal closed, leaving almost 200,000 applicants without crucial grants. As a reminder, the portal closed after just 21 days of launching.

Today is the National Day of Action to Save Restaurants. The Independent Restaurant Coalition is leading the charge for this campaign.

To participate, follow the IRC on Instagram, Facebook, and Twitter. Additionally, click here to sign up for their emails. Spread the word and encourage staff, guests, your family members, and friends to take part as well.

Below you’ll find more details for taking action to #SaveRestaurants and #SaveBars today and moving forward.

Industry Advocacy

The IRC has been fighting and advocating for the industry since the start of the pandemic. Today, they’re asking owners, operators, workers in all segments of the industry, communities, and guests to throw their support behind this crucial fight.

So, today is the day to inundate your representatives with phone calls. Dial this number to reach the Capitol switchboard: 202-224-3121. The IRC provides state-specific fact sheets, which can be found here.

For an example of what you’ll find on a state’s fact sheet, here are some details for Nevada:

  • The leisure and hospitality industry accounts for 87.6 percent of all jobs lost in the state.
  • In Nevada, the industry is worth $9.9 billion, with 5,980 restaurants and bars throughout the state.

Those are just two pertinent facts about the industry in Nevada.

Along with phone calls, people should contact their representatives via email. Follow this link to email Congress and tell them to replenish the RRF.

Send a Message

Of course, social media will also play an important part in today’s campaign. Flooding Instagram, Facebook, Twitter, and other channels with #SaveRestaurants, #SaveBars, and #ReplenishRRF should get Congress’ attention in a very public, very newsworthy way.

Click here to access the IRC’s social media and website toolkit.

It’s time to let Congress know we’re doing waiting for action. We’re done with the lip service, platitudes, and empty words of support. And we’re done with the broken promises, disarray, and inaction.

Personally, I plan on once again letting my state representatives know that I’m watching. Those who don’t do their jobs and help replenish the RRF won’t be receiving my vote. I can’t support those who won’t support us. Whether you want to send that message is up to you.

Today, however, make your voice heard and send at least this message: We demand Congress acts now.

Image: Rohan G on Unsplash

Top