Notice: Function _load_textdomain_just_in_time was called incorrectly. Translation loading for the smart-post-show-pro domain was triggered too early. This is usually an indicator for some code in the plugin or theme running too early. Translations should be loaded at the init action or later. Please see Debugging in WordPress for more information. (This message was added in version 6.7.0.) in /var/www/wp-includes/functions.php on line 6114
Midscale restaurant | KRG Hospitality

Midscale restaurant

by David Klemt David Klemt No Comments

2023 State of the Menu: Datassential

2023 State of the Menu: Datassential

by David Klemt
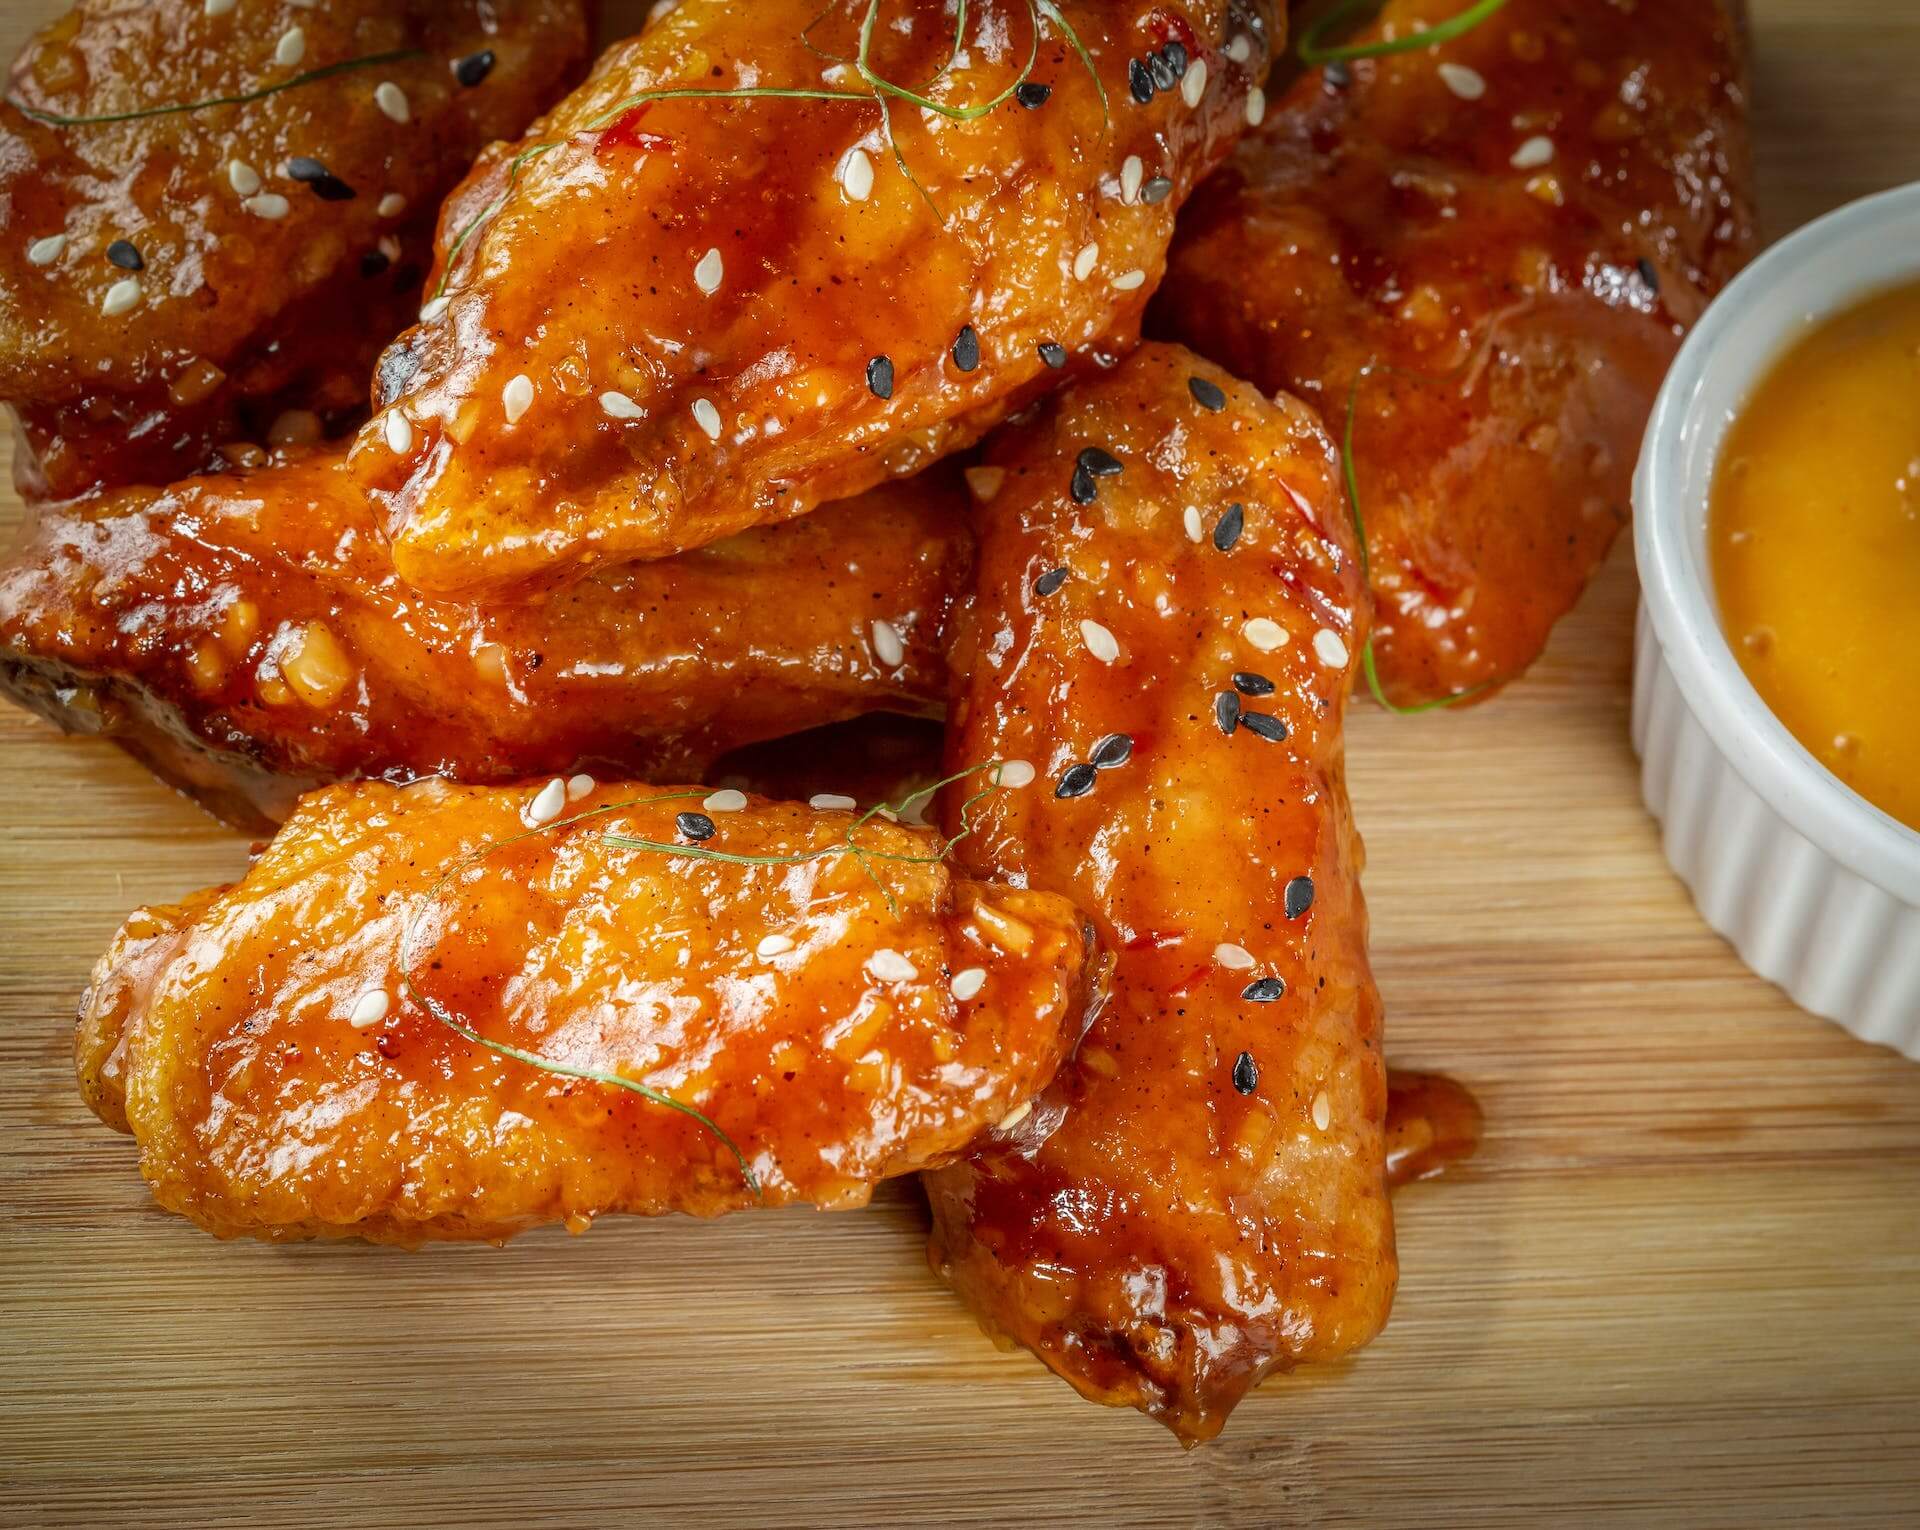
Korean fried chicken wings

The annual 2023 State of the Menu by Datassential includes an interesting metric to gauge restaurant recovery: menu size by segment.

Hosts Jack Li, Mike Kostyo, and Claire Conaghan discuss a handful of topics during this webinar. Host Li touches on food-forward cities at the beginning of this presentaiton. Kostyo shares some of the most innovative menu items out there right now. And Conaghan dives deep into menu trends.

Industry professionals interested in watching this webinar on demand can register to do so here.

There are a handful of metrics people are using to measure post-pandemic restaurant recovery. Labor is, of course, receiving a lot of attention. People are also tracking traffic, average check size, revenue, and profits.

One metric Datassential is keeping tabs on is menu size per restaurant segment. Additionally, they’re tracking each segment’s top-growing food and beverage items.

Notably, however, in tracking menu size, Conaghan focuses solely on food and non-alcohol beverage items, omitting catering and alcohol.

Chains vs. Independents

Starting things off, Conaghan addresses the overall menu size trend. That is, menus are noticeably smaller in comparison to pre-pandemic sizes.

Interestingly, chain restaurants don’t appear to be in any rush to move away from this trend. In fact, Conaghan notes that chains appear to be further reducing the size of their menus. This has been the trend over the past 12 months.

According to Conaghan, fine dining also seems to be happy to shrink their menus. Menu size shrunk the most among restaurants in this segment. In comparison, quick-service menu sizes decreased the least.

However, independent restaurant operators appear to be going in the opposite direction from their chain counterparts. In contrast, indies have been growing the size of their menus the past 12 months.

Menu Size by Segment

Fast Casual

Per Conaghan, the only segment to reach pre-pandemic menu size is fast casual. In fact, this category of restaurant is often exceeding pre-pandemic items-per-menu size.

This increase in menu size is attributable to operators “leaning into” core cuisine items. For example, sandwiches, Mexican entrees, and pizza.

However, the fastest-growing food item on fast-casual menus is the chicken wing. According to Conaghan, it’s easy for operators to innovate with chicken wings.

A restaurant doesn’t have chicken wings? All they have to do is add them, starting with simple preparations. If a restaurant does have chicken wings on the menu already, innovation is as simple as adding new flavors.

As far as the fastest-growing drink for fast-casual restaurants, it’s dessert beverages.

QSR, Casual Dining, and Midscale

These three segments are “very, very close” to reaching pre-pandemic menu sizes.

As midscale operators are likely very aware, this segment tends to have the largest menus. I wouldn’t be surprised, therefore, if a number of midscale concepts review their items per menu, their costs, and decide they can perform well with slightly smaller menus moving forward.

Unsurprisingly, chicken wings are the food item growing most quickly on QSR food menus. Oh, and barbecue chicken wings are the fastest-growing food item among casual dining restaurants.

Perhaps a bit more eyebrow-raising is the fastest-growing beverage type for QSRs: energy drinks. Boba and flavored iced teas are growing fastest on casual-dining drink menus.

For midscale restaurants, dessert samplers are the fastest-growing food items. Think “dessert charcuterie” when trying to picture a dessert platter. Another way to think about the dessert sampler is a static dessert cart with small bites of each dessert on the menu.

Fine Dining

Again, this segment is the furthest from pre-pandemic menu size. And, again, operators in this category seem happy with this trend.

An interesting note Conaghan makes about this segment is what many operators are using to fill out their menus: desserts. This is, she says, an area where fine dining can differentiate itself from other concepts.

Per Conaghan, bao, applesauce, and summer squash are growing the fastest on fine-dining food menus.

Now, I may have slipped into a fever dream during this portion of the Datassential webinar. Because unless I’m mistaken, the Shirley Temple has been identified as the fastest-growing beverage in the fine-dining space.

Pricing

Okay, so this segment of the 2023 State of the Menu webinar isn’t really a recovery metric.

However, it’s interesting, and something Jack Li says about chain restaurant pricing made me chuckle.

Most Expensive vs. Least Expensive

First, some straightforward data.

The following list identifies the five most-expensive ZIP codes for chain restaurant menu pricing. Anyone who wants the full list of 15 most-expensive ZIP codes can watch the webinar.

  • 10036 (New York, NY)
  • 96707 (Kapolei, HI)
  • 98902 (Yakima, WA)
  • 96815 (Honolulu, HI)
  • 99503 (Anchorage, AK)

It’s understandable to think this would consist entirely of New York City, Los Angeles, or San Francisco ZIPs. But when we consider what it costs operators to import food to Hawaii and Alaska. Additionally, Washington and New York are among the states with the highest minimum wage. Operators need to recover those costs somehow.

And now the five least-expensive ZIP codes:

  • 78526 (Brownsville, TX)
  • 75224 (Dallas, TX)
  • 76106 (Fort Worth, TX)
  • 31907 (Columbus, GA)
  • 31701 (Albany, GA)

Pricing Logic

Now, on to what Li says during the webinar that makes me laugh.

Nationwide, the average price of a McDonald’s Big Mac in the US is $5.26. (A caveat: This webinar took place in October. This price may have increased or decreased by now.)

However, the lowest price for a Big Mac is $3.49 at a location in Wilburton, Oklahoma.

So, what’s the highest price, and where can one find these pricey Big Macs? Three McDonald’s locations sell the burger for $8.29. That’s nearly two-and-a-half times the lowest-priced Big Mac.

Summarizing pricing variations among chain restaurants succinctly, Li made me laugh with the following: “Store pricing often just doesn’t make sense.”

Going further, Li says Datassential shows that the more franchised a restaurant chain is, the more variances in pricing will occur.

The full webinar can be viewed here.

Image: Leonardo Luz on Pexels

Bar Nightclub Pub Brewery Menu Development Drinks Food

by David Klemt David Klemt No Comments

Datassential Ranks Food-forward Cities

Datassential Ranks America’s Most Food-forward Cities

by David Klemt

San Francisco skyline and bay at night

Let’s take a look at food and beverage intel platform Datassential’s ranking of the 158 most food-forward cities in America as 2023 comes to a close.

We are, in part, reviewing this list because of Wallethub’s “Best Foodie Cities in America” report. You can find our thoughts on that ranking here.

To summarize, however, Wallethub prioritizes “wallet-friendliness,” or “the best and cheapest” cities for foodies. In contrast, Datassential’s ranking is a scientific attempt to quantify the “food-forward” status of a given city.

“It’s the diversity of cuisines, the prevalence of emerging foods and flavor trends and residents’ appetite for varied menus, that make a city food forward,” writes Samantha Des Jardins, content marketing manager at Datassential.

We at KRG Hospitality are big fans of Datassential and find the company to be a credible source of industry insight. Earlier this year they tackled video versus static photography, and the flavors and menu items they predicted would be big in 2023.

To review Datassential’s ranking and download the full list for yourself, click here.

The Top 25 Food-forward Cities

Alright, I know why you’re here. Below, you’ll find the highest-ranked cities on the Datassential list.

(Note: Due to the scoring, some cities are tied in terms of overall points. Where this is the case, it has been noted.)

  1. San Francisco, California
  2. Los Angeles, California
  3. Miami, Florida
  4. Washington, DC
  5. San Diego, California
  6. New York, New York
  7. Houston, Texas
  8. Monterey, California
  9. Las Vegas, Nevada
  10. Austin, Texas
  11. Sacramento, California
  12. West Palm Beach, Florida
  13. Atlanta, Georgia
  14. Dallas, Texas (tie with Atlanta)
  15. Albuquerque, New Mexico
  16. Phoenix, Arizona
  17. Portland, Oregon
  18. Palm Springs, California
  19. Seattle, Washington
  20. Orlando, Florida
  21. Denver, Colorado (tie with Orlando)
  22. Honolulu, Hawaii (tie with Orlando and Denver)
  23. Salt Lake City, Utah
  24. Tampa, Florida
  25. Fresno, California (tie with Tampa)

So, the top tenthe entire top 25, reallyare most likely not much of a surprise. When I talk about cities as the “usual suspects” for rankings like these, I’m talking about New York, LA, San Francisco, Miami, etc.

However, not every usual suspect is among the top 25. Notably, Chicago just fails to make the cut, earning number 26 on this list. In fact, five “big cities” are absent from Datassential’s top ten: Dallas, Phoenix, San Antonio, Chicago, and Philadelphia.

Another interesting detail? Whereas Orlando holds the number-one spot on Wallethub’s list, it’s number 20 on Datassential’s ranking.

Of their respective top tens, the two lists have just five cities in common: Miami, San Francisco, San Diego, Las Vegas, and Austin.

Methodology

Since the two lists are vastly different when we contextualize what they quantify, it should come as no surprise that Datassential and Wallethub’s methodologies are likewise dissimilar.

Whereas Wallethub scored affordability, and diversity, accessibility, and quality, Datassential weighed different metrics.

For their “Most Food-forward Cities in US,” Datassential scored the following:

  • Race to 90;
  • Ethnic restaurant diversity; and
  • Trend-forwardness.

During Datassential’s annual State of the Menu webinar, Jack Li, executive chairman, board of directors explained each of these metrics.

Race to 90

The number different cuisine types required in a particular metro area before reaching 90 percent of restaurants.

For the curious, Miami is the most-diverse city by this metric.

Ethnic Restaurant Diversity

Datassential asks the following question to measure this metric: What is the proportion of ethnic restaurants compared to all restaurants in a metro area?

Trend-forwardness

Based on a dataset developed by Datassential which tracks a number of points, from food and drink items to flavors, keywords, and beyond.

The company continuously polls consumers by ZIP code to measure consumer knowledge of upcoming trends, then aggregates the ZIP codes to measure a metro area.

The Bottom Eleven

Why am I listing the bottom eleven rather than bottom ten? There’s a tie for number 149 among these 158 cities.

There are nearly 800 cities in the US with populations of 50,000 or more. Therefore, it’s reasonable to argue that even the bottom of this list boast respectable food scenes.

  1. Youngstown, Ohio
  2. Rockford, Illinois
  3. Peoria, Illinois
  4. Johnstown, Pennsylvania
  5. Billings, Montana
  6. Traverse City, Michigan
  7. Sioux Falls, South Dakota
  8. La Crosse, Wisconsin
  9. Green Bay, Wisconsin
  10. Fargo, North Dakota
  11. Wausau, Wisconsin

In case you’re wondering, Datassential and Wallethub’s lists don’t share any bottom ten (or eleven) cities.

So, there you have it: San Francisco earns the top spot among Datassential’s food-forward cities. And Wausau earns number 158, which is still notable.

Image: Daiwei Lu on Unsplash

Bar Nightclub Pub Brewery Winery Property Development Drawings

by David Klemt David Klemt No Comments

Wallethub Ranks Best Foodie Cities in US

Wallethub Ranks America’s Best Foodie Cities

by David Klemt

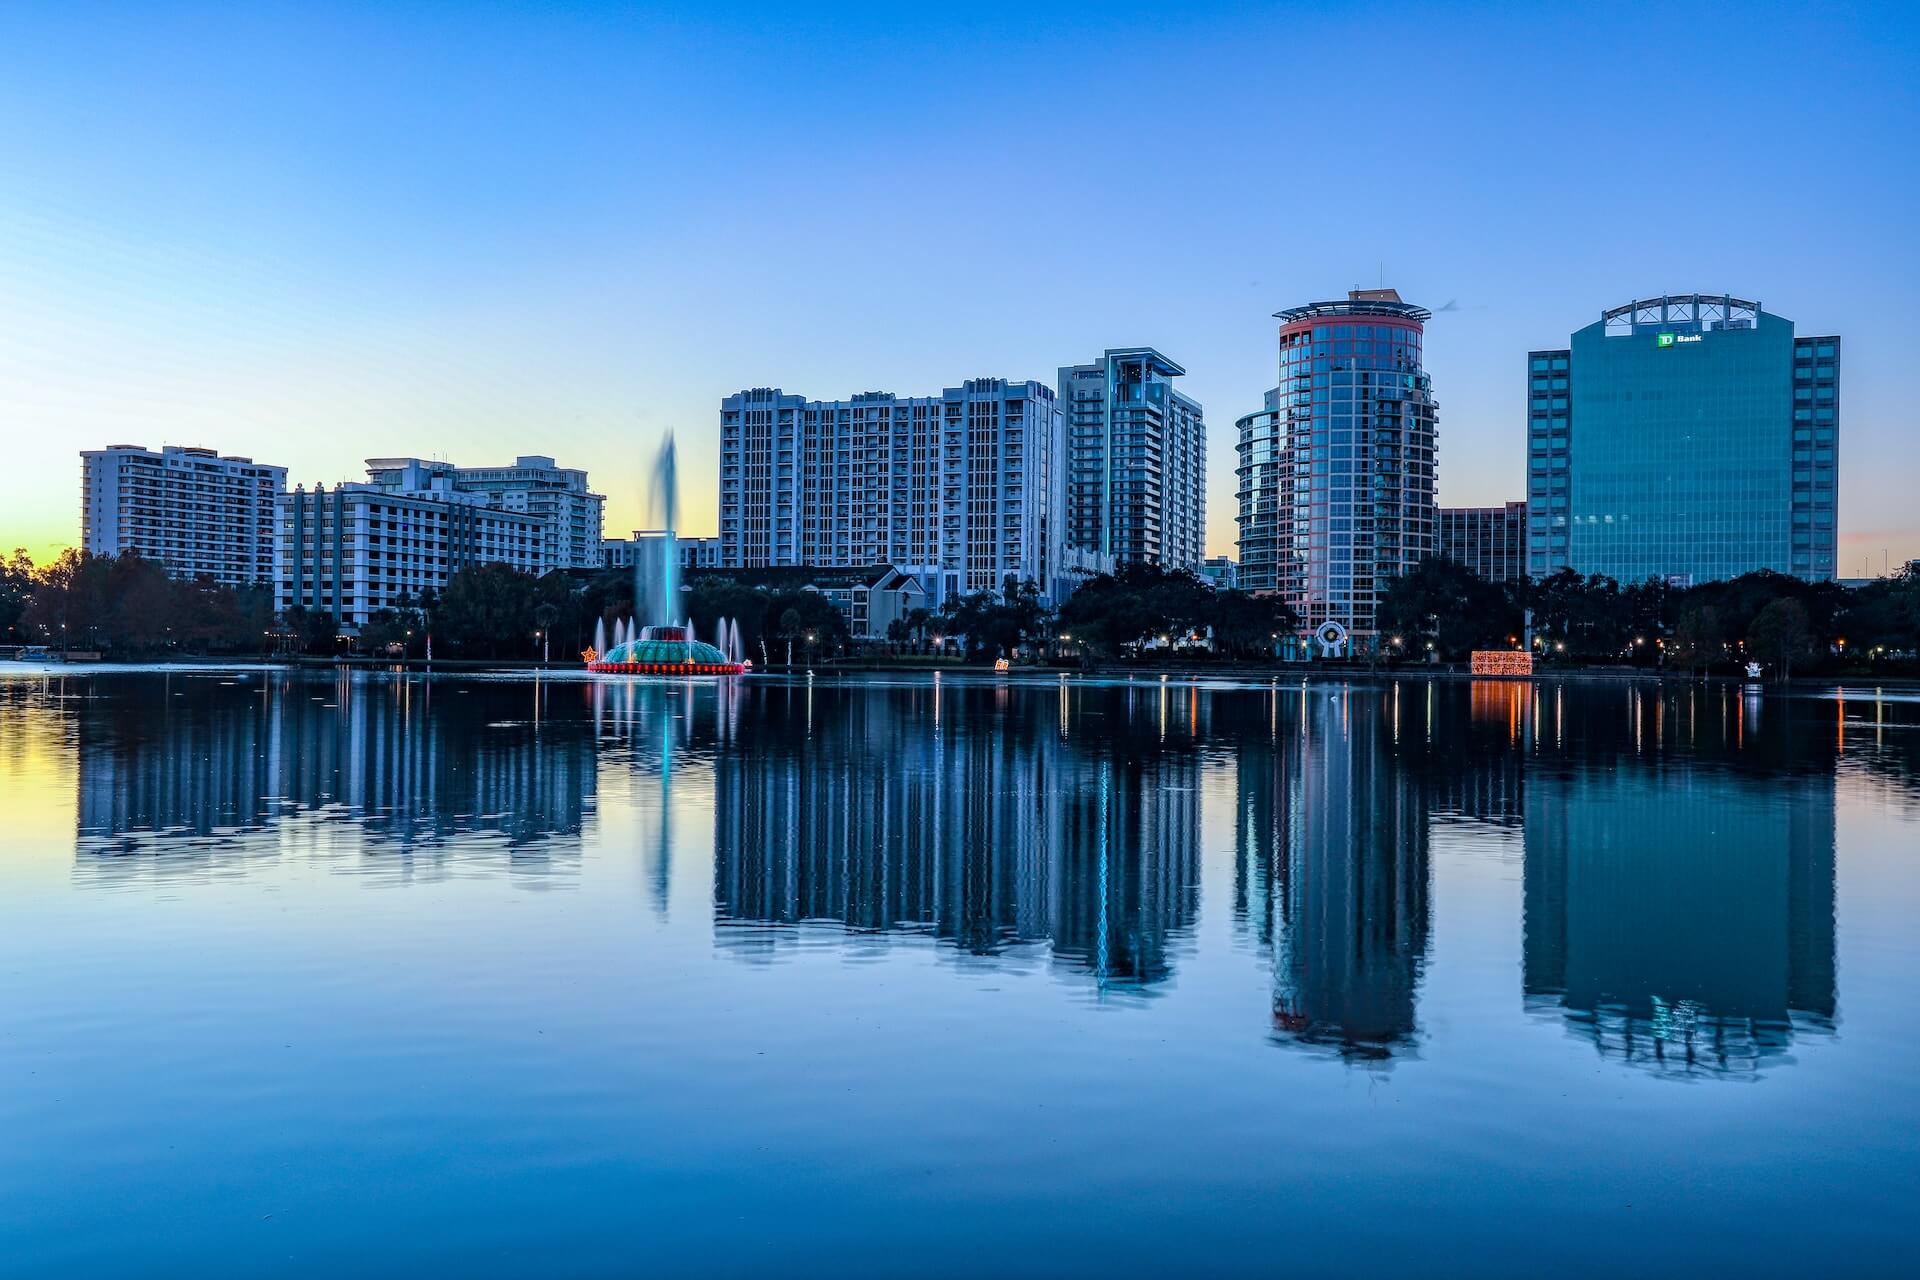
Eola Lake Park in Orlando, Florida

Comparing 182 cities across more than two dozen “food-friendliness” indicators, Wallethub has revealed their rankings for America’s best foodie cities in 2023.

Why 182 cities? Wallethub started with 150 of America’s most-populous cities. Then, they added “at least two” of the most-populous cities in each state.

Regarding the ranking itself, Wallethub compared the cities against two key measures: affordability, and diversity, accessibility, and quality. Those two measures consist of 28 key indicators, including:

  • cost of groceries;
  • restaurant meal cost;
  • sales tax;
  • food tax;
  • restaurants per capita;
  • ratio of full-service to fast-food restaurants; and
  • restaurant diversity.

Using a 100-point grading system, affordability was worth up to 30 points. Simple math shows diversity, accessibility, and quality indicators were worth up to 70 points.

Further, Wallethub valued indicators anywhere from half-weight (international grocery stores per capita) to triple weight (restaurants per capita).

Now, it’s important to contextualize Wallethub’s use of the word “foodie city” here. For their ranking, the company is identifying “the best and cheapest” cities for consumers for whom eating is an experience, hobby, and/or lifestyle.

“These wallet-friendly cities cater to diners who prefer to cook at home, explore the local flavors or both,” reads their post, which can be reviewed in its entirety here.

The Top 25

So, per Wallethub, the cities below are the top 25 among the 182 “best foodie cities in America in 2023.”

  1. Orlando, Florida
  2. Portland, Orgeon
  3. Sacramento, California
  4. Miami, Florida
  5. San Francisco, California
  6. Tampa, Florida
  7. San Diego, California
  8. Las Vegas, Nevada
  9. Austin, Texas
  10. Seattle, Washington
  11. Denver, Colorado
  12. Atlanta, Georgia
  13. Los Angeles, California
  14. Chicago, Illinois
  15. Richmond, Virginia
  16. Pittsburgh, Pennsylvania
  17. Washington, DC
  18. St. Louis, Missouri
  19. Houston, Texas
  20. New York, New York
  21. Oakland, California
  22. Phoenix, Arizona
  23. Santa Ana, California
  24. Grand Rapids, Michigan
  25. Cincinnati, Ohio

Interestingly, you’ll find the “usual” foodie scene suspects on this list. However, a mere handful of those cities are ranked in the top ten: Miami, San Francisco, and Las Vegas.

Chicago (14), Los Angeles (13), and New York (20) don’t make the three or five. In fact, they’re out of the top ten entirely here.

If affordability is a major factor here, it raises an eyebrow that Miami is among the top five foodie cities. After all, sources show the cost of living in the city is 20 percent higher than the national average. The cost of living in San Francisco is nearly 80 percent higher.

At any rate, Orlando, per Wallethub’s methodology, is the number-one foodie city in America.

Compelling Comparisons

With the top 25 foodie cities out of the way, let’s check out a few other interesting comparisons.

Cost of Groceries

Lowest-cost cities, in descending order:

  1. Brownsville, Texas
  2. Corpus Christi, Texas
  3. Laredo, Texas
  4. Fayetteville, North Carolina
  5. Austin, Texas

The cities with the highest cost of groceries are Honolulu and Pearl City in Hawaii.

Restaurants per Capita

The cities with the most restaurants per capita, again in descending order:

  1. Miami, Florida
  2. Orlando, Florida
  3. Las Vegas, Nevada
  4. San Francisco, California
  5. Los Angeles, California

It’s important to note each of the cities on this list is, per Wallethub, tied for first place.

The city with the fewest restaurants per capita is Pearl City, Hawaii.

Ratio, FSR to Fast Food Restaurants

On this list, the five cities with the highest ratio of full-service restaurants to their fast-food counterparts (yes, in descending order):

  1. Cape Coral, Florida
  2. Santa Rosa, California
  3. Portland, Maine
  4. Burlington and South Burlington, Vermont

That leaves the city with the lowest ration, which is Jackson, Mississippi.

The Bottom Ten

Now that we know which cities Wallethub identifies the best foodie cities in the US, let’s take a look at the bottom of their list.

  1. Augusta, Georgia
  2. Fontana, California
  3. Jackson, Mississippi
  4. Moreno Valley, California
  5. Mobile, Alabama
  6. Montgomery, Alabama
  7. West Valley City, Utah
  8. Nampa, Idaho
  9. Shreveport, Louisiana
  10. Pearl City, Hawaii

Personally, I find the data regarding restaurants per capita and the FSR to fast-food ratio the most useful.

To review this report in its entirety, including Wallethub’s methodology, please click here.

Image: Mick Haupt on Unsplash

Bar Pub Brewery Nightclub Club Nightlife Concept Development

by David Klemt David Klemt No Comments

Ontario Updates Employment Standards Act

Ontario Updates Employment Standards Act

by David Klemt

Daytime photo of the Toronto, Ontario, Canada, skyline

Yesterday, Ontario, Canada’s government tabled updates to the province’s Employment Standards Act meant largely to protect restaurant and hospitality workers.

These explicit protections are known as Bill 79, Working for Workers Four Act, 2023.

Interestingly and timely, the updates seem to be, at least in part, a direct response to technological developments.

For example, Bill 79 addresses digital payment apps and artificial intelligence. I’ll expand on that below.

These updates certainly appear to have been drawn up to protect restaurant workers specifically, and hospitality professionals overall.

An End to Unpaid Trial Shifts

One of the most significant updates addresses hours and pay.

It likely shouldn’t have to be said but, according to Ontario law, an employee must be paid for all the hours they work. This includes trial shifts.

Specifically, the new legislation expressly prohibits unpaid trial shifts.

Pooling Tips

Employers in Ontario are well within their rights to share in pooled tips. That is, if the employer is performing the same tasks as staff.

However, there’s now an update to this practice within the Employment Standards Act.

If any employer intends to share in a tip pool, they must make this clear and inform staff.

Speaking of Tips…

For the most part, digital payment platforms bring with them transaction fees. This includes fees for restaurant workers to get their tips.

“We’re seeing apps that are taking a cut every time…a worker accesses their tips, and that’s not acceptable,” says Piccini.

So, moving forward, employees who are paid tips via direct deposit will have more control. The updates to the Employment Standards Act now state that employees paid this way can choose where their tips will be deposited.

Deducting Wages

Per multiple studies, one in 20 diners has dined and dashed. Apparently, it has been common practice for some employers to deduct wages in response.

Personally, I think it’s ridiculous for any employers to pass a business loss on to their workers. That’s neither good leadership, ethical, or a healthy work culture. I’m not saying I’m surprised it happens; I’m disgusted that it still happens.

Now, the practice of penalizing employees monetarily for guests dining and dashing is prohibited specifically. Will that stop it from happening? Probably not, although perhaps it will happen much less moving forward.

This also includes language that makes it illegal to deduct pay from employees due to customer “gassing and dashing.” For anyone wondering, gas theft affected Ontario businesses to the tune of $3 million CAD in 2022.

Artificial Intelligence

Some employers, as many job hunters are aware, use artificial intelligence during the hiring process.

Now, these employers will have to disclose their use of AI in job listings. In theory, this update addresses privacy and data collection concerns.

Further, job listings will now have to include salary ranges. Also, employers are now prohibited from requiring work Canadian work experience in their job listings or on their application forms.

To review Bill 79 in its entirety, click here.

Image: mkdrone_ on Unsplash

Bar Nightclub Pub Brewery Operations Standard Operating Procedures SOP

Top