Community Collaboration: Working with Local Influencers
by David Klemt
One of the standout educational sessions from WSWA Access Live 2024 focused on finding and working with local influencers.
Natalie Migliarini, a.k.a. Beautiful Booze, and James Stevenson, a.k.a. Little Lane Media, presented “Successfully Engaging with Influential Content Creators in Your Community” in Las Vegas, Nevada, last week. The duo made the case for seeking to collaborate with influencers in your community.
“Local influencer” may give the impression of less popularity and less reach. After all, another designation for these people is “micro-influencer.”
However, there are several reasons why working with local or micro-influencers is a smart move for your bar, restaurant, nightclub, cafe, or hotel.
It helps to understand that some marketing experts categorize influencers by follower count:
- Nano: 1,000 to 10,000 followers
- Micro: 10,000 to 100,000 followers
- Macro: 100,000 to 1,000,000 followers
- Mega: 1,000,000-plus followers
I don’t know about you, but I think reaching a potential 10,000 followers local to my area of operation is an excellent value proposition. If you’re curious, Migliarini’s Beautiful Booze Instagram account falls into the macro category.
Of course, there are other appealing benefits as well.
Effective Marketing
What do You Want?
What are your goals when marketing your business? I’m willing to wager there are at least three:
- To be discovered by new people.
- Boosting traffic.
- Increasing revenue.
And what’s one of your greatest concerns when it comes to your marketing efforts? I’ll bet that it’s budget.
Well, Migliarini and Stevenson believe local or micro-influencers (and I’d say nano-influencers, as well) can tick all of those boxes.
What do You Want to Spend?
Local influencers will likely be much more affordable than their macro or mega counterparts. There are celebrities—part of the mega-influencer category—that can make millions of dollars for a single promotional post. Macro-influencers can command five figures for just one post.
Now, think about social media. Depending on the platform (Migliarini and Stevenson favor Instagram), these pricey posts can have a lifespan as short as 15 minutes. That’s a lot of money to spend on marketing for just minutes or hours of relevancy.
Then consider engagement. According to Migliarini and Stevenson, engagement is more important than reach.
View this post on Instagram
Who do You Want to Reach?
I’m sure the thought of people across the globe knowing your restaurant or bar is appealing. But would that really translate to more traffic and greater revenue?
Eventually, sure. But in the here and now, when building your brand and getting discovered, your local community is more important.
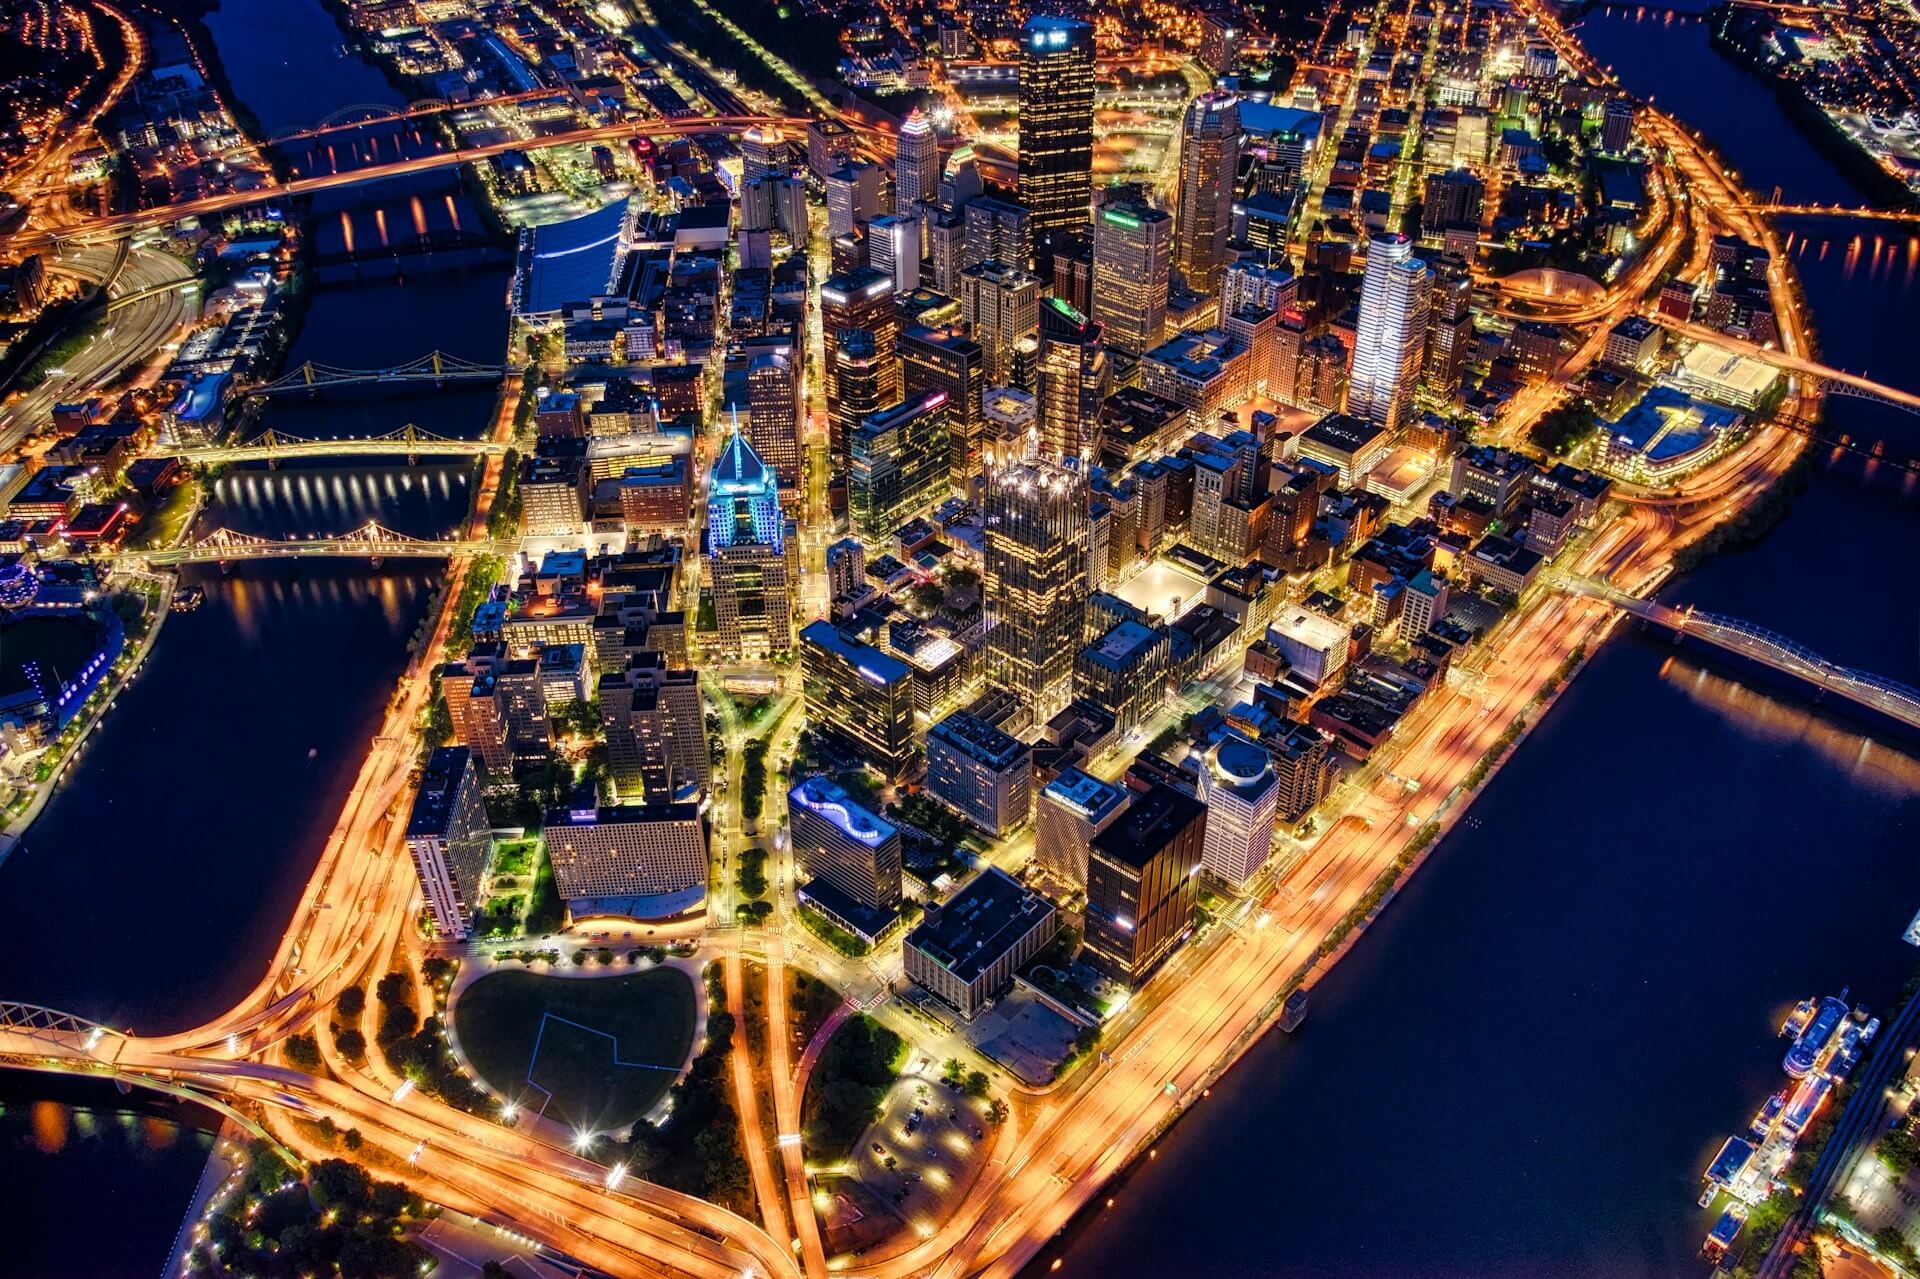
If you’re operating in the Chicago suburbs, will your revenue and margins improve because some social media users in Vancouver found your venue online? Or, would your business be better served by locals and people in the surrounding area visiting your spot on a regular basis?
I think you know the answer.
Well, this is where nano- and micro-influencers come into play. You want support from locals. Garnering that support via social media means you want influencers who are engaged with your community.
The partners you’re after are local influencers, not global (or national, until you’ve become a must-visit destination for tourists).
As Migliarini and Stevenson say, an influencer may be “micro” by follower count but “macro” in terms for their effectiveness in a particular market.
Effective Partnerships
How to Find Collaborators
The great news is that it’s not difficult to find local influencers. Let’s use Instagram as an example for finding collaborators.
When you pop open the app, you’ll see the search icon at the bottom of the screen. To make this very simple, it’s the magnifying glass to the right of the house icon.
Once you tap the magnifying glass icon, you’ll be able to search for basically anything in the search field. From this point, you’ll see several tabs to scroll through: For you, Accounts, Audio, Tags, Places, and Reels.
Of those fields, Tags will likely deliver some of the best results. Migliarini and Stevenson suggest following hashtags relevant to you and your business. From there, you’ll come across influencers local to your area of operation.
How to Select Collaborators
All engagement is not the same.
It’s going to be tempting to look for huge follower counts and tons of likes on posts. Well, Migliarini and Stevenson find a different metric far more effective in gauging an account’s engagement.
Instead of likes, look at comments. An influencer may have hundreds or thousands of posts. And those posts may have hundreds or thousands of likes.
Does that really mean much? If you use Instagram, think about your behavior on the app.
It’s likely that you scroll dozens of posts whenever you open Instagram. You probably hit the heart icon, liking a number of posts as you scroll.
Do you remember every post that you like? After liking posts, do you think about the account that posted it? Probably not.
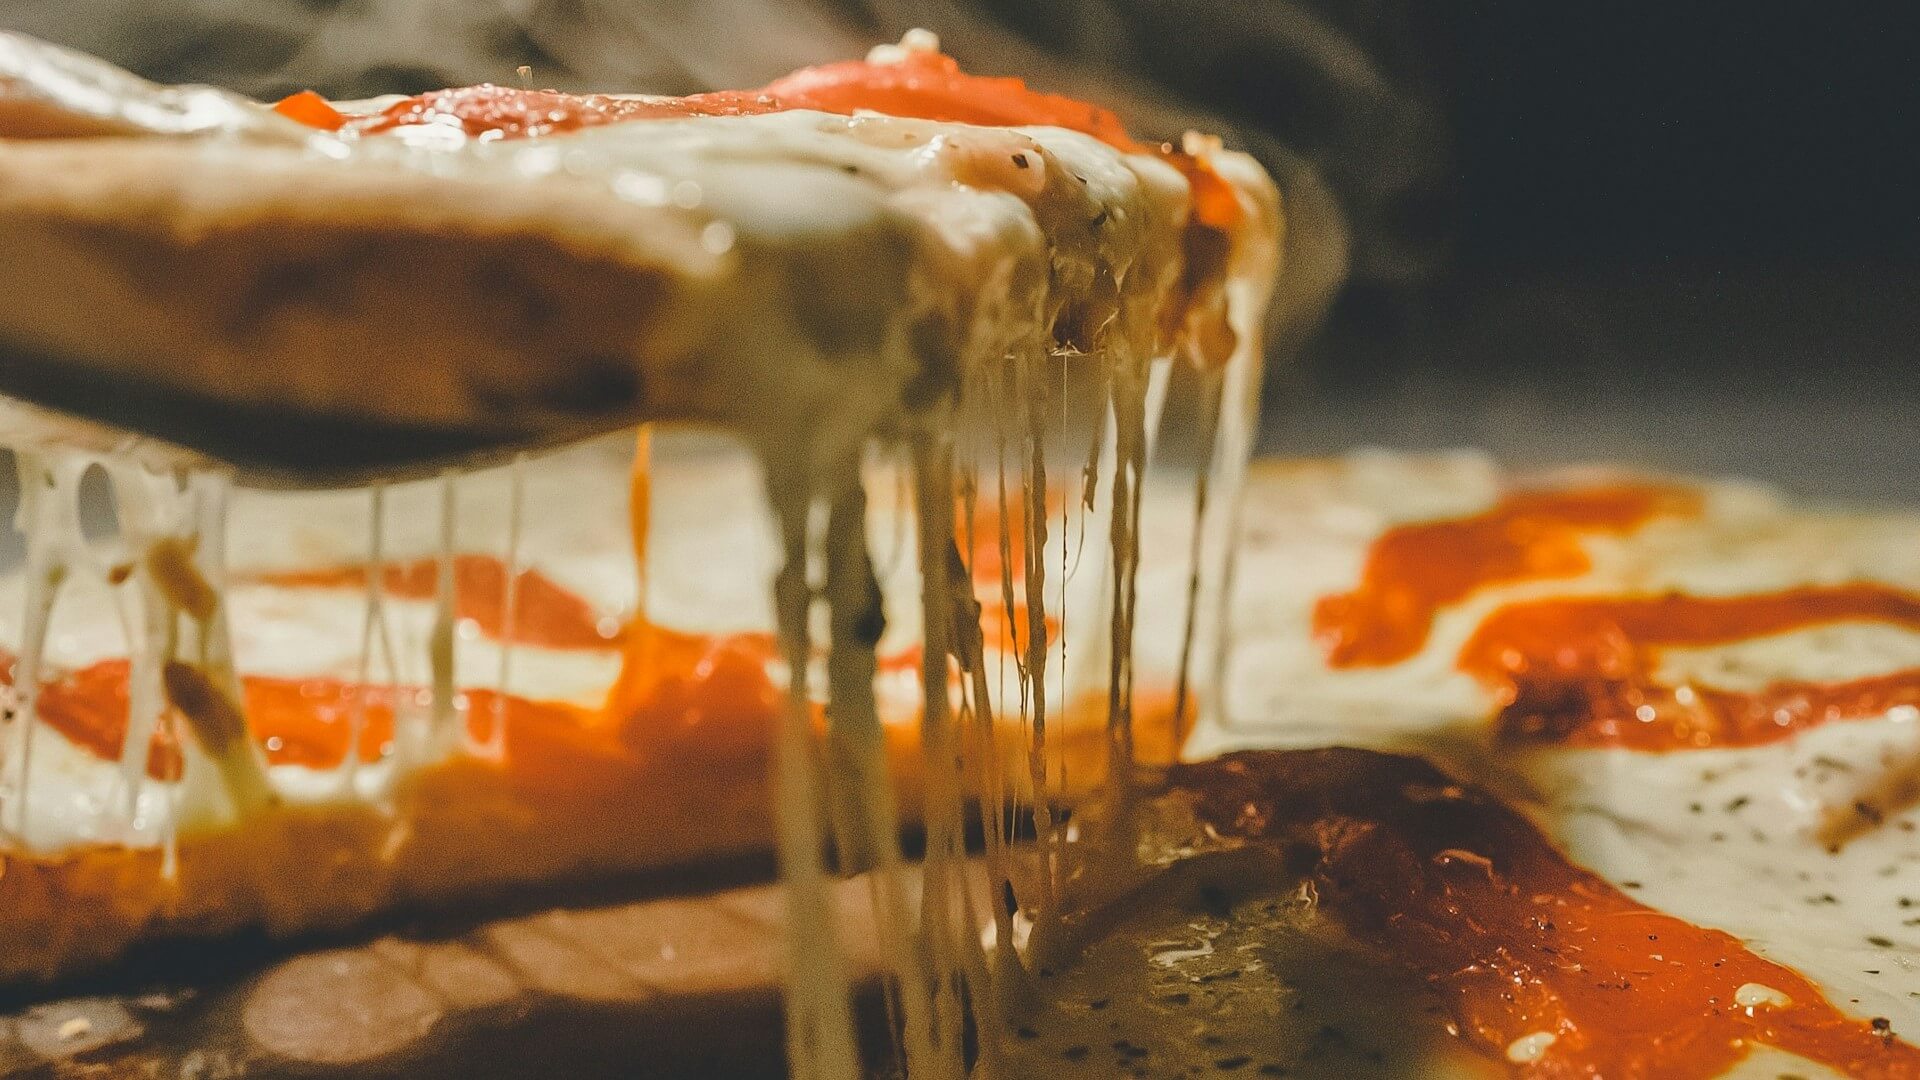
Now, let’s say you liked a post so much that you felt compelled to take the extra steps of commenting on it. If that was a post about a dish or drink from a bar or restaurant, that comment may convert into a visit or delivery order.
When you’re looking for a local influencer and going through posts, look at the number of comments. Hundreds or thousands of likes with just a handful of comments may indicate there’s not much engagement. But dozens or hundreds of comments? That’s a great sign.
Of course, you should also sift through the comments. Doing so can show you if the posts are mostly attracting bots. Further, you want to make sure the comments are positive.
View this post on Instagram
How to Engage Collaborators
It’s important to remember that this is going to be a professional relationship.
Stevenson says there’s nothing wrong with sliding into a potential marketing partner’s DMs. However, it’s wise to share your business email address when reaching out. This way, the conversation moves to a more professional platform, and important messages likely won’t get lost.
Once the conversation has turned to the business at hand, both sides need to be crystal clear regarding expectations. How many posts are expected? When will the influencer post them? What’s the budget? What will working on site look like?
Be as detailed as possible to avoid confusion, frustration, and disappointment; both sides will benefit when every expectation is understood.
There’s another key to these collaborations that Stevenson wants operators to understand. Social media influencers aren’t salespeople, they’re marketers. This is a marketing exercise; you’re paying them to communicate and help people discover your business.
Going deeper, there’s another difference. There are influencers, and there are content creators. An influencer is paid to influence, and a content creator is paid to create content for others.
Another way to look at it: Influencers are in front of the camera, content creators are behind the camera. The distinction is very important.
In their partnership, Migliarini is in front of the camera, operating Beautiful Booze. Stevenson is behind the camera, running Little Lane Media. Both partner with restaurants, bars, hotels, resorts, and brands. However, they do so in different ways.
Now that you know what to consider, go forth and find your local influencers.
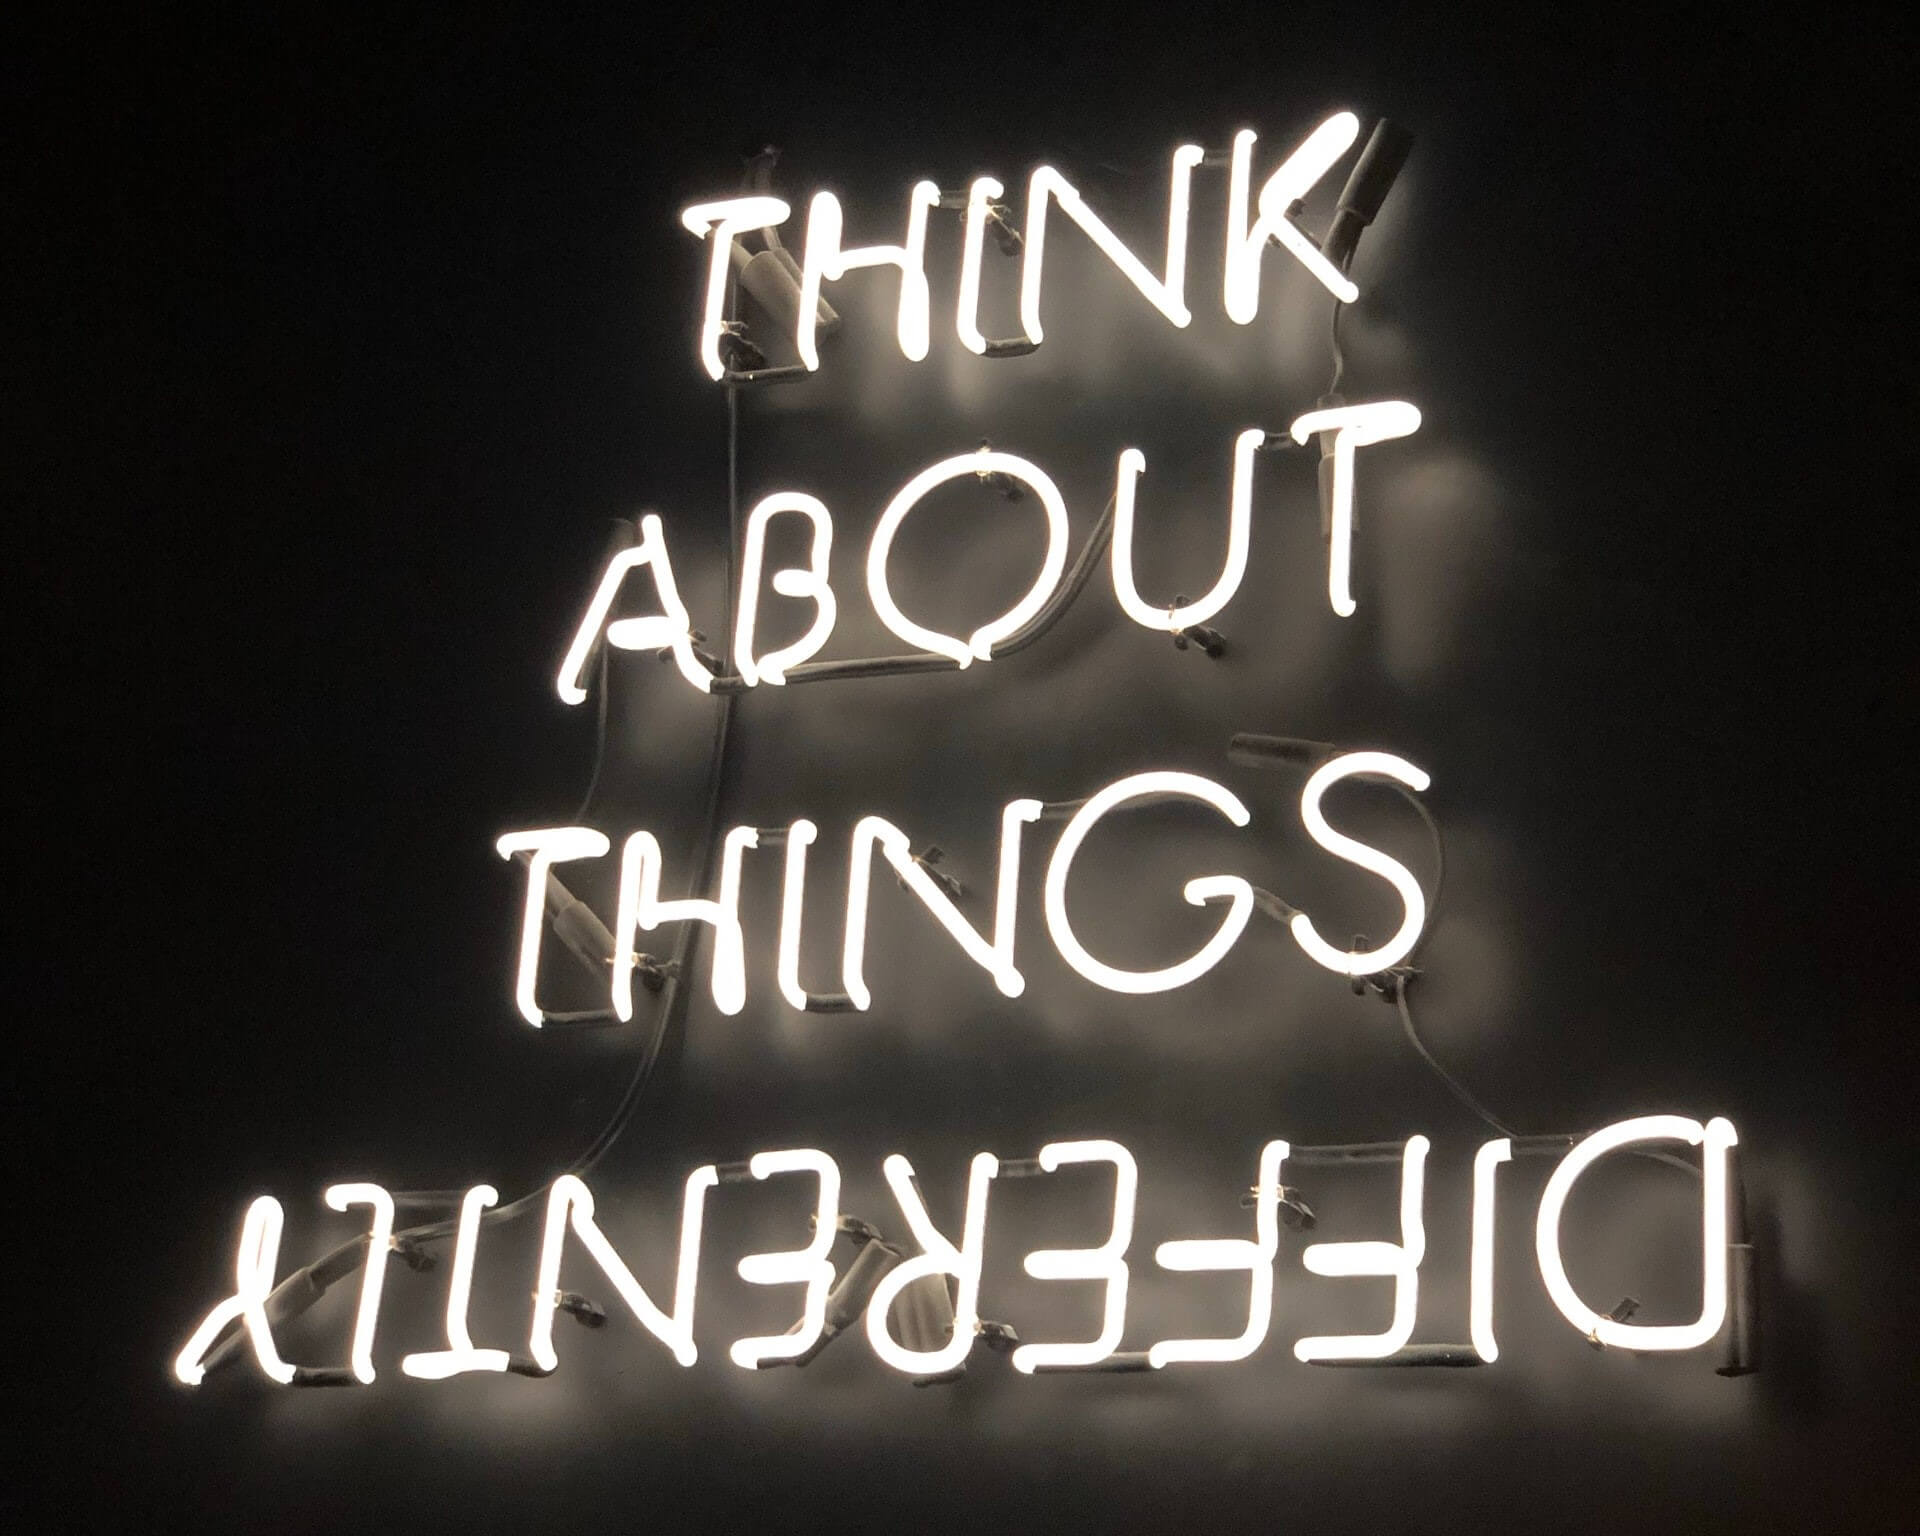
Image: Max Bender on Unsplash