Notice: Function _load_textdomain_just_in_time was called incorrectly. Translation loading for the smart-post-show-pro domain was triggered too early. This is usually an indicator for some code in the plugin or theme running too early. Translations should be loaded at the init action or later. Please see Debugging in WordPress for more information. (This message was added in version 6.7.0.) in /var/www/wp-includes/functions.php on line 6114
Study | KRG Hospitality

Study

by David Klemt David Klemt No Comments

Watch These Drink Trends in 2025

Watch These Drink Trends in 2025

by David Klemt

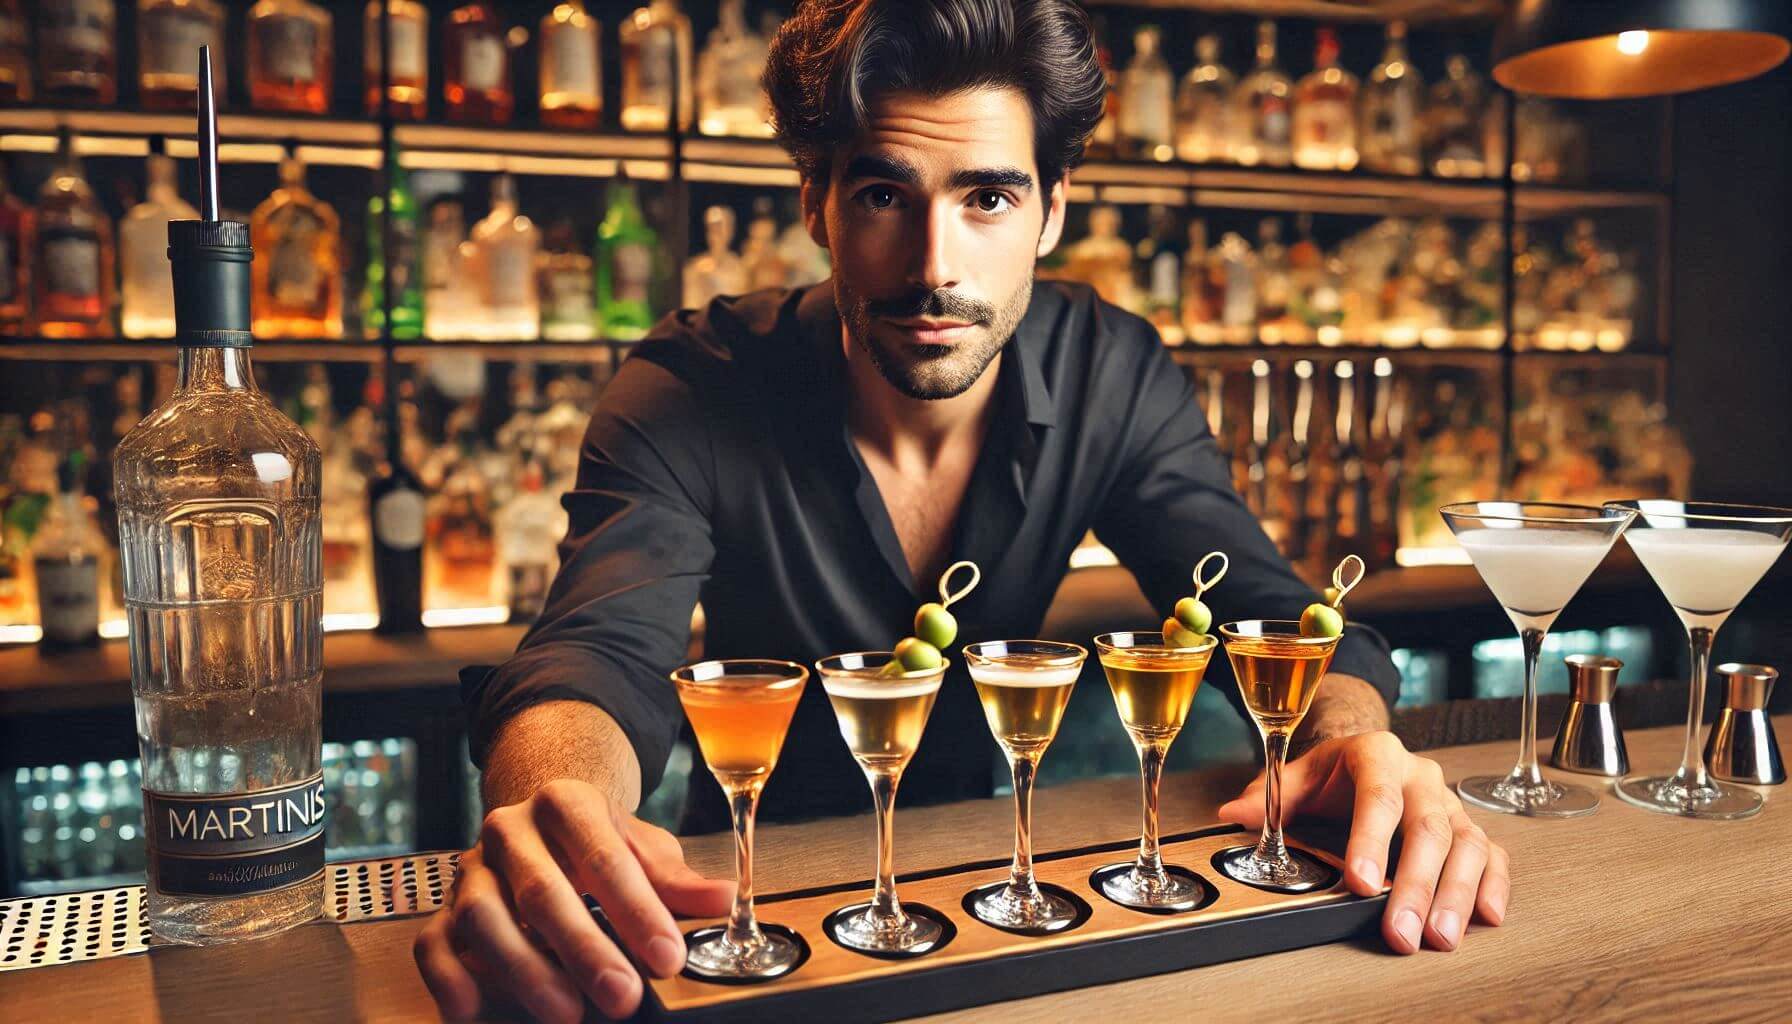
AI-generated image of a bartender serving miniature Martinis

Bottle of Martinis, anyone? In case you were uncertain, this image is AI-generated.

We’re nearing the end of 2024, and that means F&B intelligence platforms are releasing their year-end reports and predictions.

Among these platforms is Datassential. Recently, they released their Future of Drink preview report. You can sign up for your own copy here.

I’ve sifted through Datassential’s latest reports and trend-focused articles, and I’ve pulled a handful I think are among those that may perform the strongest in 2025.

Cheers!

Posh Jello Shots

Or as Datassential calls them in their report summary, “highbrow” jello shots.

This is the 2025 trend prediction that stands out the most to me. Your bar team will know how to produce jello shots (or learn how to make them reliably and consistently), but it’s not a difficult skill to develop.

Jello shots, or gelatin shots if you want to be pedantic, are most often associated with house parties and dive bars. However, gelatin is an interesting cocktail canvas, offering at the very least a different way to experience drinks texturally.

The simplest way to embrace this trend would be to use upmarket alcohol to craft these shots. Premium or super premium vodkas, for example. Another way would be to convert your signature cocktail(s) into jello form. And yet another approach would be layered jello shots, with each layer crafted using premium or super-premium ingredients.

An Alternative

Of course, operators don’t need to produce specialty, higher-end shots in gelatin form. With a bit of thought and experimentation, bar teams can produce shots that are essentially miniature versions of cocktails. Further, these can be offered as flights.

So, do you have a few specialty cocktails on your menu? Offer them as a flight of shots. Want to craft themed flights, such as a Negroni and two variants (Boulevardier and Sbagliato, for example)? That idea may just take off with your guests in 2025.

Creating shootable versions of more sophisticated cocktails elevates your program. Further, doing so can help introduce guests to a range of cocktails during a single visit in what can be a more responsible manner.

Think so-called “Mar-tinies” for inspiration: miniature Martinis served in miniature Martini glasses.

Heirloom Grains

It’s likely that you’re going to see “heirloom” or “heritage” a lot more in 2025 in relation to beer.

As both terms imply, brewers who produce these types of beer use grains they can trace back decades. Often times, heirloom grains are significant historically.

For example, Hanabi Lager Co. produces Haná Pilsner. Per the brewer, Haná is an heirloom grain that was used to produce the first-ever pilsner. In case you’re a beverage history buff or like sharing stories with guests who are interested, the first pilsner was brewed in 1842 by Josef Groll in the city of Pilsen.

Hanabi Lager Co. credits British farmers with “rescuing” Haná, pulling it back from the brink of extinction in 2015. Click here to check out other Hanabi beers made with heirloom barley and other heritage grains.

Operators who are interested in leveraging beers with notable ingredients should look for the words “heirloom,” “heritage,” and “ancient grain.” Further, they should ensure they know these beers would be of interest to their guests, and serve their concept in an authentic manner.

More Beer Trends

Other beer-centric trend predictions include global beers, hazy IPA, beer cocktails, and beer with a hint of lime.

I’m confident you don’t need an explanation of each of these 2025 trend predictions. However, it’s smart to approach each with careful consideration before adding them to your menu.

To provide an example, consider flights that focus on each trend: three to four hazy IPAs, half-sized beer cocktails, or specialty global beers.

Focusing on beer cocktails, or beertails or hoptails as I’ve seen over the years, I’m somewhat skeptical how they’ll rise in popularity. In my experience, they’ve never quite “hit” throughout the years. But, maybe 2025 is the year.

As far as beers with a hint of lime, consider creating snack pairings that pair well with such beers. Snacking as a trend is expected to rise in 2025, so it’s wise to engage your kitchen team to come up with a snack menu for your bar.

Cocktails on Tap

While I don’t recommend cocktails on tap of keg cocktails for every concept, I have certainly crafted beverage programs that leverage this trend.

And, in fact, I don’t consider these drinks to be a trend at all. In my opinion, cocktails on tap may not be ubiquitous, but they’re certainly no fad.

Why do I like cocktails on tap? For several reasons.

One of those is the speed of service, which benefits the team and the guest. While labor is necessary prior to service to prepare these drinks, kegged cocktails make up for all that effort. When the right cocktails are selected for the taps, they make it easy on the bar team to serve, and make it into the hands of guests in mere moments.

Another reason is the “novelty” of cocktails on tap. These drinks aren’t new yet many guests find the idea interesting, which piques their curiosity. Engaging guests is always good for business.

Now, think about bars and restaurants that include self-pour walls as a core feature of the concept. Guests have shown they’re interested in pouring their own beers and wines from pour walls. There are myriad reasons, including trying before they commit to something new to them. This applies to cocktails as well, and kegged cocktails are perfect for self-pour concepts.

Finally, they work for just about every category of bar, from casual neighborhood watering hole to upscale cocktail bar. When an operator focuses on glassware, garnish, and presentation, a cocktail on tap can appeal to even the most discerning cocktailian.

Image: Microsoft Designer

KRG Hospitality Contact Request for Proposal 30 Minute Discovery Session

Book Below to Setup a 30-Minute Complimentary Discovery Call and Request for Proposal.


by David Klemt David Klemt No Comments

Eliminate Hesitation: Streamline Your Menu

Eliminate Hesitation: Streamline Your Menu

by David Klemt

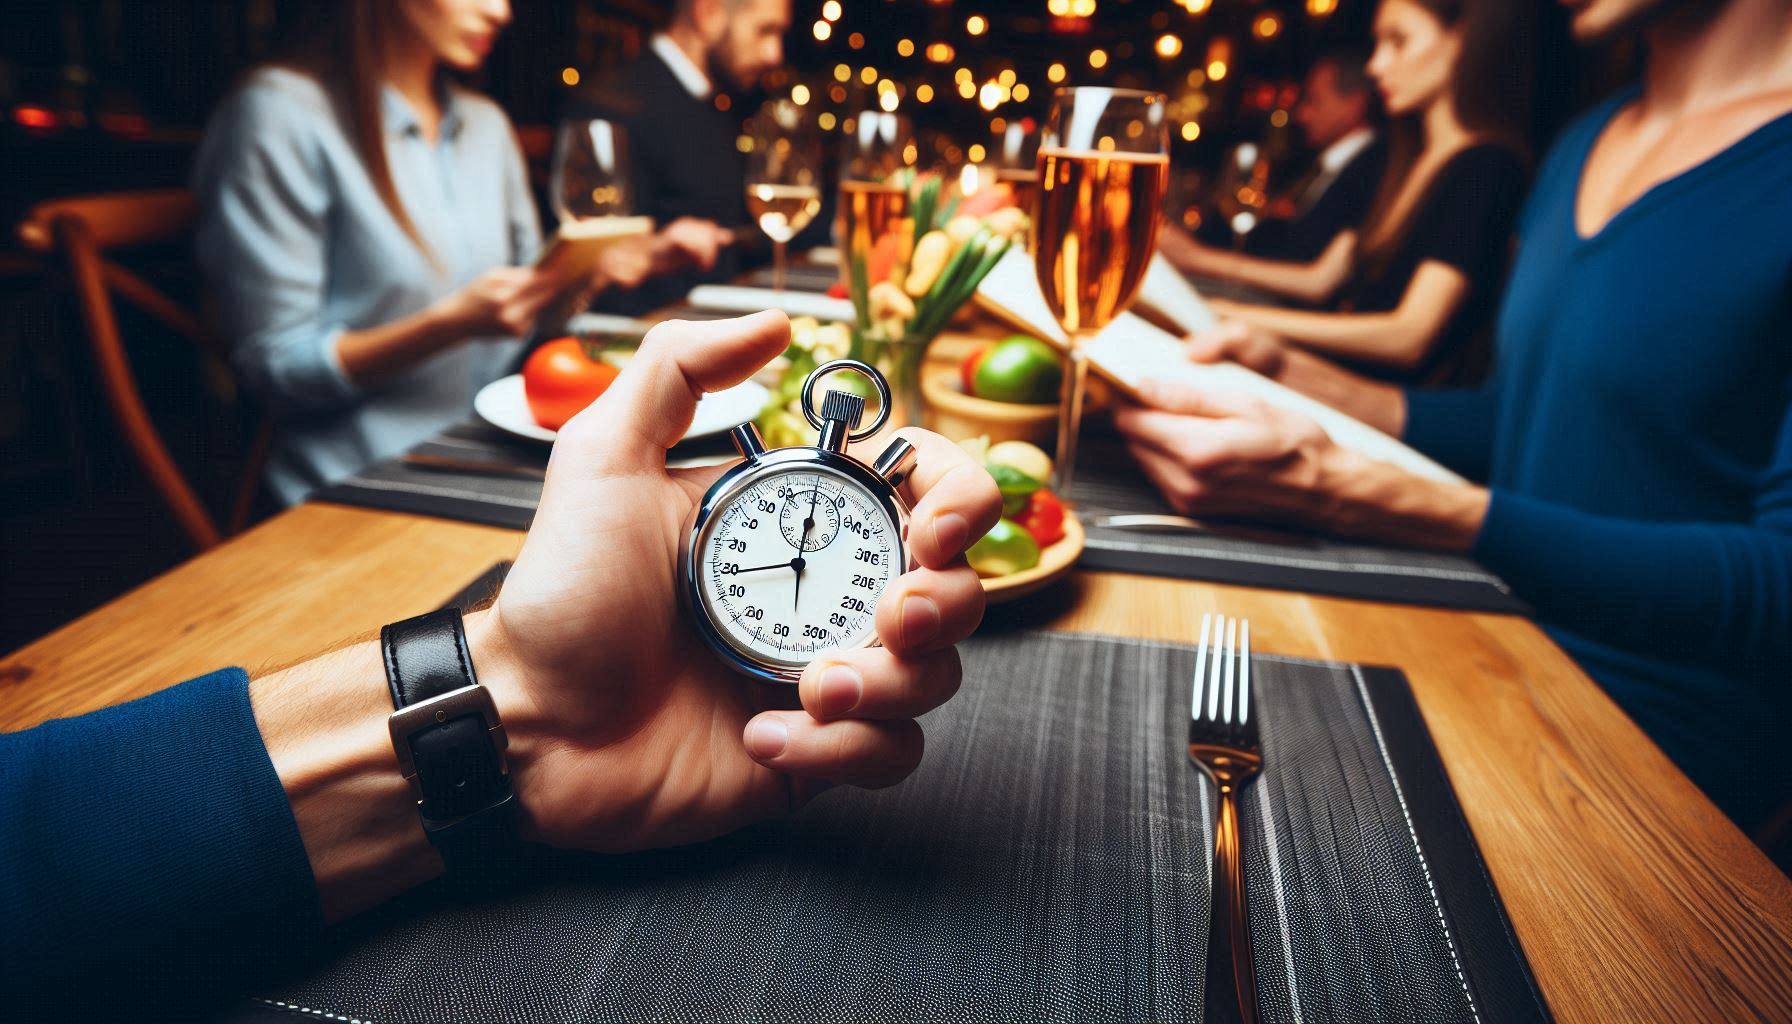
An AI-generated image of a person holding a stopwatch at a restaurant table while guests read the menu

That’s an interesting stopwatch layout. Also, we don’t recommend sitting with guests and timing them as they review your menu.

Operators should develop an understanding of the concept of the paradox of choice to understand how American guests make menu item selections.

So, allow me a crash course in this psychological concept. There are two prevailing components to the paradox of choice. One is that the more options one has, the less satisfaction they’ll feel upon making a choice. The other is that when presented with an overwhelming number of choices, also known as “choice overload,” people often just fall back to their usual choice rather than trying something new.

A quick note: The paradox of choice isn’t the same as the fallacy of choice. That concept relates to presenting someone with limited, extreme choices to drive them to ignore all of the other choices they could consider and select.

Understanding the paradox of choice will help an operator tackle a key task: streamlining their menus.

A survey from US Foods earlier this year contains quite a few intriguing revelations. Among their findings, one stands head and shoulders above the rest, at least to me: Almost 80 percent of Americans find deciding what they want to order at a restaurant difficult. Further, one factor outpaces all others when it comes to difficulty choosing.

Hence, my explanation of the paradox of choice at the top of this article.

Menus are too Big

There are two key factors making it difficult for Americans to choose what to order at a restaurant. Nearly a quarter of respondents23 percentindicate that they’re simply picky people. Alright, fair enough.

But the main factor, unsurprisingly, is that restaurants are presenting guests with too many options. That’s according to 54 percent of survey respondents. Quick math tells me that’s more than double the picky eaters.

Another 15 percent of US Foods survey respondents, however, say they have no trouble deciding what they want to order. Eight percent say they’re indifferent, which is an entirely different problem. A guest who’s indifferent to the restaurant and menu isn’t an engaged guest, and that’s not going to inspire loyalty and repeat visits.

Of course, no operator can please everyone, and some people aren’t going to be blown away no matter how good the food, drinks, and service can be.

So, does this mean that Americans are indecisive, facing paralysis whenever a servers asks for their order? Well…maybe. We have a lot going on, and “overwhelmed” would describe many of my fellow Americans right now.

However, the real culprit is menu size. In trying to please and retain guests, some operators are loathe to shrink their menus.

Most KRG clients can attest to the following: the president of our agency, Doug Radkey, prefers a smaller, streamlined menu. In fact, he prefers menus not pass the 25-item mark. Given his druthers, Radkey favors 12 to 15 items.

There are several reasons for this preference. Chief among these are controlling and reducing labor and food costs. (Radkey prefers to control costs rather than cut them, realistically.) Other reasons are less strain on the back of house, easier cross-utilization of ingredients, consistency, and reduced ticket times.

We can also add improving guest satisfaction to the list. On average, an American restaurant guest takes nine minutes to decide what they want to order at a restaurant. Streamline and shrink the menu, and this number should fall, while satisfaction rises.

Anyone should see that a smaller, sharper menu represents wins across the board.

AI image generator: Microsoft Designer

KRG Hospitality Start-Up Restaurant Bar Hotel Consulting Consultant Solutions Plans Services

by David Klemt David Klemt No Comments

SevenRooms Drops Extensive 2024 Report

SevenRooms Drops Extensive 2024 Report

by David Klemt
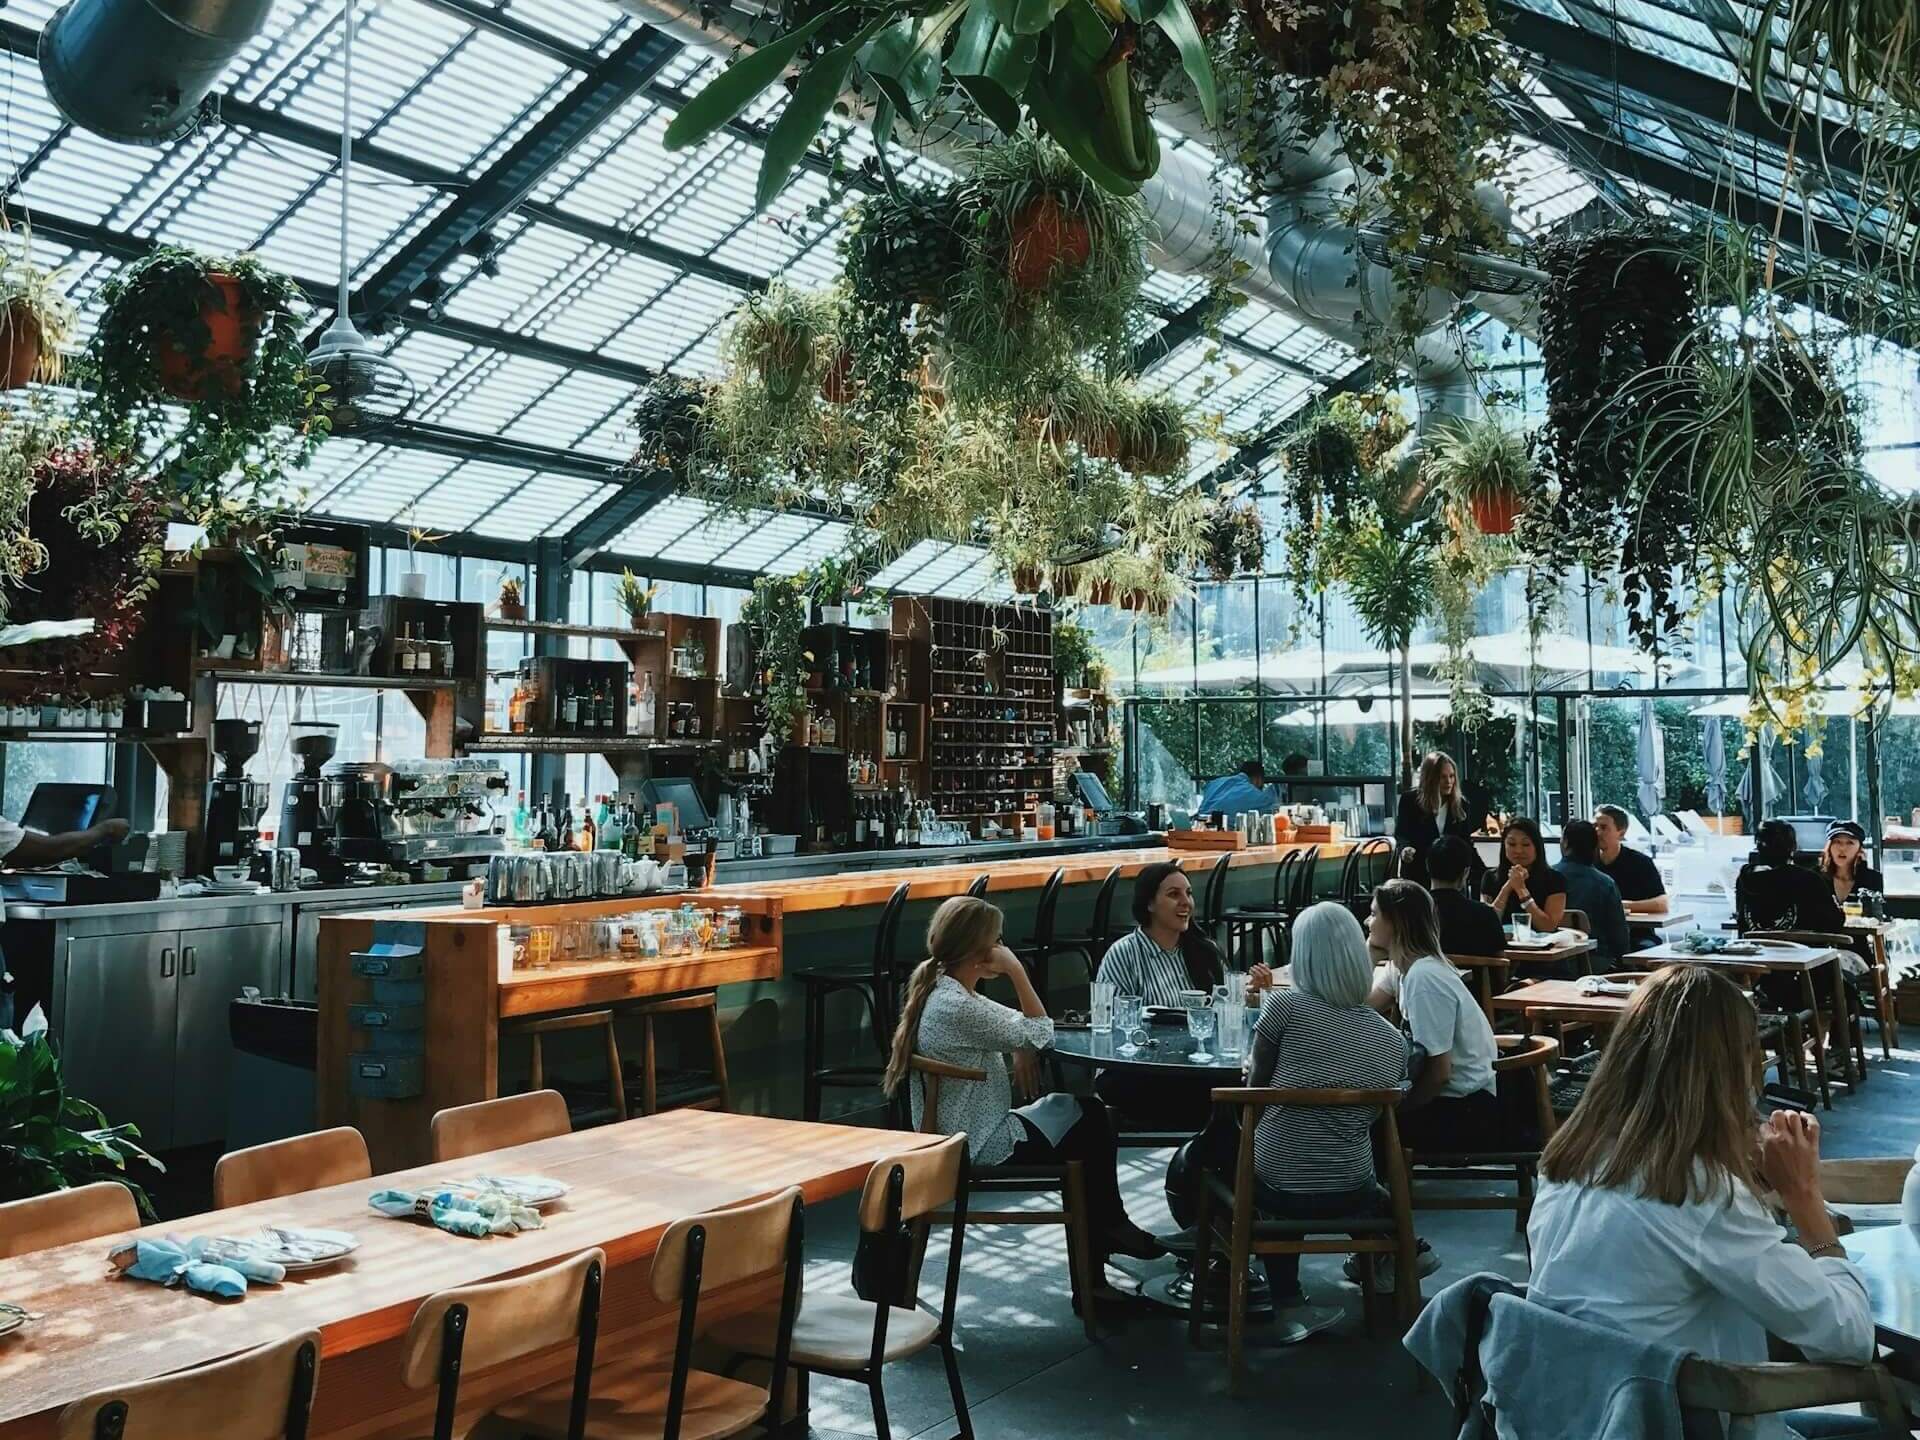
Guests dining in a light, bright restaurant featuring a glass ceiling and hanging plants

Today, we’re taking a look at the first-annual trends report from marketing and operations platform SevenRooms, which focuses on the guest experience.

To gain an understanding of the current state of affairs in America, SevenRooms analyzed the product data of more than 3,000 US clients. Further, the platform engaged over 250 operators, and 1,000 consumers.

The result is a data-rich report that offers helpful insights for operators.

Two findings are particularly interesting to me, and the team here at KRG Hospitality. One, it appears that Americans are back to seeking out their third spots. As a refresher, a third spot, space, or place is where one spends time when away from home or work. Consumers tend to be loyal to these places, making them part of their everyday or weekend routine.

Two, younger consumers are leading the way in terms of restaurant visits. Per SevenRooms, 38 percent of Millennials visit restaurants five or more times per month. Gen Z is also visiting restaurants frequently, with 24 percent visiting five times or more. However, that number climbs to 45 percent for Gen Z when it comes to three or four monthly visits. Among Millennials, 33 percent visit restaurants three or four times per month.

That tells us that younger consumers are eager to socialize, and restaurants can fulfill that desire. As savvy operators know, a person can eat or drink at home; food and beverages are just excuses to get out, hang out, and meet new people.

This also tells us that operators need to ensure they’re ticking several boxes to resonate with younger guests: value, convenience, and personalization. I’ll add that consumers have shown they want to support brands with values that align with their own.

There are many more insights in SevenRooms’ new report, which you can find below. To view the report in its entirety, click here.

SEVENROOMS RELEASES 2024 RESTAURANT TRENDS AND DINER EXPECTATIONS REPORT FOR THE HOSPITALITY INDUSTRY

Annual report gives an inside look at how restaurants are delivering better guest experiences and personalizing their marketing in the age of AI and automation

NEW YORK (August 6, 2024) – SevenRooms, the leading CRM, marketing and operations platform for growing restaurants, today released its first annual trends report, “2024 Restaurant Trends and Diner Expectations, highlighting how restaurants are filling the need for ‘third places’, connection spots outside the home and workplace, what consumers expect from their dining experiences, and how restaurants are leveraging AI and automation to keep diners coming back.

The study, commissioned through independent third-party research firm Censuswide, examines consumer and foodservice operator insights, alongside data from SevenRooms restaurant customers. It emphasizes the importance of restaurants understanding their guests and providing experiences and value to consumers, including marketing and tech trends that operators are paying attention to.

Diners Expect More From Restaurants

While it’s no surprise that diner expectations have evolved in recent years, consumers across generations and cities share key expectations when dining out — they’re looking for convenience, personalization and value from brands they trust. Restaurants must nail all aspects of the guest experience, from hospitality and service to ambiance and atmosphere, to transform diners into brand ambassadors and get them to bring their dollars back more often.

When looking across generations, Millennials are driving a dining resurgence – dining out most frequently with 38% saying they dine out more than 5x a month. They are seeking more from their restaurant visits, and are willing to spend more for elevated experiences, like theatrical elements or high-end items like caviar. For these experiences, Americans are willing to spend up to $63 per person with 45% of Gen Zers open to paying even more. As diners focus on the quality over quantity of their experiences, that means restaurants must do more to keep those diner dollars. Dining upgrades consumers are willing to spend more fall into three categories – experiential, luxurious and personal, including:

  • Experiential (e.g. tableside martini cart; fish presentation or deboning, etc.)
    Dallas – a menu item with some theater (86%)
    Washington DC – a menu item with some theater (71%)
  • Personal (e.g. birthday dessert; welcome drink)
    Chicago – a mocktail or personalized item (55%)
  • Luxurious (e.g. caviar, freshly shaved truffles, seafood tower)
    Los Angeles – high-end items like caviar (55%)
    New York – high-end items like caviar (48%)

Outside of these experiential offerings, restaurants must also capitalize on influential factors that bring diners back. For example, 34% of Gen Zers want personalized surprises in service like a free dessert. Meanwhile, 26% of Millennials care about the ease of making a reservation and 24% of Gen Xers consider the rapport they develop with front-of-house staff. Tailoring guest experience and service helps operators turn one-time diners into loyal customers.

“New consumer demands are pushing restaurants to find the right balance between hospitality and automation to create the experiences guests crave and return for,” said Joel Montaniel, CEO & Co-Founder at SevenRooms. “Diners want both access and recognition when spending their hard-earned dollars, and restaurants must embrace new strategies – and technologies like AI and automation – to enhance hospitality at every touch point. Whether leveraging platform data to personalize diner experiences or power marketing and retention programs, technology and data serve as a vehicle to execute hospitality that guests remember and return for. When technology is used effectively, it allows operators to focus on building deeper connections and delighting guests, one experience at a time.”

Loyalty is Never One-Size-Fits-All

In the U.S., there was a 21% year-over-year increase in reservations comparing Q1 2023 to Q1 2024 and restaurants are looking to a promising future. Whether operators are focused on opening new locations or revamping their social media marketing efforts, one factor remains the same – establishing personal relationships with diners is the strongest way to build and maintain loyal customers.

Consumers have a strong intent to dine with their favorite brands. If a guest can’t get a reservation at their preferred restaurant, 39% of guests look for a sister restaurant to dine at, and 27% check other sites for the same restaurant.

Cultivating loyalty is critical. Loyalty is not a one-size-fits-all effort and diners have different interests when it comes to the benefits they seek out from loyalty programs. Restaurants need to understand their diner demographics to curate operations and offerings, getting their guests to not only return more often but spend more in the process.

38% of diners who would spend $89-$126 on an average night are looking for exclusive VIP events, while 33% of consumers who dine out 7-8 times per month want VIP access to specialty seating areas. Breaking down generational differences:

  • 72% of Gen Zers care most about free menu items
  • 30% of Millennials care most about VIP access to specialty dining areas
  • 1 in 5 Gen Xers and Baby Boomers want early access to reservations

Genuine, Tailored Marketing is Critical to Success

When it comes to marketing, authenticity and personalization reign supreme for consumers. Guests want to be known by their favorite restaurants, and restaurants want to know and understand their guests. To reach these consumers, and serve up personalized marketing that makes guests want to return, restaurants have to use all the tools in their arsenal – from social media to email and text marketing automation – to create high-touch communications that are both authentic and personal.

79% of restaurant operators spend the majority of their marketing budget on social media. Their top social media goals are to drive bookings or online orders (39%), increase brand awareness (29%) and communicate with their audiences (29%). But not all content is created equal – 39% of operators say that organic posts drive the most bookings to their restaurants. Restaurants that showcase their personality – highlighting their team, food and drinks and atmosphere – will win with consumers as they look for more genuine content from brands.

Most diners like hearing about restaurant promotions and offers via email and text, and aren’t as interested in social media DMs or phone calls, but specific preferences vary by generation. 41% of Gen Zers prefer text marketing, whereas 38% of Millennials and 37% of Gen X prefer email marketing.

With targeted Email Marketing, the data report notes that operators see 23% higher open rates and 28% higher click-to-open rates, generating 2x more revenue per email. Text marketing is fairly new for restaurants, but has huge potential, with an average open rate of 98% and $1.64 average reservation revenue generated per text message on SevenRooms. For one SevenRooms customer, Fabio Viviani Hospitality, it drove $220,000 in revenue and 3,000 new guests in just 4 months.

“The biggest thing that excites me about text messaging is that it’s very hard to ignore. When our phones beep, we are just driven to look at them,” said Harry Kaminski, CMO at Fabio Viviani Hospitality. “It’s easier to ignore an email than it is a text.”

Artificial Intelligence (AI) Comes into Play

Every industry today is using AI and automation in some way to streamline their operations and help staff work more efficiently – and the same is true for the restaurant industry. 70% of operators surveyed said they use artificial intelligence in some way to run their business, including:

  • 35% – Processing reservations
  • 34% – Inventory management
  • 33% – Data analytics
  • 27% – Scheduling
  • 26% – Dynamic pricing

But there is room to grow with AI, with only 16% saying they use it to create marketing collateral and 15% for staff hiring and training. With personalized marketing a large focus for operators in 2024 and beyond, as well as hiring and retaining staff to deliver on high-touch hospitality, operators have an opportunity to use AI more effectively.

“AI elevates our storytelling around data,” said Kelly MacPherson, Chief Supply Chain and Technology Officer at Union Square Hospitality Group. “We have a wealth of data at our fingertips, but this can create analysis paralysis. With AI, we can more efficiently synthesize the data, create stories about what’s happening, why it’s happening, and what we can do about it, and then present these stories to our teams in a digestible format with actionable next steps.”

For more information about SevenRooms and to download the full report, please visit here.

About SevenRooms

SevenRooms is a CRM, marketing and operations platform for growing restaurants in the hospitality industry. From Michelin star gems to local favorites, the all-in-one platform helps restaurants increase sales, delight guests, and keep them coming back, automatically. The full suite of products includes reservations, waitlist and table management, review aggregation, referrals, email marketing, and marketing automation. Founded in 2011 and venture-backed by Amazon, Comcast Ventures and PSG, SevenRooms has more than 10,000 dining, hotel F&B, nightlife and entertainment clients globally, including: Marriott International, MGM Resorts International, Mandarin Oriental Hotel Group, Wynn Resorts, Jumeirah Group, Hard Rock Hotels & Resorts, Wolfgang Puck, Michael Mina, Bloomin’ Brands, Union Square Hospitality Group, Australian Venue Co., Maple & Ash, The Wolseley Hospitality Group, Dishoom, Groot Hospitality, MLSE, Live Nation and Topgolf.

Research Methodology

SevenRooms partnered with Censuswide Research – a third-party, professional research and consulting organization. Total sample size was 1,004 U.S. consumers. Fieldwork was undertaken between March 4-11, 2024. The survey was carried out online. The figures have been weighted and are representative of all U.S. adults (aged 16+).

SevenRooms partnered with Censuswide Research – a third-party, professional research and consulting organization. Total sample size was 251 U.S. operators (hospitality decision-makers). Fieldwork was undertaken between March 4-19, 2024. The survey was carried out online. The figures have been weighted and are representative of U.S. hospitality operators.

SevenRooms provided anonymized internal data representative of U.S.-based restaurants using the SevenRooms platform and surveyed a sample of operators at various restaurant sizes and types across the U.S. from March-May 2024.

Image: kayleigh harrington on Unsplash

KRG Hospitality Contact Request for Proposal 30 Minute Discovery Session

by David Klemt David Klemt No Comments

Campbell’s Shares Tips for LTOs

Campbell’s Shares Tips for LTOs that Generate ROI

by David Klemt

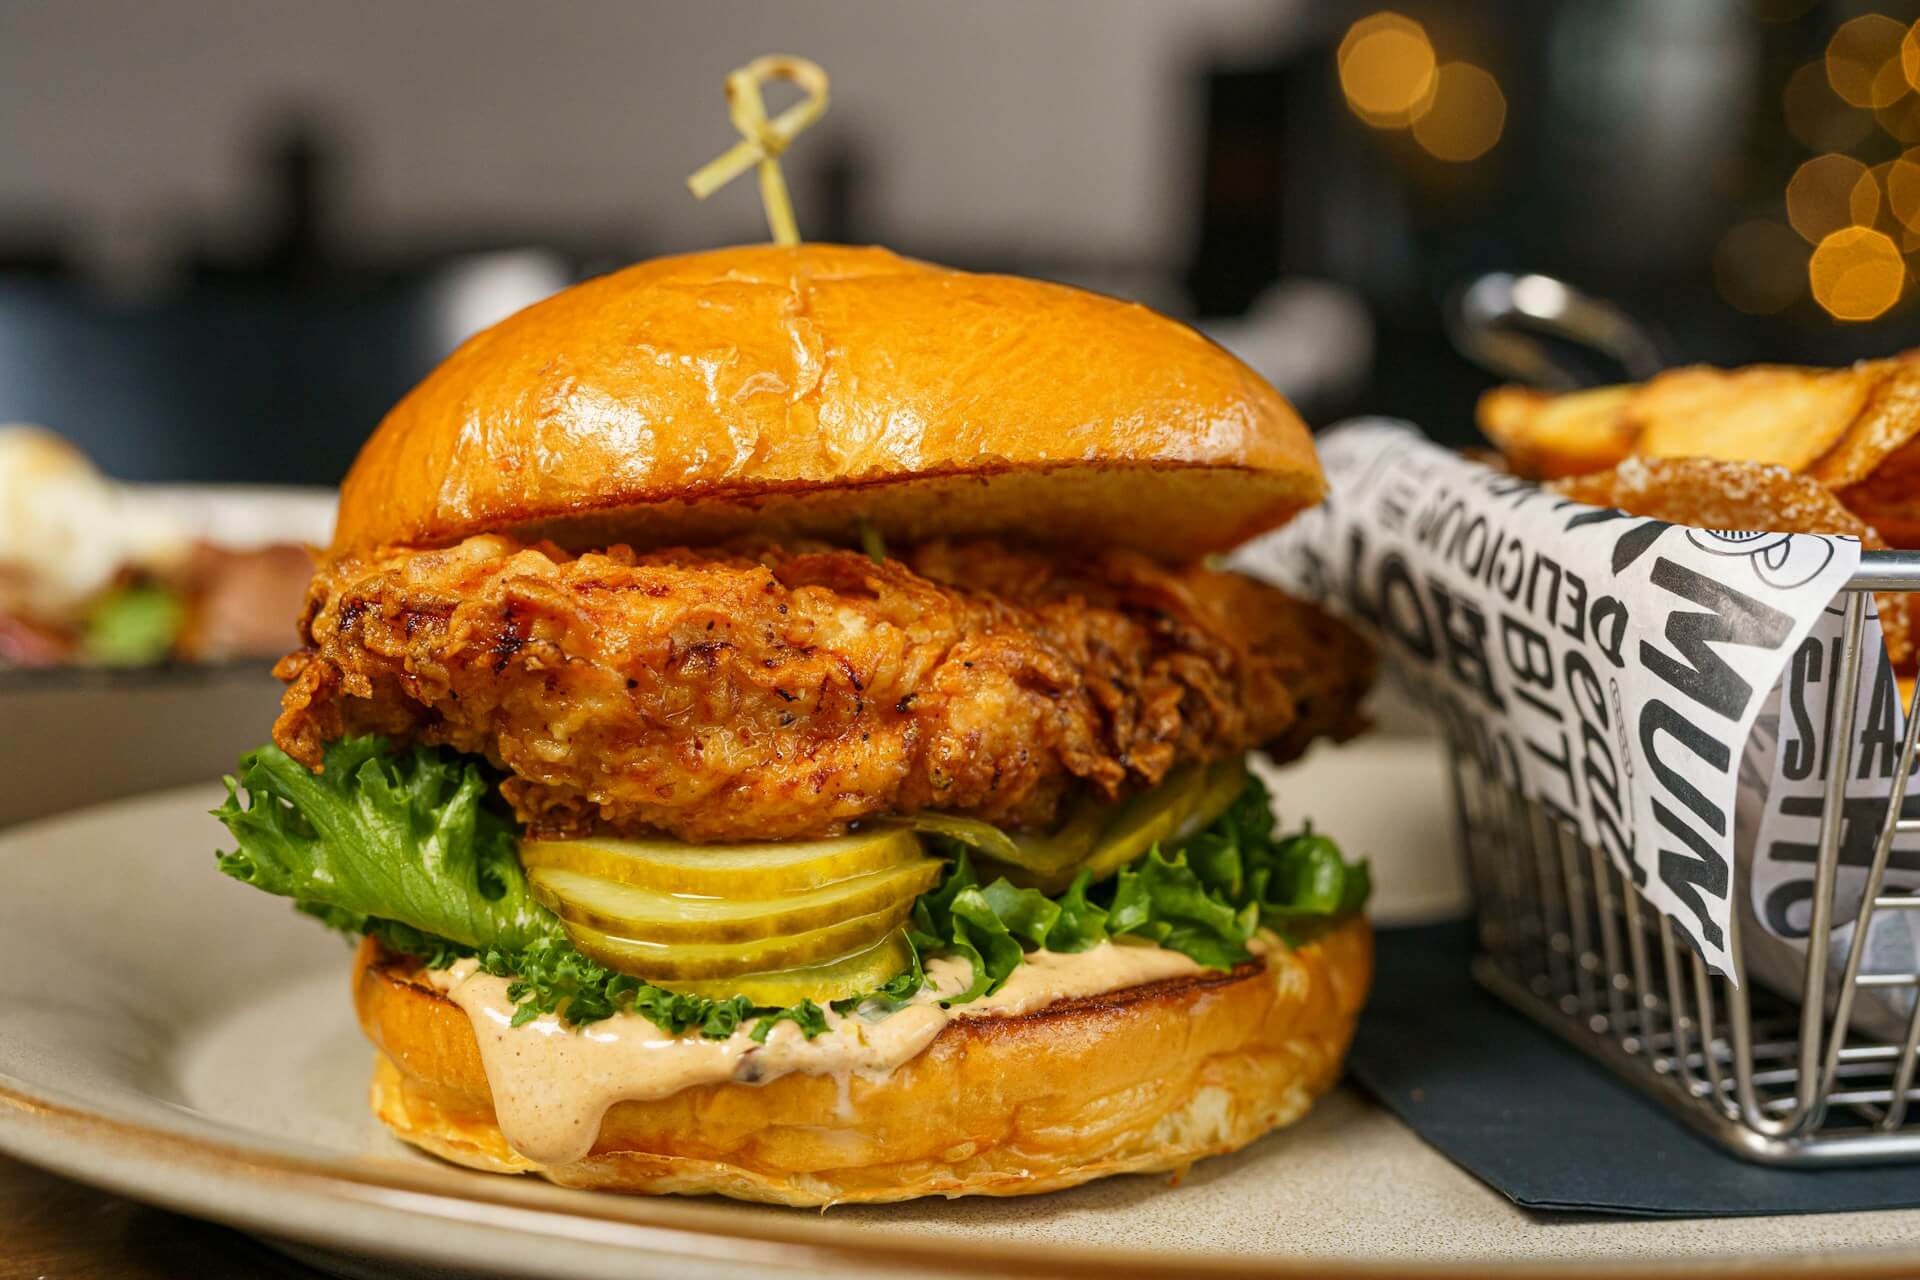
A well-crafted chicken sandwich with pickles, lettuce, and sauce, served next to a basket of French fries

Yes, the Chicken Sandwich Wars are still going strong in 2024.

We appreciate Campbell’s Foodservice’s reports and posts, and their most recent insights address how operators can succeed with LTOs.

For example, our look into their tips for leveraging nostalgia is here. And our thoughts on Campbell’s Culinary TrendPulse 2024 report are here for your review.

This time out, Campbell’s Foodservice, utilizing data from Technomic, Datassential, and other sources, is tackling LTOs.

If you’re a regular reader of KRG Hospitality’s industry insights, you know we love an LTOif an operator executes it effectively. Along those lines, you probably also know that we view Taco Bell as a leader in the industry when it comes to leveraging the power of LTOs.

Not only does the QSR giant know what their guests want, they know how to generate demand. In fact, Taco Bell understands the power not just of LTOs but of tying them to their subscriptions. Take, for example, their Taco Lover’s Pass and the Toasted Breakfast Taco menu drop.

When approached with thoughtful consideration, well-executed LTOs are a crucial element of an operator’s marketing and branding strategy. They drive traffic and sales, boost guest engagement and loyalty, and attract attention from first-time guests.

Of course, crafting a gainful LTO—gaining profits, loyalty, and positive public perception—can be easier said than done. However, there are a number of steps you can take to get the ball rolling and come up with one that reflects your brand, and resonates with guests.

Four Steps

Kicking off their tips, Campbell’s Foodservice recommends keeping LTOs simple. As they say in their report, which you can read here, operators need not “reinvent the wheel” when developing these promotions.

You can differentiate an LTO menu item from its standard counterpart in a number of simple ways. A few examples are using a unique cooking process, crafting a limited-edition sauce, and featuring a distinctive and specific topping or two.

Another tip is to do your best to offer LTOs that embrace current trends. While sharing these tips, Campbell’s cites Datassential and the revelation that just 20 percent of all LTOs are recurring. That means that the vast majority of LTOs are new creations, not stalwarts like the McRib. To draw the attention of a wider swath of guests, feature regional and local items and flavors. Per Datassential, 70 percent of guests are interested in such LTOs.

Speaking of attention, operators should learn how to take and edit attractive F&B images. Or, as Campbell’s says, “make LTOs pretty.” Per Datassential, roughly a third of consumers will try an LTO if it looks appealing in an advertisement or in-store imagery.

Finally, and this one is crucial as it embodies the previous three tips, leverage seasonality. It’s currently summer, so what can you add in the way of flavor to an existing item? Is that item regional and locally sourced? Will photographing it and crafting a sharp post communicate the season and inspire a bit of FOMO? These questions can help guide your approach to crafting profitable LTOs.

Oh, and to help you get started, I’ve shared Campbell’s season flavor suggestions below. Cheers!

Campbell’s Foodservice Seasonal Flavors

Not only did Campbell’s share tips for succeeding with LTOs, they also provided several examples of seasonal flavors to inspire you and your team.

Since it’s July, I’ll start with their summer suggestions.

Summer: basil, blackberries, corn, cucumbers, peaches, tomatoes, watermelon, zucchini

Fall: artichokes, cranberries, edamame, parsnips, pears, pumpkin, sweet peppers, tomatillos, turnips,

Winter: butternut squash, persimmons, radishes, salsify (a root vegetable), sunchokes, sweet potatoes, tangerines

Spring: asparagus, fava beans, pea greens, rhubarb, snap peas, spring onions, strawberries

Campbell’s Foodservice sources:

  1. Foodservice and Hospitality: A strong LTO strategy helps operators retain and grow their customer base (March 2024)
  2. Datassential: Limited Time Offers Keynote Report
  3. Technomic: 162 Best-in-Class LTOs for 2023
  4. Food & Drink Resources: A Limited Time Offer Strategy For Restaurants
  5. Your Guide to Seasonal Fruits and Vegetables, The Spruce Eats
  6. Datassential: State of the LTO 2024

Image: Hybrid Storytellers on Unsplash

Bar Nightclub Pub Brewery Menu Development Drinks Food

by David Klemt David Klemt No Comments

Want to Leverage Nostalgia? Spin It

Want to Leverage Nostalgia? Put Your Spin on It

by David Klemt

A recent report from Campbell’s Foodservicealong with supporting data from external sources—supports what many operators assume about food trends.

Our dive into Campbell’s Culinary TrendPulse 2024 report is here for those who want to take a look. Anyone who wants to download a copy of the report for themselves can click here.

However, I’m referencing a fresh, quick-hit report from Campbell’s. While it only takes a handful of minutes to read, it’s chock-full of useful insights.

In particular, this latest menu trend analysis looks into succeeding with nostalgia. Citing a study from Symrise in their post, 70 to 76 percent of guests ages 22 to 65 cherish nostalgic items.

Put simply, that translates to a truth most operators know: guests of all ages like comfort foods. This really doesn’t need much explanation. Comfort foods areinsert shocked Pikachu face herecomforting. And I think we’re all seeking comfort these days.

So, yes, operators shouldin an authentic mannerspeak to and fill this guest desire. Authentically in this context means putting comfort foods on the menu that make sense. Doing this successfully requires menu programming that fits with the brand and within the venue’s theme. It also necessitates really knowing your guests and what they expect.

For example, will a particular restaurant’s guests find mac and cheese comforting? Will they stop scanning the menu when they come across pozole? What about cacio e pepe or beef braciole? How receptive will they be to sukiyaki?

A sharp operator should know their guests’ tastes better than just about anyone. Therefore, they should know what foods they’ll find comforting.

However, there’s another way to succeed with nostalgia and enhance the guest experience.

“New” Nostalgia

There are a couple of ways to interpret the term “new nostalgia.”

One way is to tap into what foods, generally speaking since they’re not monoliths, different generations view as comfort foods. This can be something as simple as a certain candy or beverage from their childhood.

Another way is for an operator and their kitchen team to take a nostalgic dish and put their own spin on it. Using candy as an example again, a scratch-made interpretation of a treat to create a dessert may work.

Consider, as a real-world model for this approach, the Chocotini that Oceans Resort Casino featured toward the end of August in 2022. This was a direct response to the news that Klondike had retired the Choco Taco, a nostalgic treat for millions of people spanning multiple generations.

Of course, operators can also cross-utilize items to craft new menu items that tap into the craving for nostalgic comfort foods. These dishes can be permanent additions, seasonal menu updates, or LTOs.

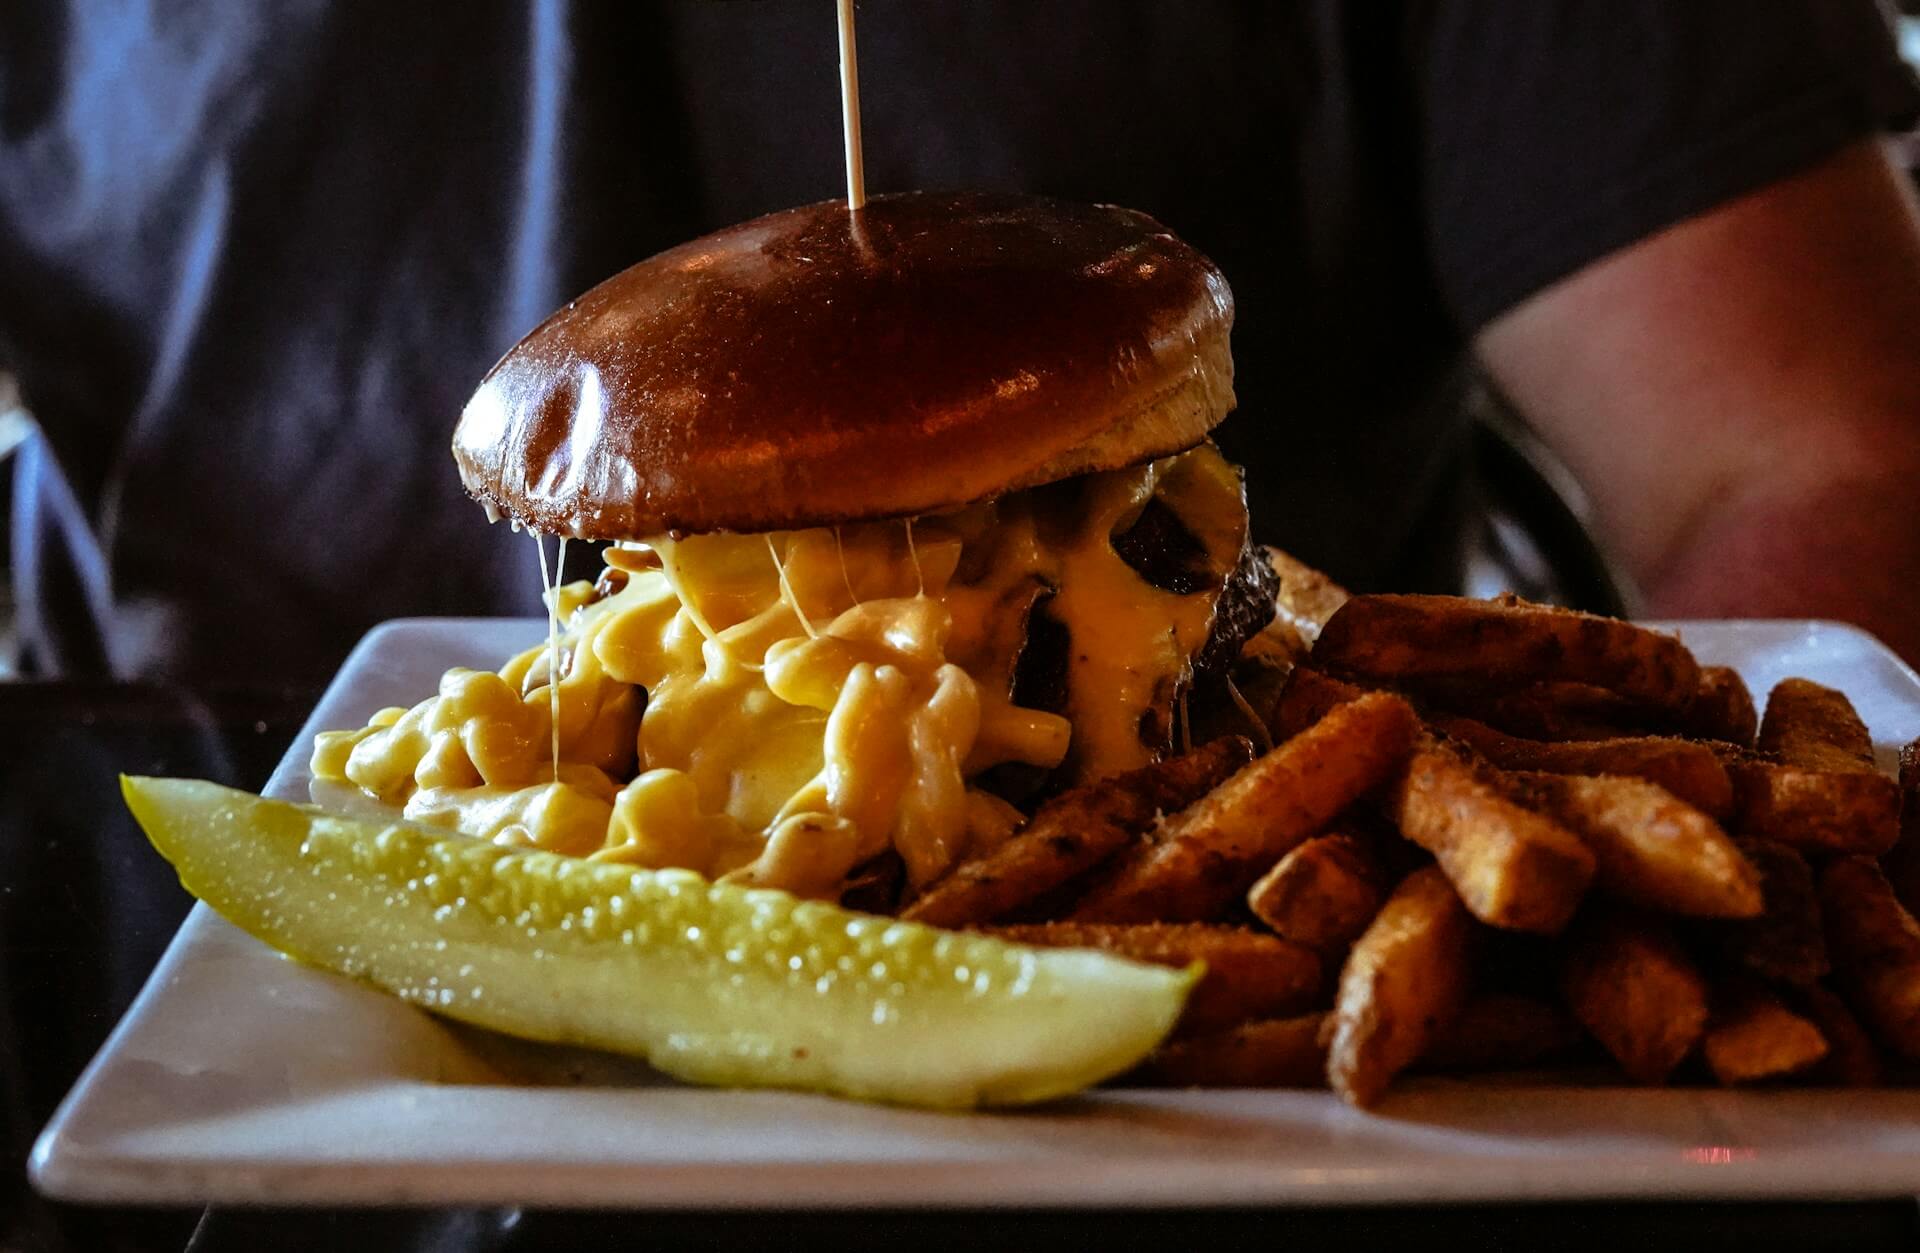
Take a look at the image atop this article. Mac and cheese is a classic comfort dish. Now, feature it as a topping for a signature burger. That’s a prime example of new nostalgia.

Going farther, kitchen teams can combine nostalgia with another trend to get even more creative: global flavors. Are there tacos on the menu? Maybe bulgogi tacos featuring beef short rib, Korean slaw, and soy-lime dressing would resonate with guests.

I’m not saying anyone should menu these specific items. Rather, my aim here is to get operators and their kitchen and bar teams to put their heads together and create undeniable, irresistible takes on classics.

The key, again, is an understanding of the market, community, and guests. From there, it’s about getting creative and crafting dishes that guests can’t get anywhere else.

Image: Alex Haney on Unsplash

KRG Hospitality menu development. Restaurant. Bar. Cafe. Lounge. Hotel. Resort. Food. Drinks.

by David Klemt David Klemt No Comments

Which Chains are America’s Favorites?

NRN & Technomic Identify America’s Favorite Chains

by David Klemt

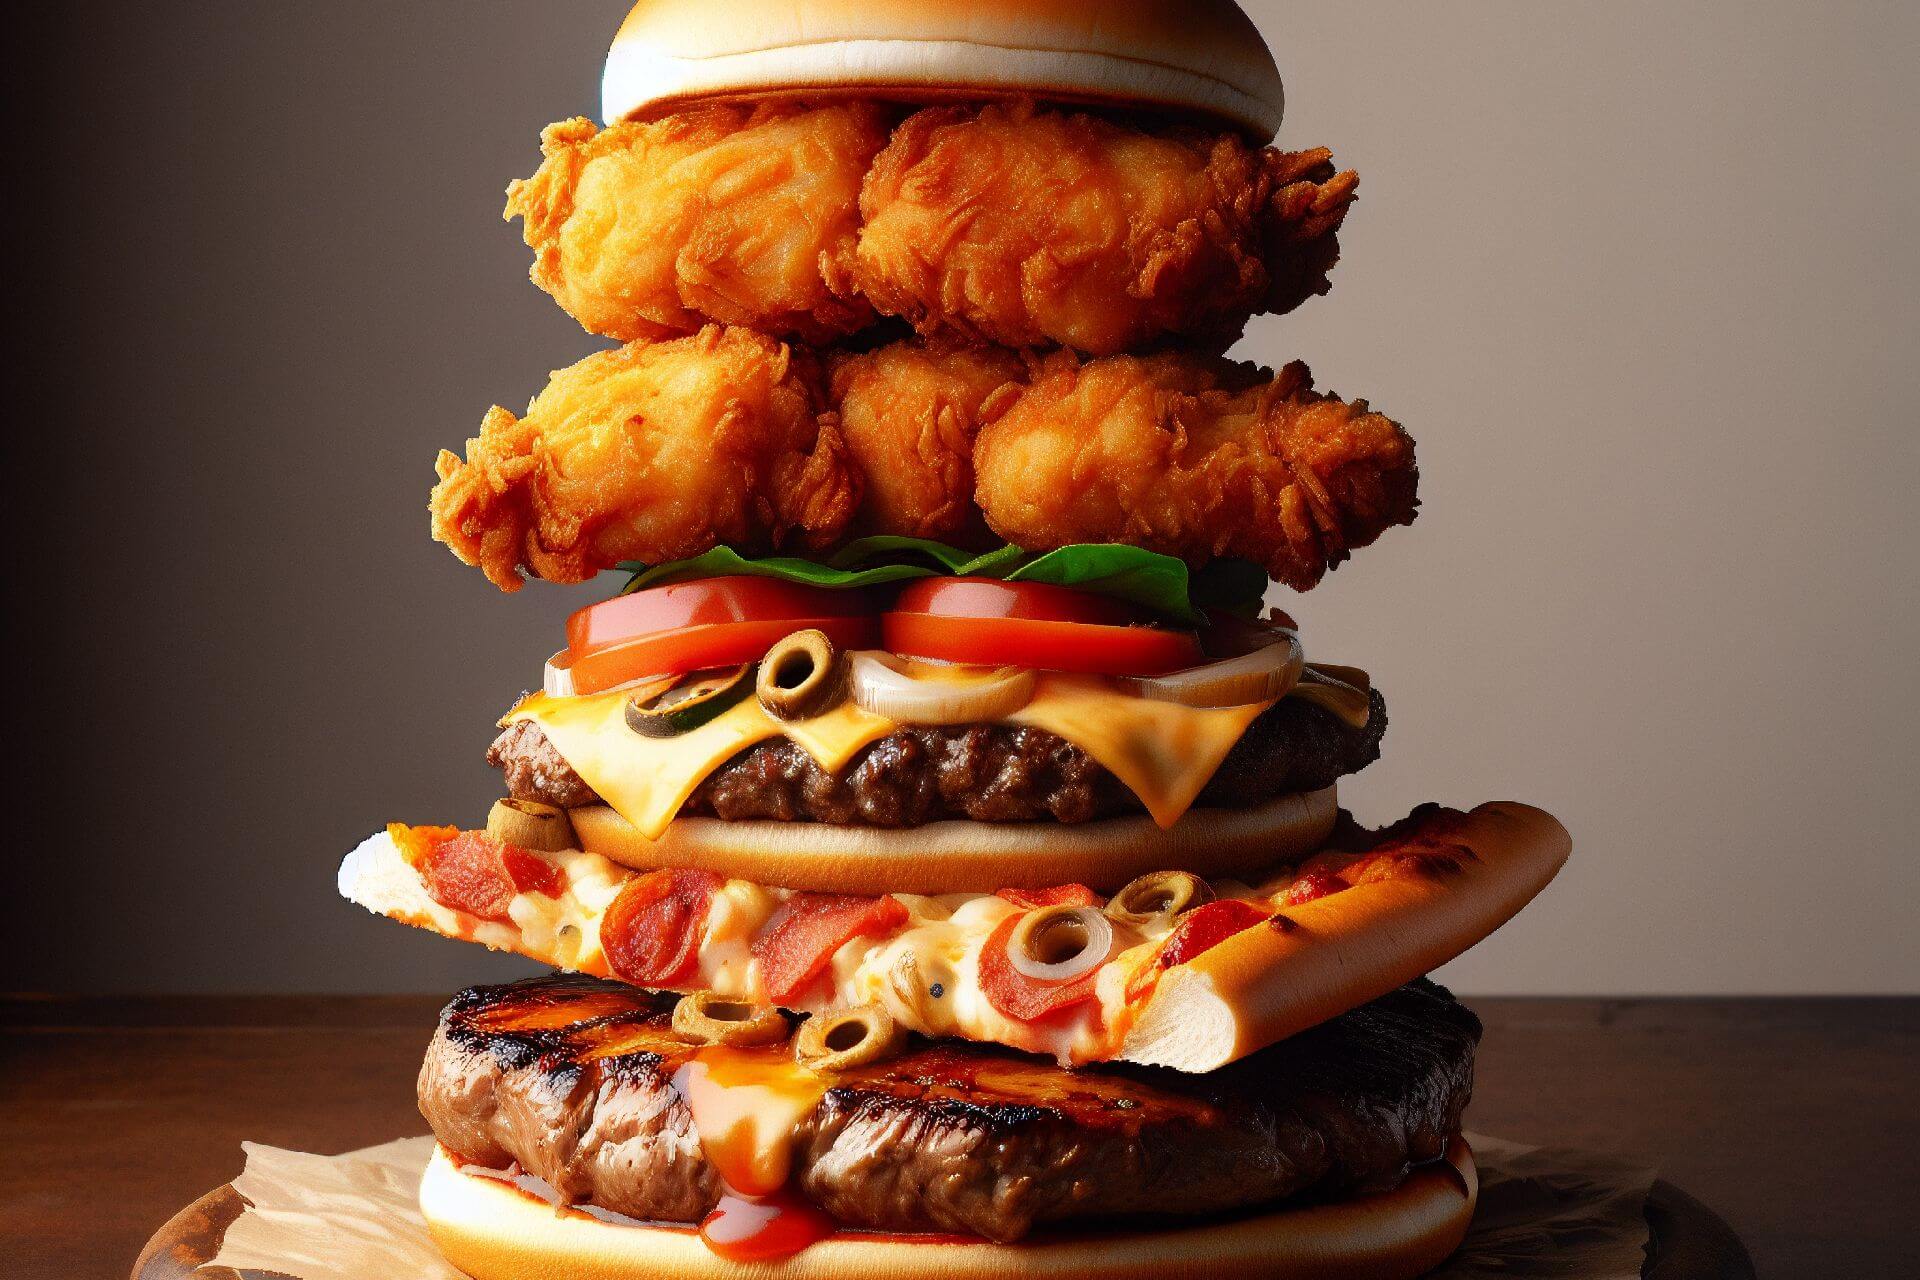
A cheeseburger with chicken patties, pizza, and steak on it

Alright, which one of you maniacs out there is going to make this AI-generated chicken-patty-pizza-steak burger a reality and put it on your menu?

Toward the beginning of 2024, Nation’s Restaurant News collaborated with Technomic to identify America’s favorite restaurant chains.

To my understanding, this is the first such partnership between the independent foodservice publication and the foodservice intelligence platform.

Providing more than just a glimpse into America’s favorite chains, the rankings span several categories. For instance, the partnership between NRN and Technomic reveals the top QSRs, along with the country’s favorite fast-casual, family-style, and miscale restaurants.

However, the top three chains across more granular categories are also identified. Examples include America’s favorite chicken, pizza, burger, and Mexican restaurants.

In fact, I’m going to kick things off with the more specific, specialized categories. Then, I’ll move into the broader segments.

That said, I encourage you to review NRN‘s article revealing America’s favorite midscale, casual, QSR, etc. restaurants for yourself. Written by Joanna Fantozzi, the piece is full of valuable insights beyond simple rankings.

Further, you may find it interesting to compare these rankings to the results of BrandVue’s Most Loved Eating Out Brands 2023 report, which we reviewed here.

Cheers to NRN and Technomic! Here’s to hoping that this becomes an annual release.

Beverage or Snack

  1. Tropical Smoothie Cafe
  2. Smoothie King
  3. Jamba

Burger

  1. Culver’s
  2. In-N-Out
  3. Freddy’s Frozen Custard & Steakburger

Chicken

  1. Chick-fil-A
  2. Jollibee
  3. Raising Cane’s

Italian (FSR)

  1. Carrabba’s Italian Grill
  2. Maggiano’s Little Italy
  3. Mellow Mushroom

Mexican

  1. Chuy’s Tex-Mex
  2. Torchy’s Tacos
  3. Moe’s Southwest Grill

Pizza

  1. Papa Murphy’s
  2. Marco’s Pizza
  3. Cici’s Pizza

Sandwich

  1. Jersey Mike’s Subs
  2. Newk’s Eatery
  3. Jason’s Deli

Steak

  1. Ruth’s Chris Steak House
  2. Fleming’s Prime Steakhouse
  3. Longhorn Steakhouse

Varied Menu

  1. Seasons 52
  2. Bahama Breeze Island Grille
  3. Cooper’s Hawk

QSR

  1. Dutch Bros Coffee
  2. Topical Smoothie Cafe
  3. Smoothie King
  4. Cold Stone Creamery
  5. Chik-fil-A

Fast Casual

  1. Jersey Mike’s Subs
  2. Newk’s Eatery
  3. Jason’s Deli
  4. McAlister’s Deli
  5. Sweetgreen

Family Style

  1. First Watch
  2. Cracker Barrel
  3. Golden Corral

Casual

  1. Seasons 52
  2. Bahama Breeze Island Grille
  3. Bonefish Grill
  4. Longhorn Steakhouse
  5. Cooper’s Hawk

Midscale

  1. First Watch
  2. Cracker Barrel
  3. Golden Corral
  4. Shoney’s
  5. Black Bear Diner

Favorite Chains: Overall

  1. Ruth’s Chris Steak House
  2. Season 52
  3. Dutch Bros Coffee
  4. Fleming’s Prime Steakhouse
  5. Bahama Breeze Island Grille
  6. Longhorn Steakhouse
  7. Cooper’s Hawk
  8. Tropical Smoothie Cafe
  9. The Capital Grille
  10. Smoothie King

When it comes to this list of the top-ten favorite chain restaurants, Technomic data scores a number of crucial insights.

Click here to see how each of these industry leaders ranked in:

  • Service and hospitality
  • Unit appearance and ambience
  • F&B
  • Convenience and takeout
  • Value

Image: Shutterstock. Disclaimer: This image was generated by an Artificial Intelligence (AI) system.

KRG Hospitality. Restaurant Business Plan. Feasibility Study. Concept. Branding. Consultant. Start-Up.

by David Klemt David Klemt No Comments

Slice Releases 2024 Report

Indie Pizzeria App Slice Releases 2024 Report

by David Klemt

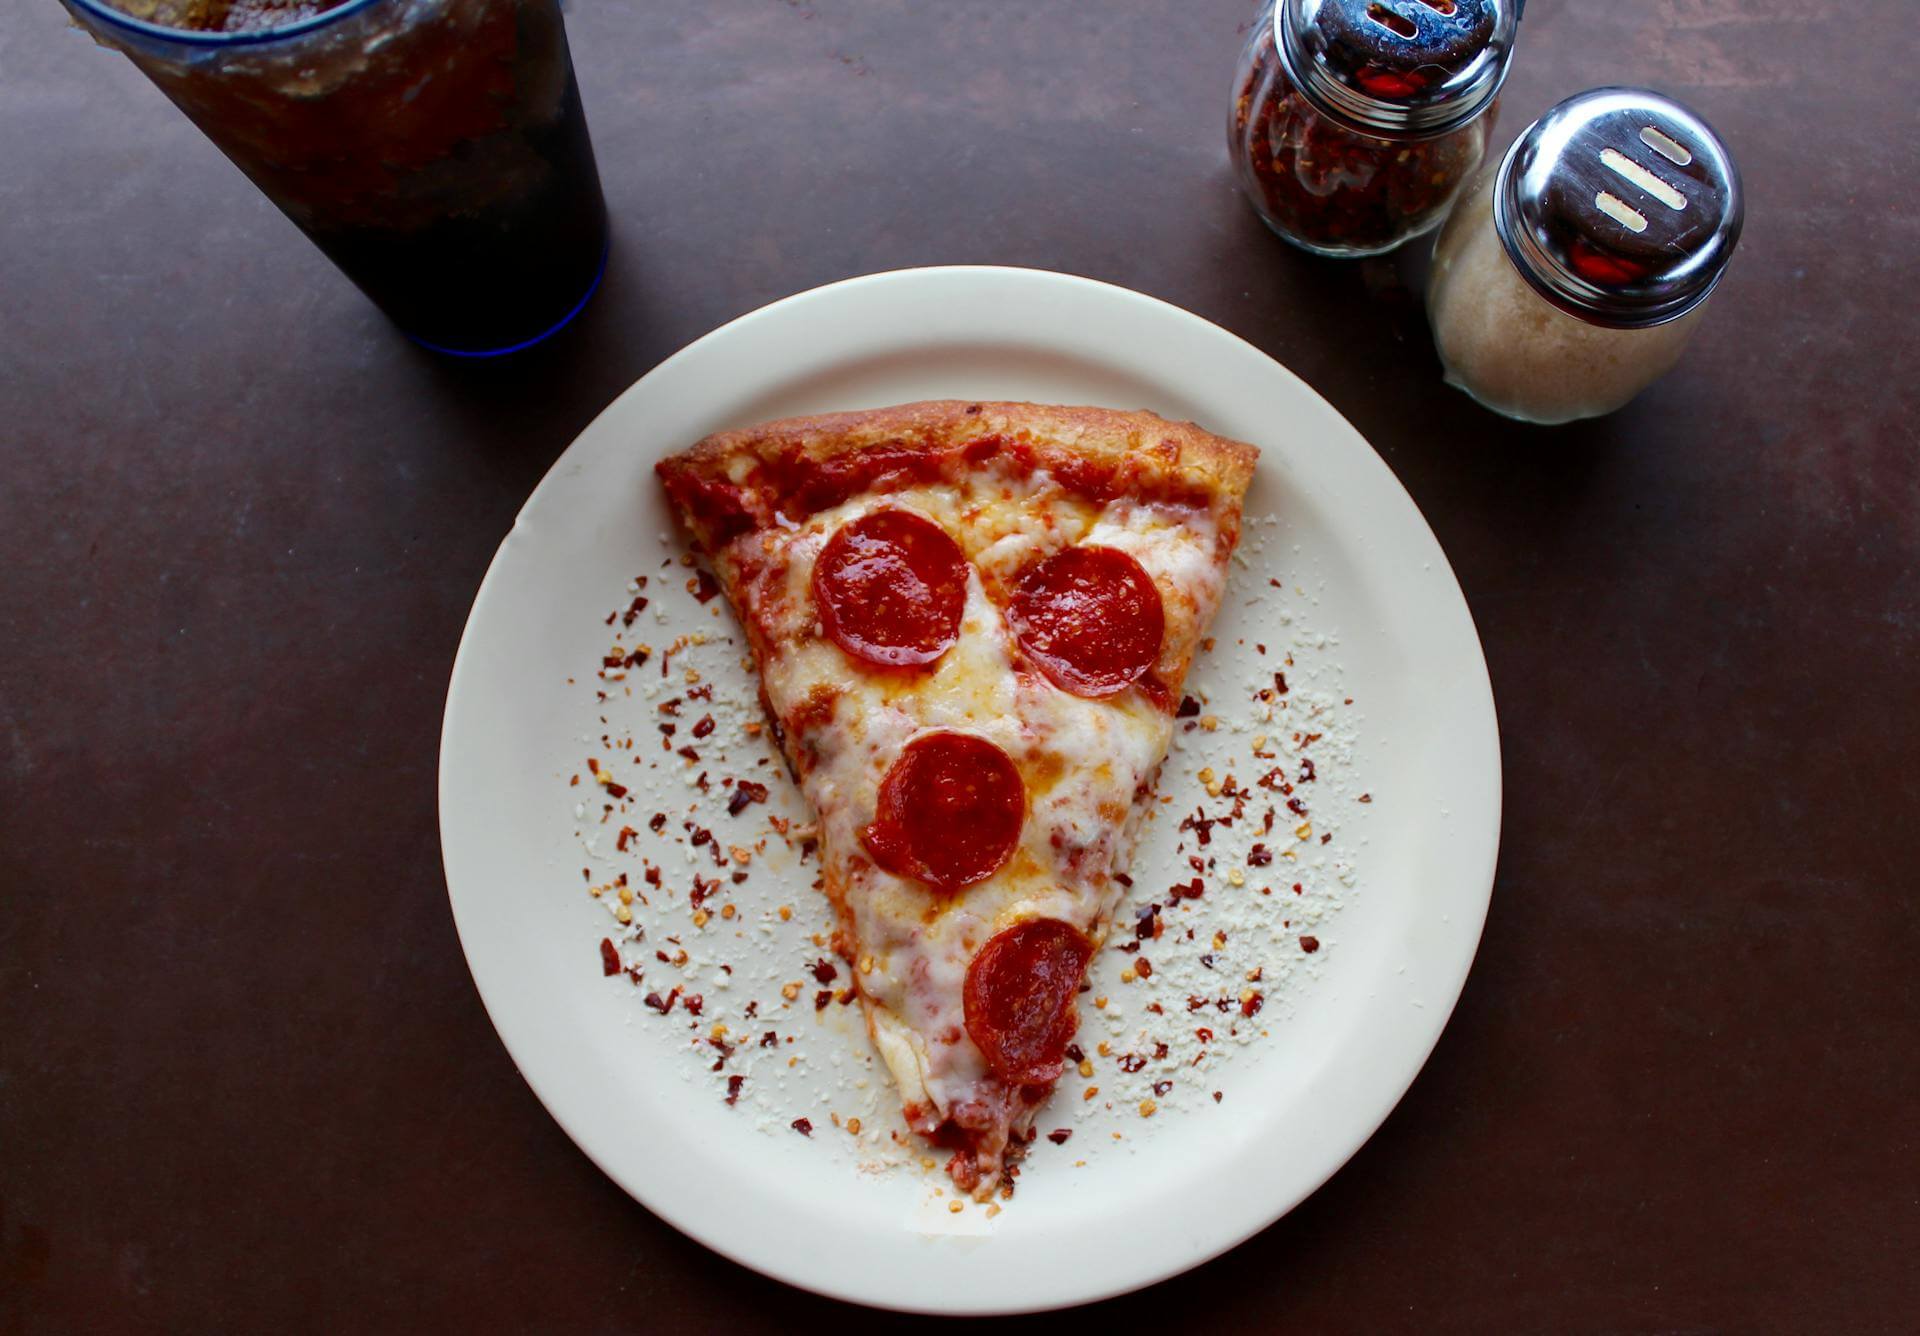
Slice of pepperoni pizza on a plate, on top of a table

Still the most popular pizza topping.

It’s finally here, one of our favorite food-forward hospitality industry reports providing operators with valuable insider insights.

In keeping with tradition, Slice released their 2024 Slice of the Union report the day before National Pizza Day. Truly, this is one of the reports I most look forward to each year.

As one would expect, the fifth-annual Slice of the Union is stuffed with helpful information.

Before we dig in, a quick rundown of Slice. The platform serves all 50 states and works with more than 20,000 independent pizzerias. To put that in context, that’s a network of pizzerias in the US larger than Domino’s, Little Caesars, and Pizza Hut combined.

If you’re an independent pizzeria owner and you have yet to partner with Slice, I encourage you to look into doing so. Should a partnership with Slice be feasible, it should increase brand awareness, engagement, traffic, and revenue to a notable degree.

Seasoning

Kicking things off, Slice sprinkles a bit of trivia onto this year’s report.

Last year, consumers apparently gorged themselves on pizza. How much was eaten? Just over 29,000 tons.

Providing context, Slice says to imagine 11,572,064,136 pennies. That’s a Scrooge McDuck dive-worthy pile of coins.

However, one category of pizza experienced a drop in popularity last year. According to Slice, pizzerias saw a 5.21-percent dip in vegan pizza orders.

Now, on to toppings.

Toppings

There’s a reason I chose a photo of a single slice of pepperoni pizza for this article.

Operators who track their data probably already know what I’m about to say: According to Slice, pepperoni is the most popular pizza topping in the US.

This is followed by, in descending order of popularity, mushrooms, sausage, extra cheese, onions, bacon, and black olives. For those wondering, kale was one of the “least-loved” toppings last year.

If you read through the 2023 Slice of the Union report or read our article reviewing it, you know they made a couple of trend predictions. Last year, Slice guessed that pickle pizzas would be in demand. Well, they were right. Orders for pickle pizzas jumped by 32 percent in 2023.

So, when Slice makes a pizza-based prediction, it’s probably in your best interest to take it to heart. Oh, waitSlice has a prediction for 2024. According to the platform, tinned fish will be a standout pizza topping this year.

Sauce

In case you’re wondering about how much data Slice has at their fingertips, here’s an interesting bit of trivia. Last year, 4,744 people ordered pizzas with anchovies, garlic, or onions on Valentine’s Day. Alrighty, then.

They also know that orders for pizza with pineapple as a topping saw an increase of nearly six percent in 2023.

Further, the 2024 Slice of the Union reveals the most and least “pizzaful” days of 2023. The former? December 1. And the latter? Thanksgiving.

Last year, Fridays accounted for the most orders, at 23.5 percent. However, only 8.7 percent of pizza orders were placed on Mondays.

For data that’s a bit more esoteric, what if Slice could reveal which Zodiac signs order the most and least pizza? Would this be useful to operators? Honestly, it could be, I suppose. Particularly for those who have loyalty programs and engage with their guests via email and text marketing.

Apparently, a Taurus (April 20 to May 20) is the most likely to order pizza. Conversely, Capricorns (December 22 to January 19) either don’t like placing food orders in general or don’t like eating pizza specifically, because they ordered the least amount last year.

By the way, if you happen to operate a pizzeria in New Jersey, you may want to search for a guest named Dominic. According to Slice, someone named Dominic in NJ placed 348 pizza orders in 2023. Sounds like Dom has earned a special perk from his favorite pizza joint.

Extra Cheese

Pizzeria owners and their teams in Hawaii, Alabama, Oregon, South Carolina, and Montana may have the happiest wallets. That’s because people who ordered pizza for delivery in those five states tipped their drivers the most.

However, people who order pizza in Washington may have slightly lighter wallets than their fellow Americans. That’s because while the average price for a large cheese pizza in the US is $18.33, that number jumps to $25.75 in the Evergreen State.

If you’d like to see the average price for a large cheese pizza in each of the 50 states, click here. As an example, the average price in Nevada (KRG Hospitality’s American HQ is in Las Vegas) is $21.09.

Speaking of price, while Dom in NJ placed the most pizza orders, Frances in New York placed the most expensive order last year: $2,867.07. Frances, I want to attend one of your pizza parties (I think).

Finally, let’s end on data that can help operators when reviewing their labor costs. On average, pizza delivery distance was 9.14 miles in 2023. And, on average, pizzerias completed the process of producing an order and delivering it in 42.5 minutes.

For more insights from the 2024 Slice of the Union, click here.

Image: Sydney Troxell on Pexels

KRG Hospitality. Restaurant Business Plan. Feasibility Study. Concept. Branding. Consultant. Start-Up.

by David Klemt David Klemt No Comments

Did This Beer Win Super Bowl LVIII?

Did This Beer Win Super Bowl LVIII?

by David Klemt

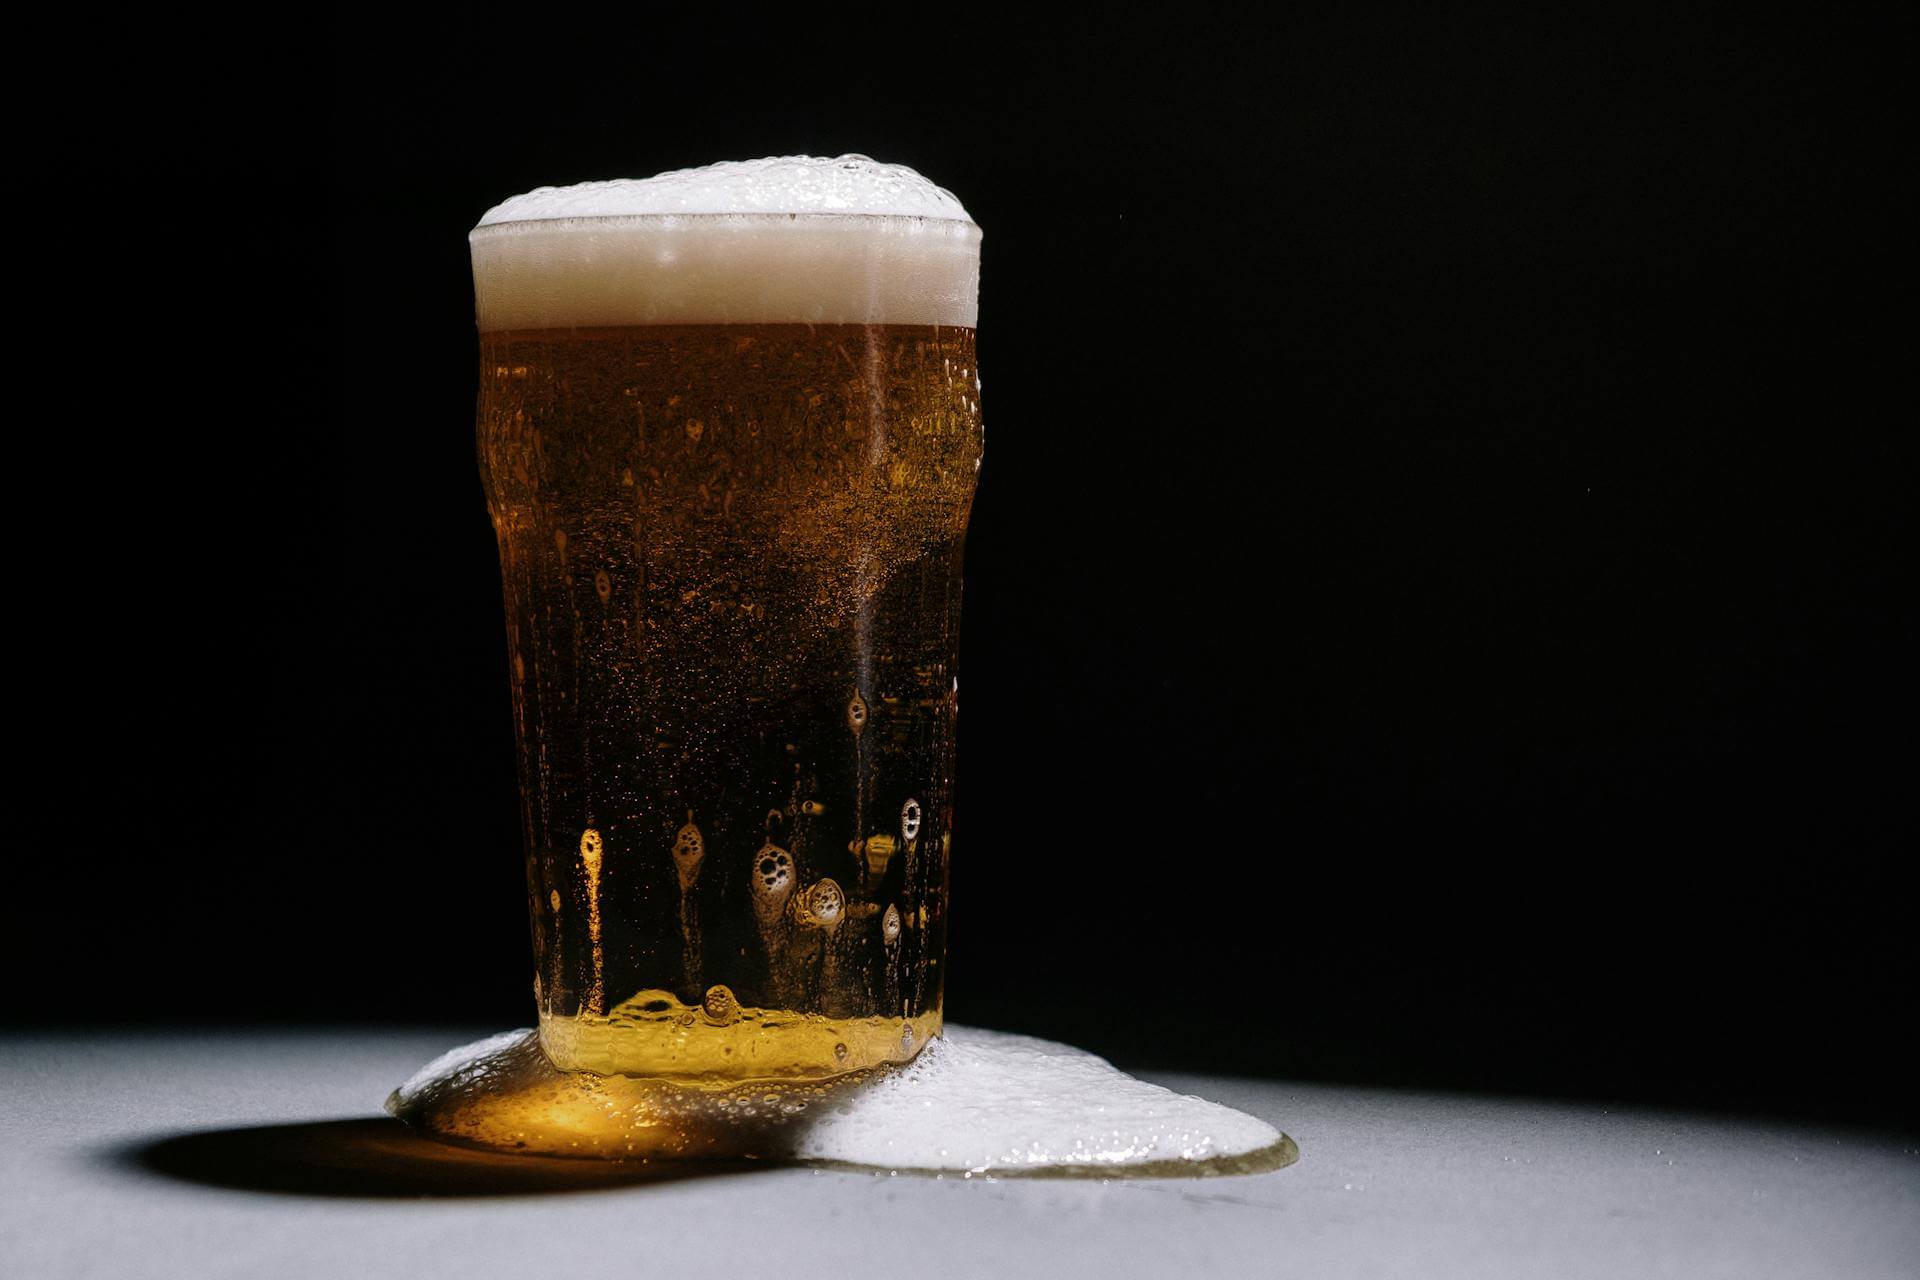
A pint glass overflowing with beer

Now that the Super Bowl is over, behavioral insight platform Veylinx is revealing the impact on brands that advertised during this year’s big game.

If Veylinx sounds familiar to you, you may be a regular KRG Hospitality news reader. Last month we looked at their dive into alcohol-free canned cocktails. Last year, we shared a Veylinx report with a focus on whether Super Bowl ads really work on consumers. And in 2022, Veylinx wondered if the interest in zero-proof drinks was all hype or worth leveraging.

This month, Veylinx is at it again. This time, however, they’re revealing which brands—those that advertised during Super Bowl LVIII—saw the biggest ROI. For context, a 30-second spot during the big game cost approximately $7 million this year.

That’s a ton of cash to shell out in the hopes of seeing a sales increase on- and off-premise.

Speaking of on-premise, Veylinx’s findings should be of interest to operators. The beer that Veylinx says “won” the Super Bowl will likely be top of mind among your guests who watched the game and the accompanying ads.

So, it stands to reason that they’ll either expect to find that beer on a menu. Likewise, they may be swayed to order the beer if they see it when scanning a bar’s taps, menu, or fridges.

With that in mind, operators may want to watch their sales of Michelob Ultra.

Study Methodology

For their latest report, Veylinx used similar methodology to their Elixir non-alcoholic canned cocktail study.

A mix of 50 percent men and fifty percent women participated in the study. All 1,604 participants were US residents aged 21 or older. Looking deeper into the participants, the age breakdown is as follows:

  • 21 to 27: 30 percent
  • 28 to 43: 25 percent
  • 44 to 59: 25 percent
  • 60 and older: 20 percent

Like the Elixir (a fake brand invented by Veylinx) study, participants bid on products with their own money. The auction mix consisted of products that advertised during Super Bowl LVIII and those that did not advertise during the game.

Study Results

Among all viewers of Super Bowl LVIII, brands that advertised during the game saw an average lift of 16 percent.

However, those brands saw the biggest boost in demand—24 percent—among men. Gen Z followed, with demand in advertised brands growing by 11 percent. Among women, brands that advertised saw just a nine-percent boost in demand.

While Doritos Dinamita was the number-one brand among all viewers in general, and men and Gen Z in particular, Michelob Ultra is a close second. Interestingly, the beer brand was the top-performer among women in terms of demand growth.

For those wondering, no alcohol brands were among the top three performers for Gen Z.

So, operators who have noticed in uptick in Michelob Ultra sales may have Super Bowl LVIII to thank. If that’s the case, if sales of Michelob Ultra have increased in bars and restaurants since this year’s big game, it appears that yes, Super Bowl ads still work on consumers.

Image: cottonbro studio on Pexels

Bar Nightclub Pub Brewery Menu Development Drinks Food

by David Klemt David Klemt No Comments

Can It? NA Canned Cocktail Performance

Can It? Zero-proof Canned Cocktail Performance

by David Klemt

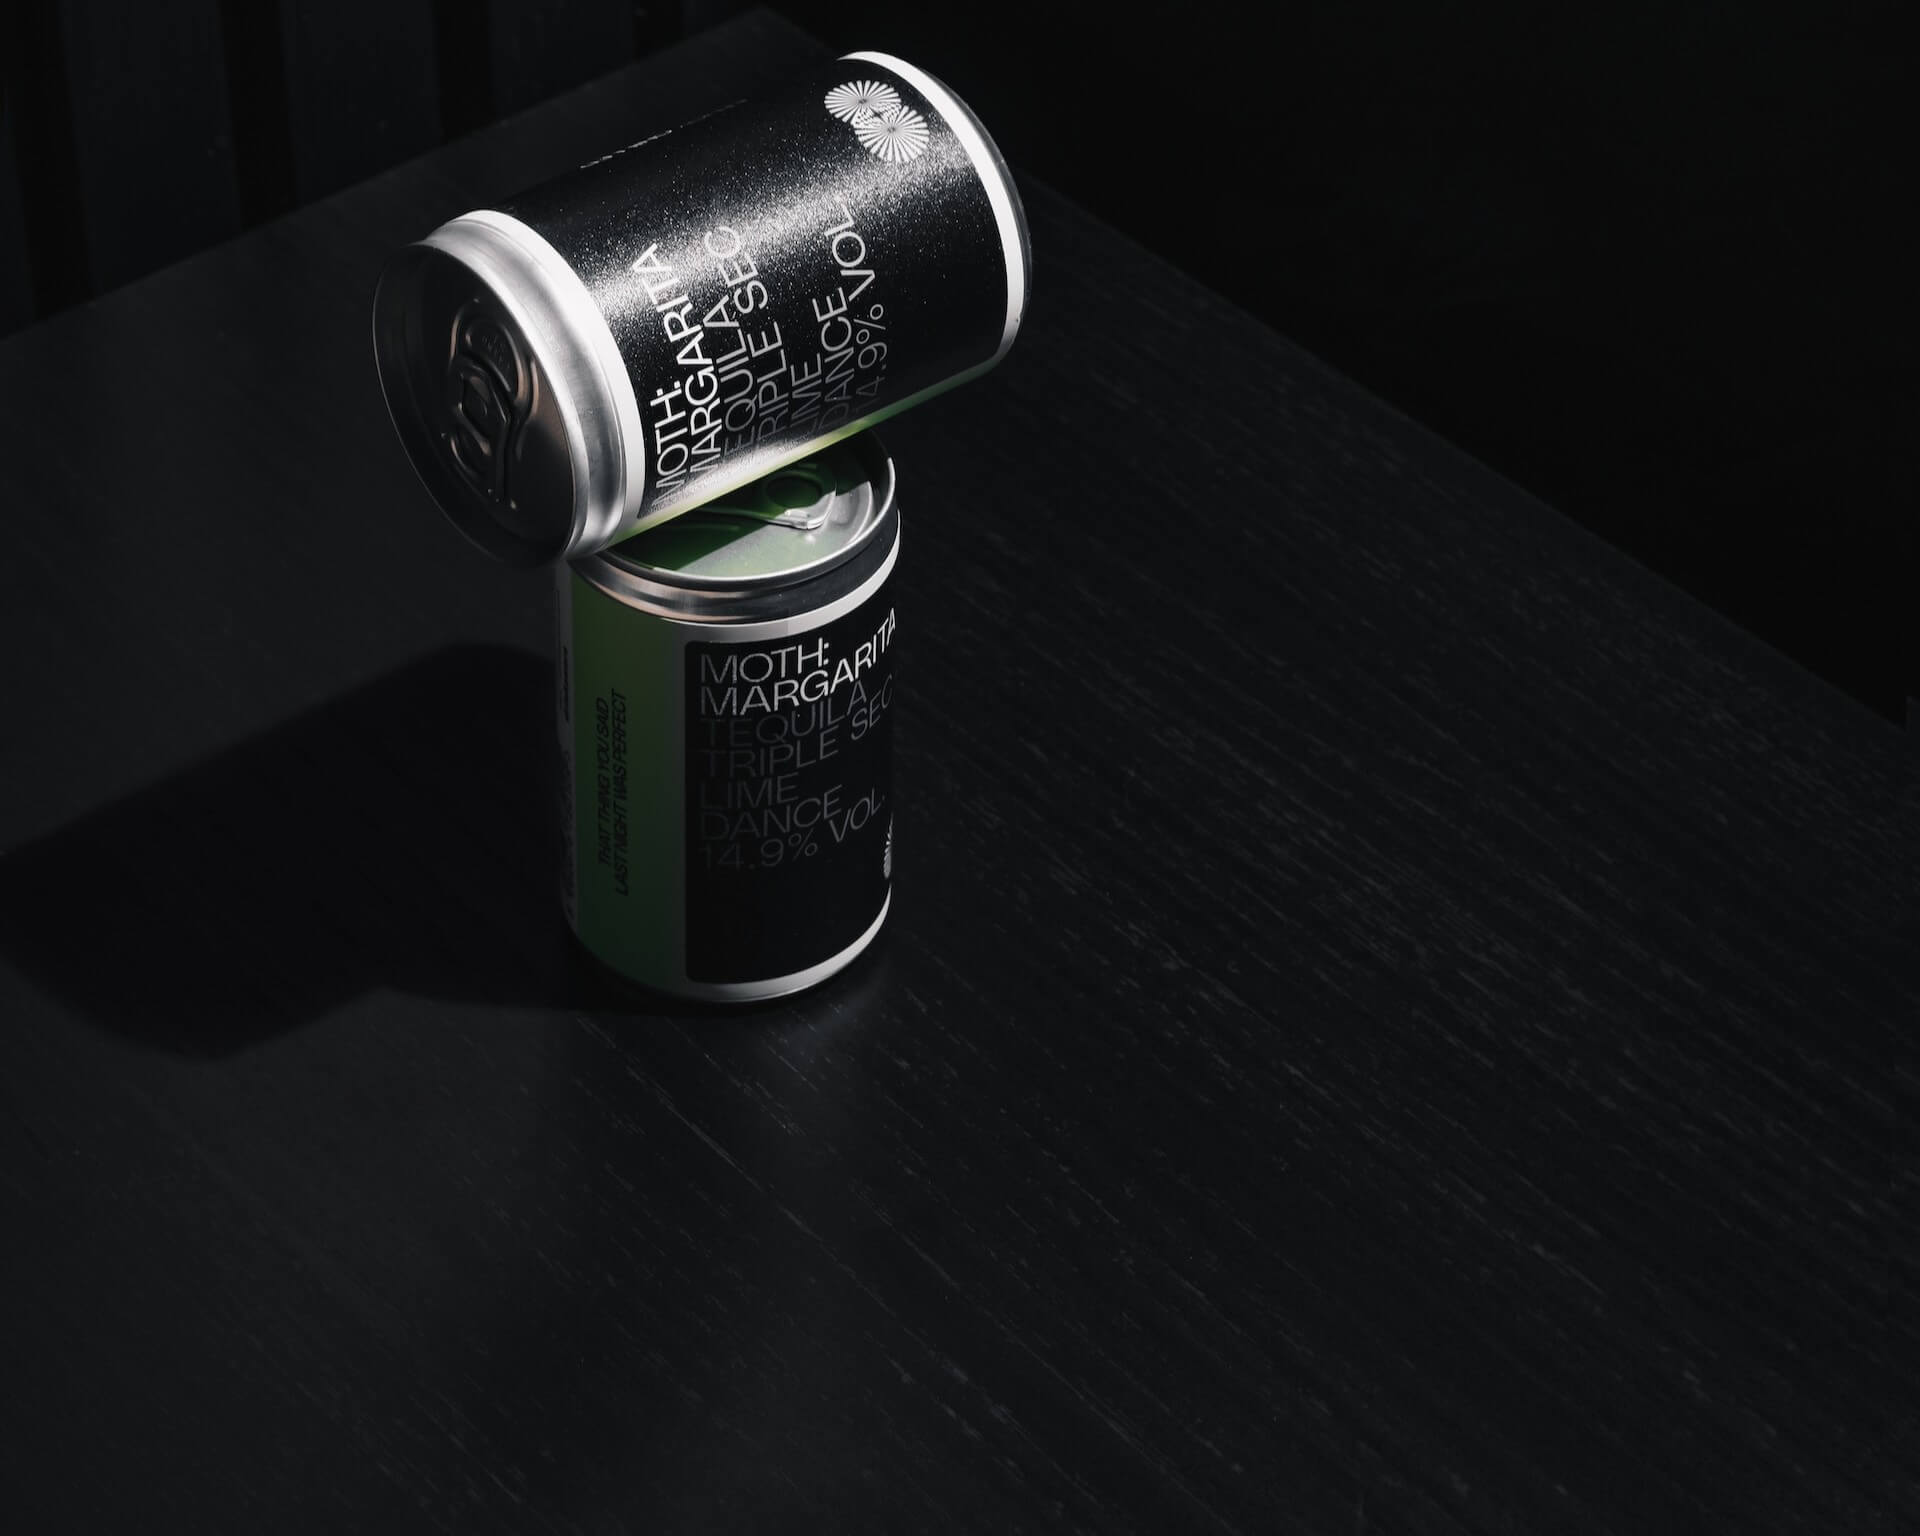
Moth Margarita canned cocktails stacked on a black, wood table

Veylinx, a behavioral research platform trusted by some of the world’s biggest brands, has turned their attention alcohol-free canned cocktails for a recent study.

They’ve researched demand for non-alcohol before. In fact, you can find our analysis of their 2022 study here. We’ve also covered their look into the effectiveness of Super Bowl ads.

For their latest study, consumer demand for non-alcoholic canned cocktails, Veylinx showed how seriously they take research and methodology.

Conducted between November and December of 2023, the platform created a fictional canned cocktail brand, Elixir. This was done to account for brand bias.

Further, the “brand” produced two benchmark products—alcohol and alcohol-free—and four variations. These non-alcoholic variants offered four different benefits: CBD, mood boost, zero-calorie, and natural detox.

All participants were 21 or older:

  • 21 to 25
  • 26 to 35
  • 36 to 45
  • 46 to 55
  • 56 to 65
  • Older than 65

Half of the study identified as male, and the other half as female. Most, 73 percent, were alcohol drinkers, while 27 percent were not.

For the study, Veylinx had each participant, 410 in total, bid on the six Elixir products with their own money. The bidding took place in randomized, sequential auction.

After the auction, the participants completed a questionnaire. The following is a sample question:

“What would be the main reasons for you NOT to buy non-alcoholic beverages? Please select all that apply.”

Possible answers to that question were: Limited availability, Limited variety, Flavor, and/or Other.

With methodology explained, let’s check out the results.

Canned Cocktails by the Numbers

While demand for non-alcohol canned cocktails appears to be growing, their counterparts remain most popular.

Per Veylinx, demand for Elixir’s alcoholic canned cocktails surged by 20 percent in their study. In comparison, average demand for the fictional brand’s non-alcoholic benchmark and variants canned cocktails increased by four percent.

Further, the full-proof and zero-proof CBD products garnered the most interest. The alcoholic version saw an uplift of seven percent, and CBD saw a three-percent uplift. Consumers showed the least interest in non-alcohol, zero-calorie variants.

Comparing 2022 to 2023, demand for “standard” alcohol-free canned cocktails is up 14 percent. This is followed by the CBD variant with four-percent growth in consumer demand. Next, non-alcoholic canned cocktails with a “mood-boosting” benefit, which grew by two percent. Natural detox saw an increase in demand of just one percent. And consumer demand for zero-calorie, zero-alcohol canned cocktails fell by one percent.

So, today’s consumer, at least according to research conducted by Veylinx, is most interested in alcoholic canned cocktails. Still, there’s growing interest in alcohol-free canned cocktails, something for operators to keep in mind.

Changes in Behavior

Speaking of interest in zero-proof, Veylinx uncovered some other interesting information.

In 2022, around 56 percent of consumers expressed interest reducing their alcohol consumption. That number fell by 18 percent to 38 percent in 2023. That’s still a significant percentage of consumers looking to make a big change in their lives.

Forty-one percent of consumers aged 21 to 35 are trying to reduce their alcohol intake. That number drops slightly to 36 percent for those aged 36 and older.

Veylinx also found that half of consumers would drink less alcohol if one simple change took place. All it would take is better-quality, non-alcohol versions at better prices to hit the market.

In fact, per Veylinx, consumers cited flavor and price as the two top influences on their decision to consume zero-proof canned cocktails. So far, energy drinks are the go-to for most consumers trying to drink less alcohol.

If they’re smart, brands with an interest in producing successful non-alcohol canned cocktails will work to improve costs, flavors, and health benefits, if this Veylinx study is taken to heart.

To review this study in its entirety yourself, click here. The press release for the study is below.

The Year of Canned Cocktails: Consumer Demand Increases for Non-Alcholic and Alcoholic Variations

NEW YORK, December 20, 2023 —  According to a new, year-over-year study from behavioral research platform Veylinx, consumer demand is increasing for both non-alcoholic and alcoholic canned cocktails. Using Veylinx’s proprietary methodology—which measures actual demand rather than intent— the study found that demand for non-alcoholic canned cocktails grew by 4%, while demand for alcoholic canned cocktails surged by 20% over last year.   

While interest remains strong for non-alcoholic alternatives, the percentage of people trying to reduce their alcohol consumption fell by 18%, to 38%. This decline from 2022 could lead to lower participation in abstinence events like Dry January. 

Half of respondents claimed they would drink less alcohol if better non-alcoholic alternatives were available, showing opportunity for yet more innovation in the beverage sector. Those looking to reduce their alcohol consumption are 50% more interested in non-alcoholic cocktails.

In 2022, “Never tried before,” was the top reason consumers gave for not buying canned non-alcoholic beverages. That is no longer the case in 2023, suggesting that non-alcoholic canned cocktails increased their market penetration over the last year. Flavor and price are now the primary reasons people don’t buy non-alcoholic cocktails.

“Even with fewer people trying to reduce their alcohol consumption, demand for non-alcoholic canned cocktails continues to grow,” said Veylinx founder and CEO Anouar El Haji. “Drinkers and non-drinkers alike are receptive to ready-to-drink alternatives that are better for their health and wallets.”

The study also measured demand for non-alcoholic cocktails enhanced with functional benefits like mood boosters, detoxifiers and CBD. Demand for the standard non-alcoholic version increased 14% from last year, while the enhanced variations increased only slightly and the zero-calorie version fell by 1%. This suggests consumers might be losing interest in what they perceive as marketing gimmicks. The CBD version saw a 4% increase in demand, remaining the most popular non-alcoholic variation. 

Additional key findings: 

  • The optimal price for non-alcoholic canned cocktails that maximizes revenue for brands is $12 for a four-pack

  • The brands consumers have tried the most are: 1) Mocktail Club, 2) Wild Tonic, 3) Spiritless, 4) DRY,  and 5) Hella Cocktail Co

  • 44% of people expressed support for an additional 10% tax on alcohol as a public health measure for reducing consumption 

  • For those aiming to drink less alcohol by replacing it with other beverages, energy drinks experienced the greatest increase in popularity

  • Physical Health and Cost are the two most popular reasons for reducing alcohol consumption

  • Grocery stores are the most popular place to buy non-alcoholic canned cocktails

  • Flavor options have the most influence on which brand consumers choose

  • A lower price would convince 20% of consumers to buy more non-alcoholic cocktails

To download more detailed results from the 2023 Non-Alcoholic Canned Cocktail study or for more information about Veylinx, visit https://veylinx.com/canned-cocktails

About the research 

Unlike typical surveys where consumers are simply asked about their preferences, Veylinx uses behavioral research to reveal how much consumers will pay for a product through a real bidding process. Consumers reveal their true willingness to pay by placing sealed bids on products and then answering follow-up questions about their reasons to buy or not to buy. The research was conducted in November and December 2023 among U.S. consumers ages 21 and over. It is a follow-up to a similar study Veylinx conducted in October 2022. The 2022 study can be found at https://info.veylinx.com/non-alcoholic-cocktails

Image: Ambitious Studio* – Rick Barrett on Unsplash

Bar Nightclub Pub Brewery Menu Development Drinks Food

by David Klemt David Klemt No Comments

af&co. x Carbonate: 2024 Trends to Watch

af&co. x Carbonate: 2024 Trends to Watch

by David Klemt

Paddle and ball on pickleball court

Marketing and creative agencies af&co. and Carbonate Group‘s 16th annual Hospitality Trends Report provides in-depth insight across several categories.

This is an in-depth, insightful report operators should review in its entirety. The “Sweet Sixteen” edition of this yearly report is available for download here.

There are two interesting details toward the end of af&co. and Carbonate’s report. First, a list of 2023 clients. Second, an explanation for the design of the report itself.

This makes sense: Carbonate is a creative agency that works in the hospitality space, after all. Further, af&co. is a hospitality industry marketing agency.

Now, I won’t be sharing every trend or insight found in these two agencies’ report. Rather, I’m highlighting a number of items across four of the report’s six categories. Again, I think operators and leadership team members should download the report for themselves.

Food

While af&co. and Carbonate identify specific cuisines and items that are trending, it’s their 10,000-foot view of food that I find most compelling. In terms of the big picture, “rigid” adherence to authentic cuisine is falling out of favor.

Chefs, in the agencies’ opinions, are taking a more modern approach to menus. Instead of following the “rules” of certain cuisines, they’re creating dishes and programs that defy labels. Of course, for those who feel the need to label, one could call this approach “contemporary fusion.”

Examples given are Good Luck Gato’s Okonomiyaki Baked Potato, and the Birria Dumplings at Little Bull.

Cuisine Trends

Of course, af& co. and Carbonate also zoom in on food. Their Cuisine of the Year goes to Korean.

Dessert of the Year goes to the Pavlova or Eton Mess. So, one can argue that operators should connect with their back-of-house teams about meringue-based desserts.

Other food trends include making pastries with buckwheat; getting inventive with mortadella; serving borek in snack and entree size; and Brazilian-style pizza.

However, it’s a presentation trend that stood out the most to me. Accompanied by a timeline complete with images, the agencies state confidently that we’re in the “Crescent Moon” era of plating.

Visualize a plate, then place all of the food along the edge, with roughly two-thirds of the space open. That’s the crescent moon presentation.

Beverage

A number of the trends in this section aren’t exactly new. That tells me that some are likely on the brink of moving from trend to ubiquity.

That, or they’re at risk of bumping against their expiration date.

Two trends that have been popping their fins out of the sea of cocktails for a bit make it into the af&co. and Carbonate report. One is clarified cocktails.

Spend a bit of time looking up cocktails on social media and you’ll see these are a bit divisive. Some bartenders are all for them, some appear to absolutely despise this trend. Guests, however, seem to like the novelty of well-known, opaque or translucent classic turning transparent.

Another drink trend? Culinary cocktails. For food-driven concepts, it makes perfect sense to encourage the bar team to work closely with the kitchen team. Offering culinary cocktails is one method of pulling a concept’s threads tighter, telling a more complete story.

Along those lines, the agencies identify another divisive cocktail trend: cheese.

Personally, cocktails that feature cheese aren’t my thing. However, these drinks are, at the minimum, going to grab a guest’s attention. And those who order these drinks aren’t likely to forget the experience any time soon, good or bad.

That last point is important for operators and their teams to remember. A negative experience can be more powerful and stick with a guest longer than a positive one. So, pursue trends with caution.

Hotel

One of the biggest hotel developments the Hospitality Trends Report identifies is the dual-brand hotel. This is also a trend with which KRG Hospitality is well acquainted, both through industry research and client projects.

So far, the most common approach tends to include two towers, a shared lobby and fitness center, and shared F&B concepts. However, there are properties that incorporate not only brand-specific design for each tower but separate the bars and restaurants as well.

Notably, Marriott opened the first-ever tri-brand hotel in Nashville in 2019. The hotel and resort colossus combined an AC Hotel, a Residence Inn, and a SpringHill Suites.

Another interesting hotel trend? Eco-friendly, pre-fab construction. An excellent example of this approach is Moliving. To learn more about this brand, check out Bar Hacks podcast episode 68 with Jordan and Hanna Bem.

Interest by consumers in supporting eco-friendly brands informs two other trends identified by af&co. and Carbonate. One of these is hotels and resorts including e-bikes among their amenities.

Another is rewarding guests for engaging in a number of green initiatives. For example, cleaning up the beach in front of a hotel, or helping to plant trees on or near the property.

Speaking further of amenities, hotel and resort operators are likely aware that if they have courts for racquet sports, they need to include pickleball.

Design

Operators considering a refresh or starting from a clean slate for a new space may want to work with a designer on the following approach: maximalism.

According to the 16th annual Hospitality Trends Report, this bold, playful design language is on the rise. Following this trend, af&co. and Carbonate think that maximalism is working particularly well for “concept-driven, design-forward” bars.

As far as colors and materials operators may want to ask designers about, the agencies suggest pink, bronze, gold, and velvet. These colors are warm and welcoming, exactly what a hospitality venue should be.

To download the Hospitality Trends Report, click here. Two categories not covered in this article are Marketing Ideas and Social Media Trends, so follow that link!

Image: Mason Tuttle on Pexels

Bar Nightclub Pub Brewery Menu Development Drinks Food

Top