Notice: Function _load_textdomain_just_in_time was called incorrectly. Translation loading for the smart-post-show-pro domain was triggered too early. This is usually an indicator for some code in the plugin or theme running too early. Translations should be loaded at the init action or later. Please see Debugging in WordPress for more information. (This message was added in version 6.7.0.) in /var/www/wp-includes/functions.php on line 6114
Guest behavior | KRG Hospitality

Guest behavior

by David Klemt David Klemt No Comments

Is Demand for Delivery Down?

Is Demand for Delivery Down?

by David Klemt

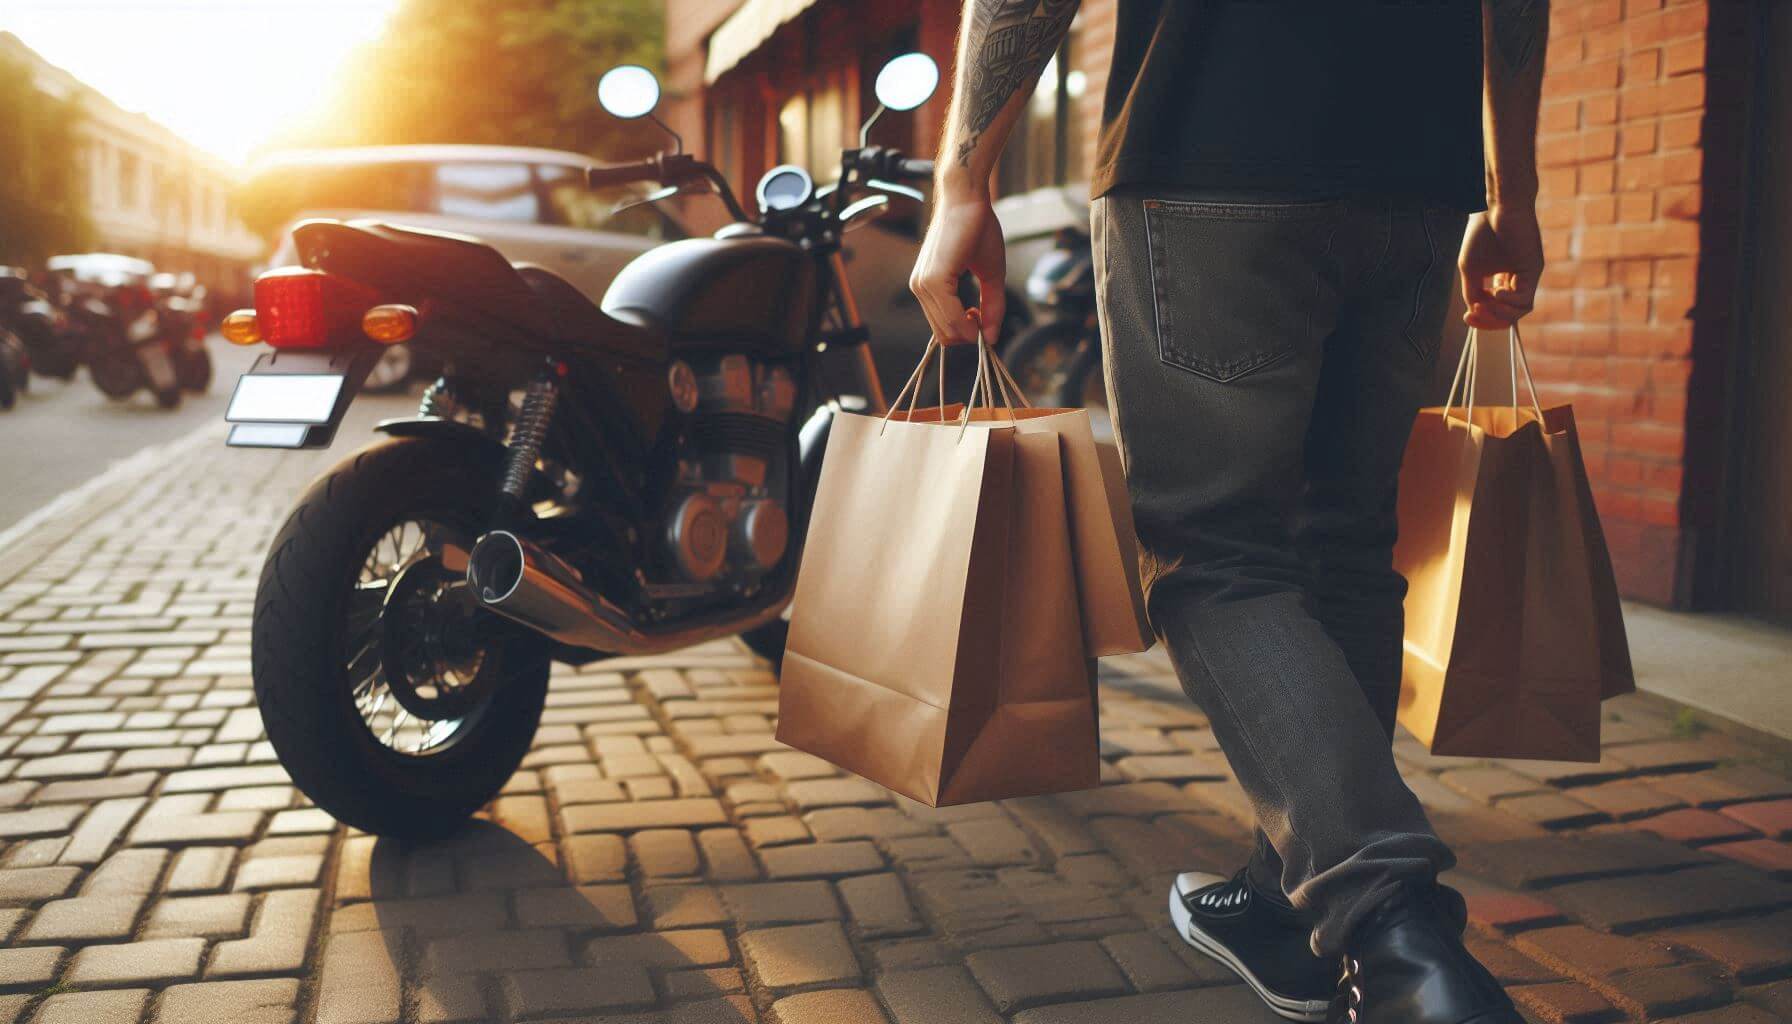
AI-generated image of a person carrying takeout bags from restaurant to their motorcycle

I have done this. Cargo straps required.

Not too long ago, it seemed as delivery was going to overtake people’s desire to enjoy a restaurant in person, but that trend may be on a downward swing.

At first, this trend made perfect sense, for obvious reasons. For a while, the best way for consumers to enjoy their favorite restaurants and show support was to order delivery.

Rideshare companies jumped on delivery, as did several platforms. When guests were able to visit restaurants in person freely, delivery had become a habit for many of them. In fact, ordering delivery had become the de facto method of engaging with restaurants for a not-insignificant percentage of people.

However, operators and their teams weren’t shy about exposing their delivery “partners.” I think it’s fair to describe the fees operators were being charged by some of these partners as outrageous.

When the public found out about these fees, they didn’t sit well. Takeout, carryout, takeaway, order for pickup… Whatever your preferred nomenclature, people began seeing it as superior to delivery. This shift in consumer behavior was driven by a desire to support their favorite restaurants.

Of course, there are other factors that affected people’s move away from delivery. I’m confident in saying that most of us who have ordered delivery at some point in the last couple of years has experienced at least one of several downsides.

However, has delivery really fallen out of favor? Have takeout or drive-up pickup actually been passing up delivery?

Datassential’s 2024 Midyear Trends Report has some insights that can answer those questions. You can (and should) check it out for yourself here.

The State of Takeout and Delivery

To obtain a snapshot of the state of the performance of delivery and takeout, Datassential conducted a survey in May of this year. The F&B intelligence platform surveyed 400 US operators and more than 1,500 US consumers.

According to Datassential, nearly half of restaurant operators reported increases in guests dining in person at their restaurants.

Perhaps more telling, however, is that Datassential’s survey reveals that half of restaurants aren’t even offering delivery. I don’t know the breakdown of operators who once offered delivery and stopped doing so versus operators who never offered delivery.

What I do know is that there are, as I alluded to up top, many reasons for people to eschew delivery. Chief among these are cost, and the condition of the order when it arrives to the guest.

On the operator side, cost is once again a consideration, as are negative reviews and complaints. More than one study has shown that operators often get the blame when a third party botches an element of the delivery. These complaints can include food being delivered lukewarm or cold, parts of the delivery missing, or the wrong items being delivered to someone.

But, again, is demand for delivery slipping?

Per Datassential’s report, takeout and catering are outpacing the growth of delivery for US operators. Almost 40 percent of operators who participated in Datassential’s survey reported an increase in frequency for takeout and catering orders. In comparison, just 20 percent of respondents ordered an increase in delivery order.

Just eight percent of operators indicated a decrease in takeout and delivery. In fact, the greatest decrease impacts catering (14 percent), according to Datassential’s report.

Takeaway

Delivery, simply put, doesn’t work for every operator or every concept. Moreover, it looks like consumer desire for takeout is on a greater upswing in contrast to delivery.

For concepts that succeed with delivery, it’s imperative that operators control the process rather than cede to third parties, in my opinion.

The best way forward will vary from business to business. Operators and their teams need to be ruthless the quality, consistency, accuracy, and value of all orders, whether placed in person, for takeout, or for delivery. Further, when it comes to takeout and delivery, the ordering process must be convenient.

What’s clear is that every operator needs to dive into their data, determine how guests prefer to order from their restaurant, and pursue those preferences to enhance the guest experience.

Image: Microsoft Designer

KRG Hospitality Contact Request for Proposal 30 Minute Discovery Session

Book Below to Setup a 30-Minute Complimentary Discovery Call and Request for Proposal.


by David Klemt David Klemt No Comments

Did This Beer Win Super Bowl LVIII?

Did This Beer Win Super Bowl LVIII?

by David Klemt

A pint glass overflowing with beer

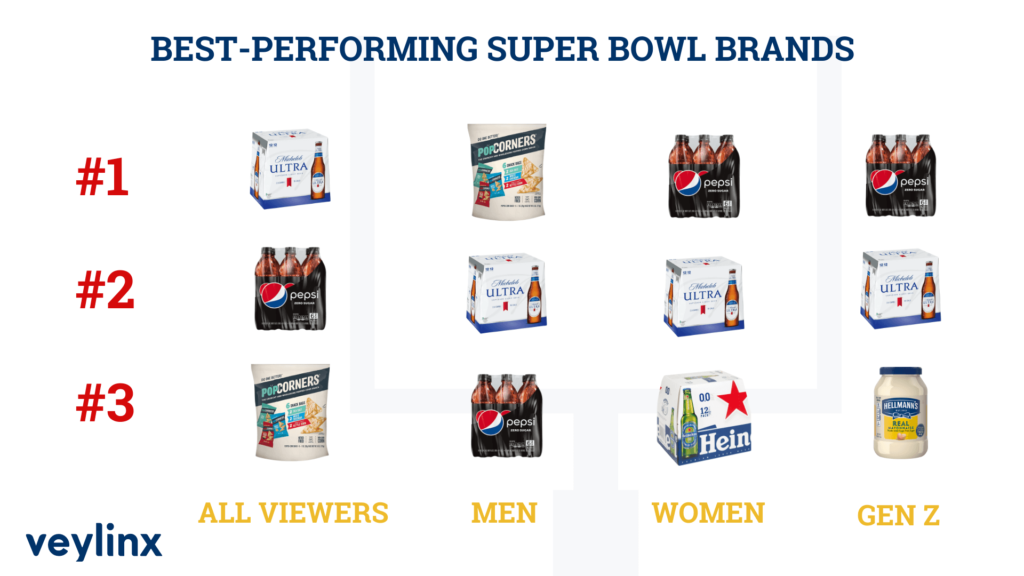
Now that the Super Bowl is over, behavioral insight platform Veylinx is revealing the impact on brands that advertised during this year’s big game.

If Veylinx sounds familiar to you, you may be a regular KRG Hospitality news reader. Last month we looked at their dive into alcohol-free canned cocktails. Last year, we shared a Veylinx report with a focus on whether Super Bowl ads really work on consumers. And in 2022, Veylinx wondered if the interest in zero-proof drinks was all hype or worth leveraging.

This month, Veylinx is at it again. This time, however, they’re revealing which brands—those that advertised during Super Bowl LVIII—saw the biggest ROI. For context, a 30-second spot during the big game cost approximately $7 million this year.

That’s a ton of cash to shell out in the hopes of seeing a sales increase on- and off-premise.

Speaking of on-premise, Veylinx’s findings should be of interest to operators. The beer that Veylinx says “won” the Super Bowl will likely be top of mind among your guests who watched the game and the accompanying ads.

So, it stands to reason that they’ll either expect to find that beer on a menu. Likewise, they may be swayed to order the beer if they see it when scanning a bar’s taps, menu, or fridges.

With that in mind, operators may want to watch their sales of Michelob Ultra.

Study Methodology

For their latest report, Veylinx used similar methodology to their Elixir non-alcoholic canned cocktail study.

A mix of 50 percent men and fifty percent women participated in the study. All 1,604 participants were US residents aged 21 or older. Looking deeper into the participants, the age breakdown is as follows:

  • 21 to 27: 30 percent
  • 28 to 43: 25 percent
  • 44 to 59: 25 percent
  • 60 and older: 20 percent

Like the Elixir (a fake brand invented by Veylinx) study, participants bid on products with their own money. The auction mix consisted of products that advertised during Super Bowl LVIII and those that did not advertise during the game.

Study Results

Among all viewers of Super Bowl LVIII, brands that advertised during the game saw an average lift of 16 percent.

However, those brands saw the biggest boost in demand—24 percent—among men. Gen Z followed, with demand in advertised brands growing by 11 percent. Among women, brands that advertised saw just a nine-percent boost in demand.

While Doritos Dinamita was the number-one brand among all viewers in general, and men and Gen Z in particular, Michelob Ultra is a close second. Interestingly, the beer brand was the top-performer among women in terms of demand growth.

For those wondering, no alcohol brands were among the top three performers for Gen Z.

So, operators who have noticed in uptick in Michelob Ultra sales may have Super Bowl LVIII to thank. If that’s the case, if sales of Michelob Ultra have increased in bars and restaurants since this year’s big game, it appears that yes, Super Bowl ads still work on consumers.

Image: cottonbro studio on Pexels

Bar Nightclub Pub Brewery Menu Development Drinks Food

by David Klemt David Klemt No Comments

Can It? NA Canned Cocktail Performance

Can It? Zero-proof Canned Cocktail Performance

by David Klemt

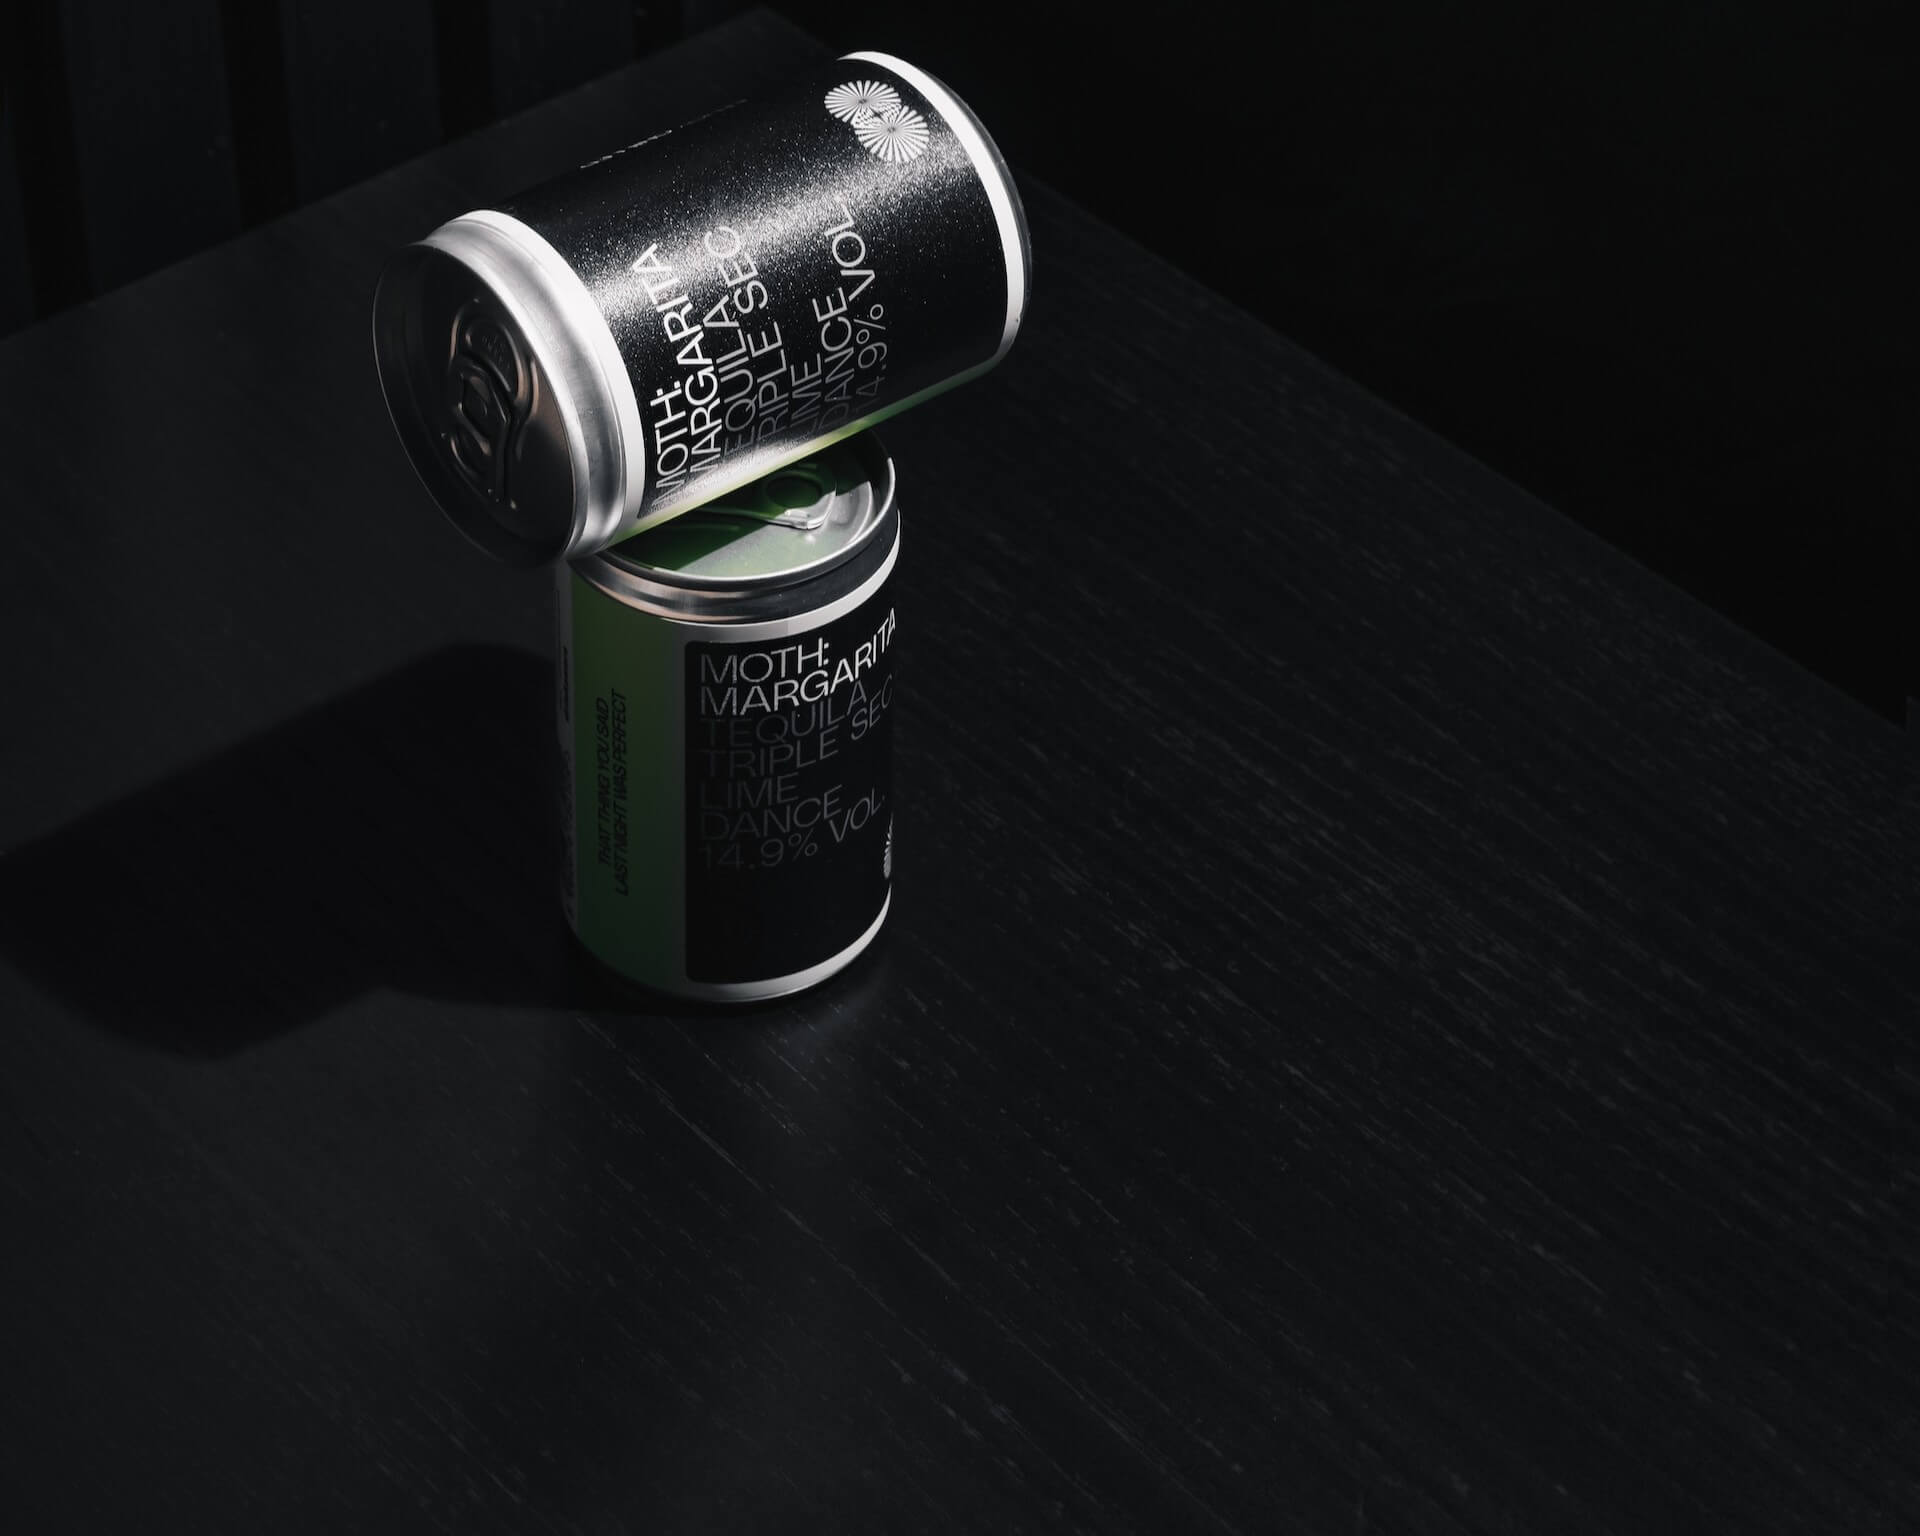
Moth Margarita canned cocktails stacked on a black, wood table

Veylinx, a behavioral research platform trusted by some of the world’s biggest brands, has turned their attention alcohol-free canned cocktails for a recent study.

They’ve researched demand for non-alcohol before. In fact, you can find our analysis of their 2022 study here. We’ve also covered their look into the effectiveness of Super Bowl ads.

For their latest study, consumer demand for non-alcoholic canned cocktails, Veylinx showed how seriously they take research and methodology.

Conducted between November and December of 2023, the platform created a fictional canned cocktail brand, Elixir. This was done to account for brand bias.

Further, the “brand” produced two benchmark products—alcohol and alcohol-free—and four variations. These non-alcoholic variants offered four different benefits: CBD, mood boost, zero-calorie, and natural detox.

All participants were 21 or older:

  • 21 to 25
  • 26 to 35
  • 36 to 45
  • 46 to 55
  • 56 to 65
  • Older than 65

Half of the study identified as male, and the other half as female. Most, 73 percent, were alcohol drinkers, while 27 percent were not.

For the study, Veylinx had each participant, 410 in total, bid on the six Elixir products with their own money. The bidding took place in randomized, sequential auction.

After the auction, the participants completed a questionnaire. The following is a sample question:

“What would be the main reasons for you NOT to buy non-alcoholic beverages? Please select all that apply.”

Possible answers to that question were: Limited availability, Limited variety, Flavor, and/or Other.

With methodology explained, let’s check out the results.

Canned Cocktails by the Numbers

While demand for non-alcohol canned cocktails appears to be growing, their counterparts remain most popular.

Per Veylinx, demand for Elixir’s alcoholic canned cocktails surged by 20 percent in their study. In comparison, average demand for the fictional brand’s non-alcoholic benchmark and variants canned cocktails increased by four percent.

Further, the full-proof and zero-proof CBD products garnered the most interest. The alcoholic version saw an uplift of seven percent, and CBD saw a three-percent uplift. Consumers showed the least interest in non-alcohol, zero-calorie variants.

Comparing 2022 to 2023, demand for “standard” alcohol-free canned cocktails is up 14 percent. This is followed by the CBD variant with four-percent growth in consumer demand. Next, non-alcoholic canned cocktails with a “mood-boosting” benefit, which grew by two percent. Natural detox saw an increase in demand of just one percent. And consumer demand for zero-calorie, zero-alcohol canned cocktails fell by one percent.

So, today’s consumer, at least according to research conducted by Veylinx, is most interested in alcoholic canned cocktails. Still, there’s growing interest in alcohol-free canned cocktails, something for operators to keep in mind.

Changes in Behavior

Speaking of interest in zero-proof, Veylinx uncovered some other interesting information.

In 2022, around 56 percent of consumers expressed interest reducing their alcohol consumption. That number fell by 18 percent to 38 percent in 2023. That’s still a significant percentage of consumers looking to make a big change in their lives.

Forty-one percent of consumers aged 21 to 35 are trying to reduce their alcohol intake. That number drops slightly to 36 percent for those aged 36 and older.

Veylinx also found that half of consumers would drink less alcohol if one simple change took place. All it would take is better-quality, non-alcohol versions at better prices to hit the market.

In fact, per Veylinx, consumers cited flavor and price as the two top influences on their decision to consume zero-proof canned cocktails. So far, energy drinks are the go-to for most consumers trying to drink less alcohol.

If they’re smart, brands with an interest in producing successful non-alcohol canned cocktails will work to improve costs, flavors, and health benefits, if this Veylinx study is taken to heart.

To review this study in its entirety yourself, click here. The press release for the study is below.

The Year of Canned Cocktails: Consumer Demand Increases for Non-Alcholic and Alcoholic Variations

NEW YORK, December 20, 2023 —  According to a new, year-over-year study from behavioral research platform Veylinx, consumer demand is increasing for both non-alcoholic and alcoholic canned cocktails. Using Veylinx’s proprietary methodology—which measures actual demand rather than intent— the study found that demand for non-alcoholic canned cocktails grew by 4%, while demand for alcoholic canned cocktails surged by 20% over last year.   

While interest remains strong for non-alcoholic alternatives, the percentage of people trying to reduce their alcohol consumption fell by 18%, to 38%. This decline from 2022 could lead to lower participation in abstinence events like Dry January. 

Half of respondents claimed they would drink less alcohol if better non-alcoholic alternatives were available, showing opportunity for yet more innovation in the beverage sector. Those looking to reduce their alcohol consumption are 50% more interested in non-alcoholic cocktails.

In 2022, “Never tried before,” was the top reason consumers gave for not buying canned non-alcoholic beverages. That is no longer the case in 2023, suggesting that non-alcoholic canned cocktails increased their market penetration over the last year. Flavor and price are now the primary reasons people don’t buy non-alcoholic cocktails.

“Even with fewer people trying to reduce their alcohol consumption, demand for non-alcoholic canned cocktails continues to grow,” said Veylinx founder and CEO Anouar El Haji. “Drinkers and non-drinkers alike are receptive to ready-to-drink alternatives that are better for their health and wallets.”

The study also measured demand for non-alcoholic cocktails enhanced with functional benefits like mood boosters, detoxifiers and CBD. Demand for the standard non-alcoholic version increased 14% from last year, while the enhanced variations increased only slightly and the zero-calorie version fell by 1%. This suggests consumers might be losing interest in what they perceive as marketing gimmicks. The CBD version saw a 4% increase in demand, remaining the most popular non-alcoholic variation. 

Additional key findings: 

  • The optimal price for non-alcoholic canned cocktails that maximizes revenue for brands is $12 for a four-pack

  • The brands consumers have tried the most are: 1) Mocktail Club, 2) Wild Tonic, 3) Spiritless, 4) DRY,  and 5) Hella Cocktail Co

  • 44% of people expressed support for an additional 10% tax on alcohol as a public health measure for reducing consumption 

  • For those aiming to drink less alcohol by replacing it with other beverages, energy drinks experienced the greatest increase in popularity

  • Physical Health and Cost are the two most popular reasons for reducing alcohol consumption

  • Grocery stores are the most popular place to buy non-alcoholic canned cocktails

  • Flavor options have the most influence on which brand consumers choose

  • A lower price would convince 20% of consumers to buy more non-alcoholic cocktails

To download more detailed results from the 2023 Non-Alcoholic Canned Cocktail study or for more information about Veylinx, visit https://veylinx.com/canned-cocktails

About the research 

Unlike typical surveys where consumers are simply asked about their preferences, Veylinx uses behavioral research to reveal how much consumers will pay for a product through a real bidding process. Consumers reveal their true willingness to pay by placing sealed bids on products and then answering follow-up questions about their reasons to buy or not to buy. The research was conducted in November and December 2023 among U.S. consumers ages 21 and over. It is a follow-up to a similar study Veylinx conducted in October 2022. The 2022 study can be found at https://info.veylinx.com/non-alcoholic-cocktails

Image: Ambitious Studio* – Rick Barrett on Unsplash

Bar Nightclub Pub Brewery Menu Development Drinks Food

by David Klemt David Klemt No Comments

DoorDash Names 2023 Global F&B Trends

DoorDash Names 2023 Global F&B Trends

by David Klemt

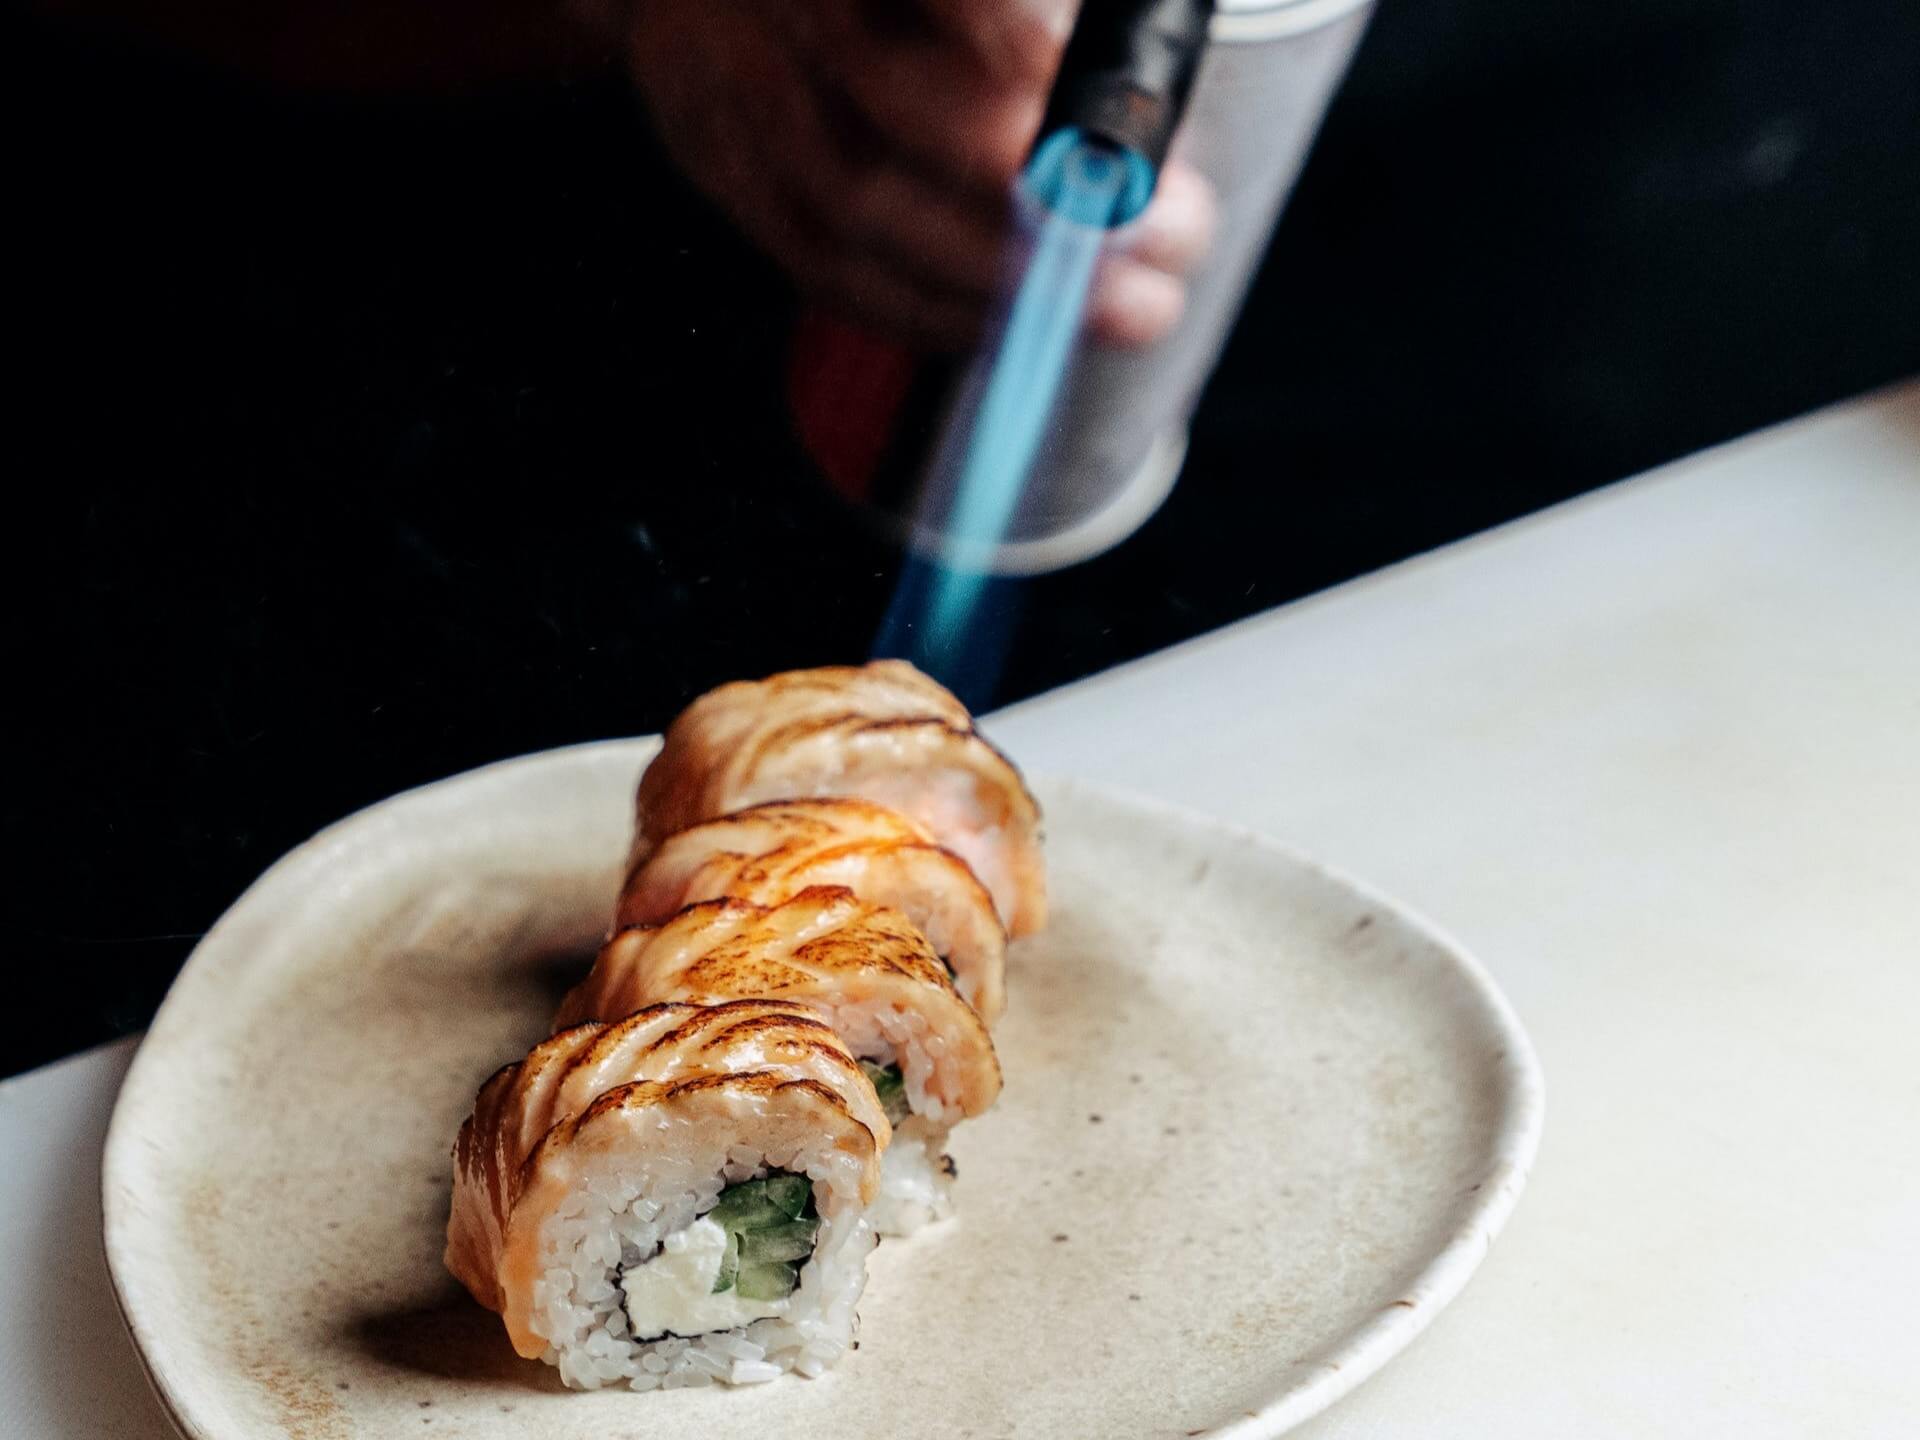
Chef torching salmon sushi

As we get close to winding down 2023 and welcoming 2024, DoorDash takes a shot at identifying the global F&B trends to watch.

This is an exciting and insightful time of year for our industry. In the last quarter, different sources start publishing their data-backed F&B predictions for the year ahead.

Take, for example, Technomic’s Global, Canadian, and American trend predictions for 2023. Oh, and don’t worry—we’ll be taking a look at their predictions for 2024 soon.

Today, however, we’re checking in on DoorDash. Admittedly, I’m not the biggest fan of third-party delivery. It’s no secret I favor direct delivery for operators.

There’s no denying, though, that third-party delivery companies have access to valuable data. From the top food and drink orders to the dayparts seeing the most delivery and pickup order growth, they can help operators see shifts in consumer behavior.

So, I’m happy to take a look at what food trends DoorDash thinks operators should watch moving forward.

Before we jump in, I’m happy that DoorDash includes this cautionary statement in their article: “Finally, always consider whether or not a trend actually fits in at your restaurant.”

At KRG Hospitality, we couldn’t agree more. Jumping on every trend, as tempting as that may be, is unwise and can do harm than good. So, while the lists below identify trends that are gaining traction currently, operators need to be discerning.

Food Trends

Let’s start with a trend multiple sources identified toward the end of 2022 that appears to still be on an upward trajectory: pickles.

Seriously, it seems that people can’t get enough pickles. Pickle pizza appears to the current darling when it comes to this food trend. Speaking of pizza, DoorDash sees square pizzas as a trend to watch.

Another trend that multiple sources have been keeping tabs on is chimichurri. According to DoorDash, this condiment is finding its way onto all manner of food item.

Other food trends that operators should be aware of are bowls (deconstruct a sandwich, burrito, etc., and you have a bowl); oyster mushrooms subbing in for meat; higher-end tinned fish; and gluten-free menu options.

To be honest, I don’t think that last one is just a trend. At this point, offering gluten-free options or entire menus is mainstream.

Now, there are two more food trends I want to address separately. One, smaller menus. This is a trend I believe most operators can and should get behind. Shrinking a menu can result in lower food and labor costs, and a happier team. Making a menu smaller can also make a restaurant more nimble and engaging as LTOs may have more impact.

And then there’s aburi sushi, which is presented after the top of the fish is torched. This gives sushi a smoky flavor and brings in a different texture element.

To be fair, I’ve expected this to take off for the past several years. Now, it appears it’s taking hold and moving from fad to trend.

TikTok Trends

Yes, we have to talk about TikTok. There’s no question that the platform is a trend-producing powerhouse.

Clearly, TikTok has an influence on food trends. If you want to know what your younger guests want to try, check TikTok. The same goes for your guests who are highly engaged with social media influencers.

Below, the trends DoorDash sees taking hold.

  • Chopped sandwiches. Do you have sandwiches on your menu? Can your guests watch as your team makes them? You may want to create a chopped version of your signature or best-selling sandwich.
  • Pasta salad summer. Apparently, this summer was the Summer of Pasta Salad. Specifically, pasta salads made with fresh ingredients, and made without ingredients like mayonnaise.
  • Cottage cheese. According to DoorDash, TikTokers are putting cottage cheese in scrambled eggs, adding it to pasta sauce, and using it to make cheese toasts. I’ve personally tried the TikTok trend of using cottage cheese to make nacho cheese sauce.

One word of caution: TikTok trends come and go in the blink of an eye. So, operators need to hop on trends that work with their restaurant or bar before they’re already out of favor. It’s a daunting task.

To review this DoorDash report in its entirety, including beverage and grocery trends, follow this link.

Image: Ivan Samkov on Pexels

Bar Nightclub Pub Brewery Menu Development Drinks Food

by David Klemt David Klemt No Comments

2023 Cravings Report: “The Most” Orders

2023 Uber Eats Cravings Report: “The Most…” Orders

by David Klemt

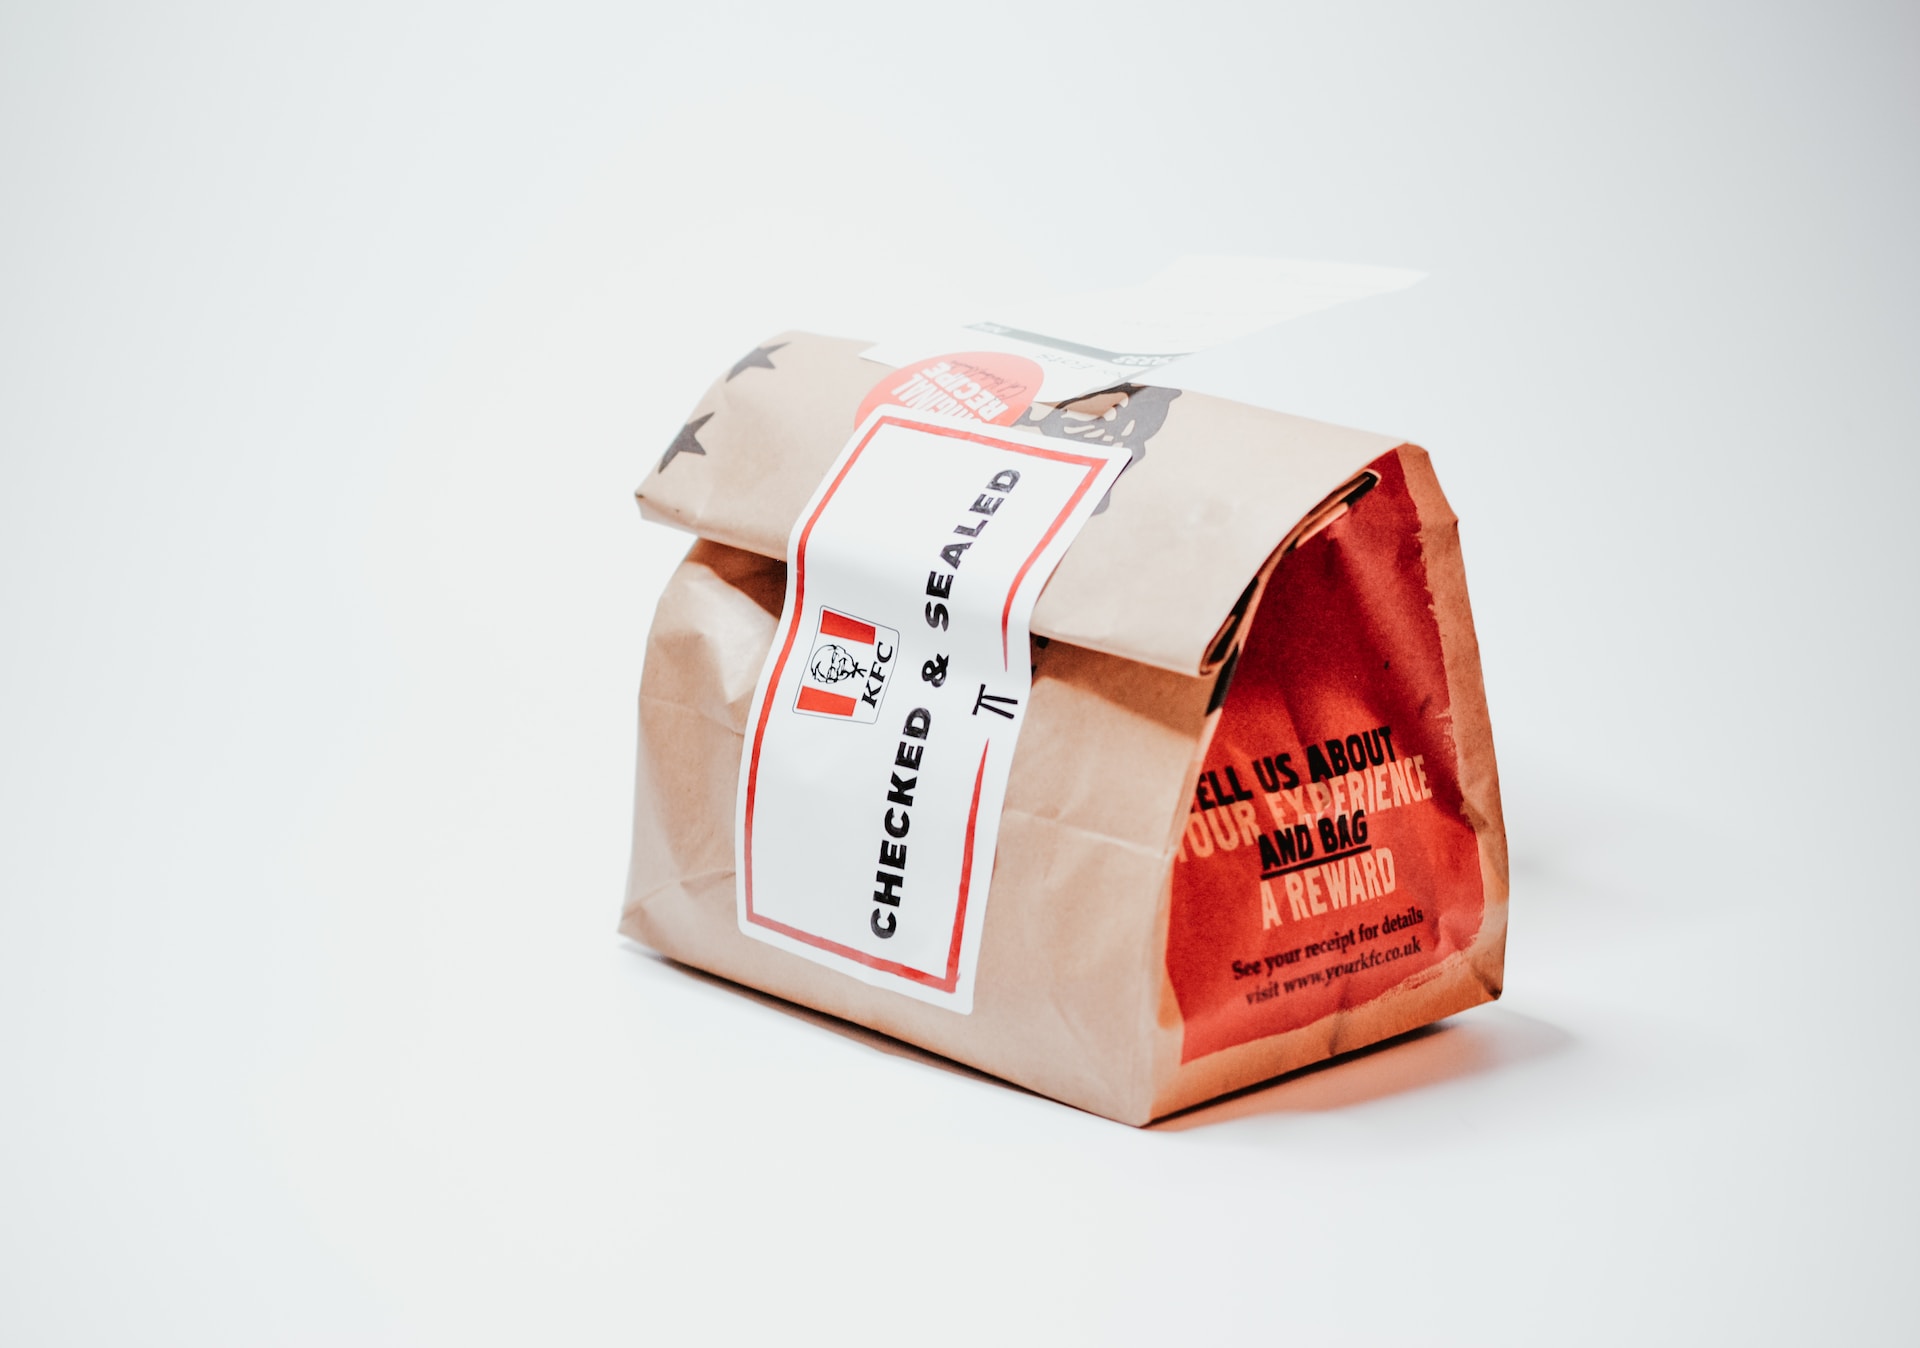
Kentucky Fried Chicken packaged for delivery or pickup

Let’s take a look at the top orders, delivery requests, order combinations, surprising pairings, and more from the 2023 Uber Eats Cravings Report.

It appears that the chicken sandwich dominance we’ve seen over the years is winding down. At least, that seems to be the case among Uber Eats users.

As you’ll see below, not only is the chicken sandwich not the most popular item, it’s not even among the top five. It does edge out the cheeseburger and wings among the most popular combos, but it doesn’t outperform French fries and salt as a combo.

Another eyebrow-raising detail? Pizza doesn’t show up anywhere among the most ordered items, most popular combos, or even the most surprising combos.

Now, if you’re curious about the 2022 Uber Eats Cravings Report, you’re in luck. You can click here for the top food orders from that report, and here for the top beverage orders.

The Most…Ordered Items

  • French fries
  • Garlic naan
  • Pad Thai
  • Miso soup
  • California roll

Am I the only one who expected to see burgers, chicken sandwiches, and pizza on this list?

The Most…Popular Combos

  1. Burrito bowl + cheese
  2. French fries + salt
  3. Chicken sandwich + shredded lettuce
  4. Cheeseburger + mustard
  5. Wings + ranch

Fairly standard, really. Every one of these orders makes complete sense. Now, the category coming up next…it’s a different story.

However, before we move on, let’s compare these items to those found on the 2022 Uber Eats Cravings Report.

Interestingly, the number-one item is nearly identical: burrito + cheese. And French fries + salt is the second most-popular item on both lists.

The Most…Surprising Combos

  1. Steak + jelly
  2. Cottage cheese + mustard
  3. Condensed milk + avocado
  4. Seaweed + pasta sauce
  5. Butter + pickled onions

I really have nothing to say after reviewing this short list. I mean…hey, do your thing, everyone. Make your order yours.

To the operators out there, be ready for some odd order combos.

The Most…Popular Requests

  1. No onions
  2. Dressing on the side
  3. Ranch
  4. Extra soy sauce
  5. Spicy
  6. Sauce on the side
  7. No lettuce
  8. No jalapenos
  9. Extra gravy
  10. No slaw

Looking at the top request, Uber Eats has a theory as to what’s driving it: the return to the office.

People, it appears, are self-conscious about their breath in an in-person, face-to-face setting.

The Most…Popular Food and Alcohol Combos

  1. Ribeye + Vodka
  2. Cheeseburger + Frozen Margarita
  3. Chicken + Frozen Piña Colada
  4. Lobster tail + Apple whiskey
  5. Tamales + Daiquiris

Last year’s report reveals the following combos:

  1. Steak + Margaritas
  2. Pizza + White Claw
  3. Burritos + Margaritas
  4. Chicken + Sangria
  5. Wings + Beer

Overall, a lot of change from the 2022 Cravings Report to this year’s report.

Image: Nik on Unsplash

Bar Nightclub Pub Brewery Menu Development Drinks Food

by David Klemt David Klemt No Comments

Do Super Bowl Ads Work on Consumers?

Do Super Bowl Ads Work on Consumers?

by David Klemt

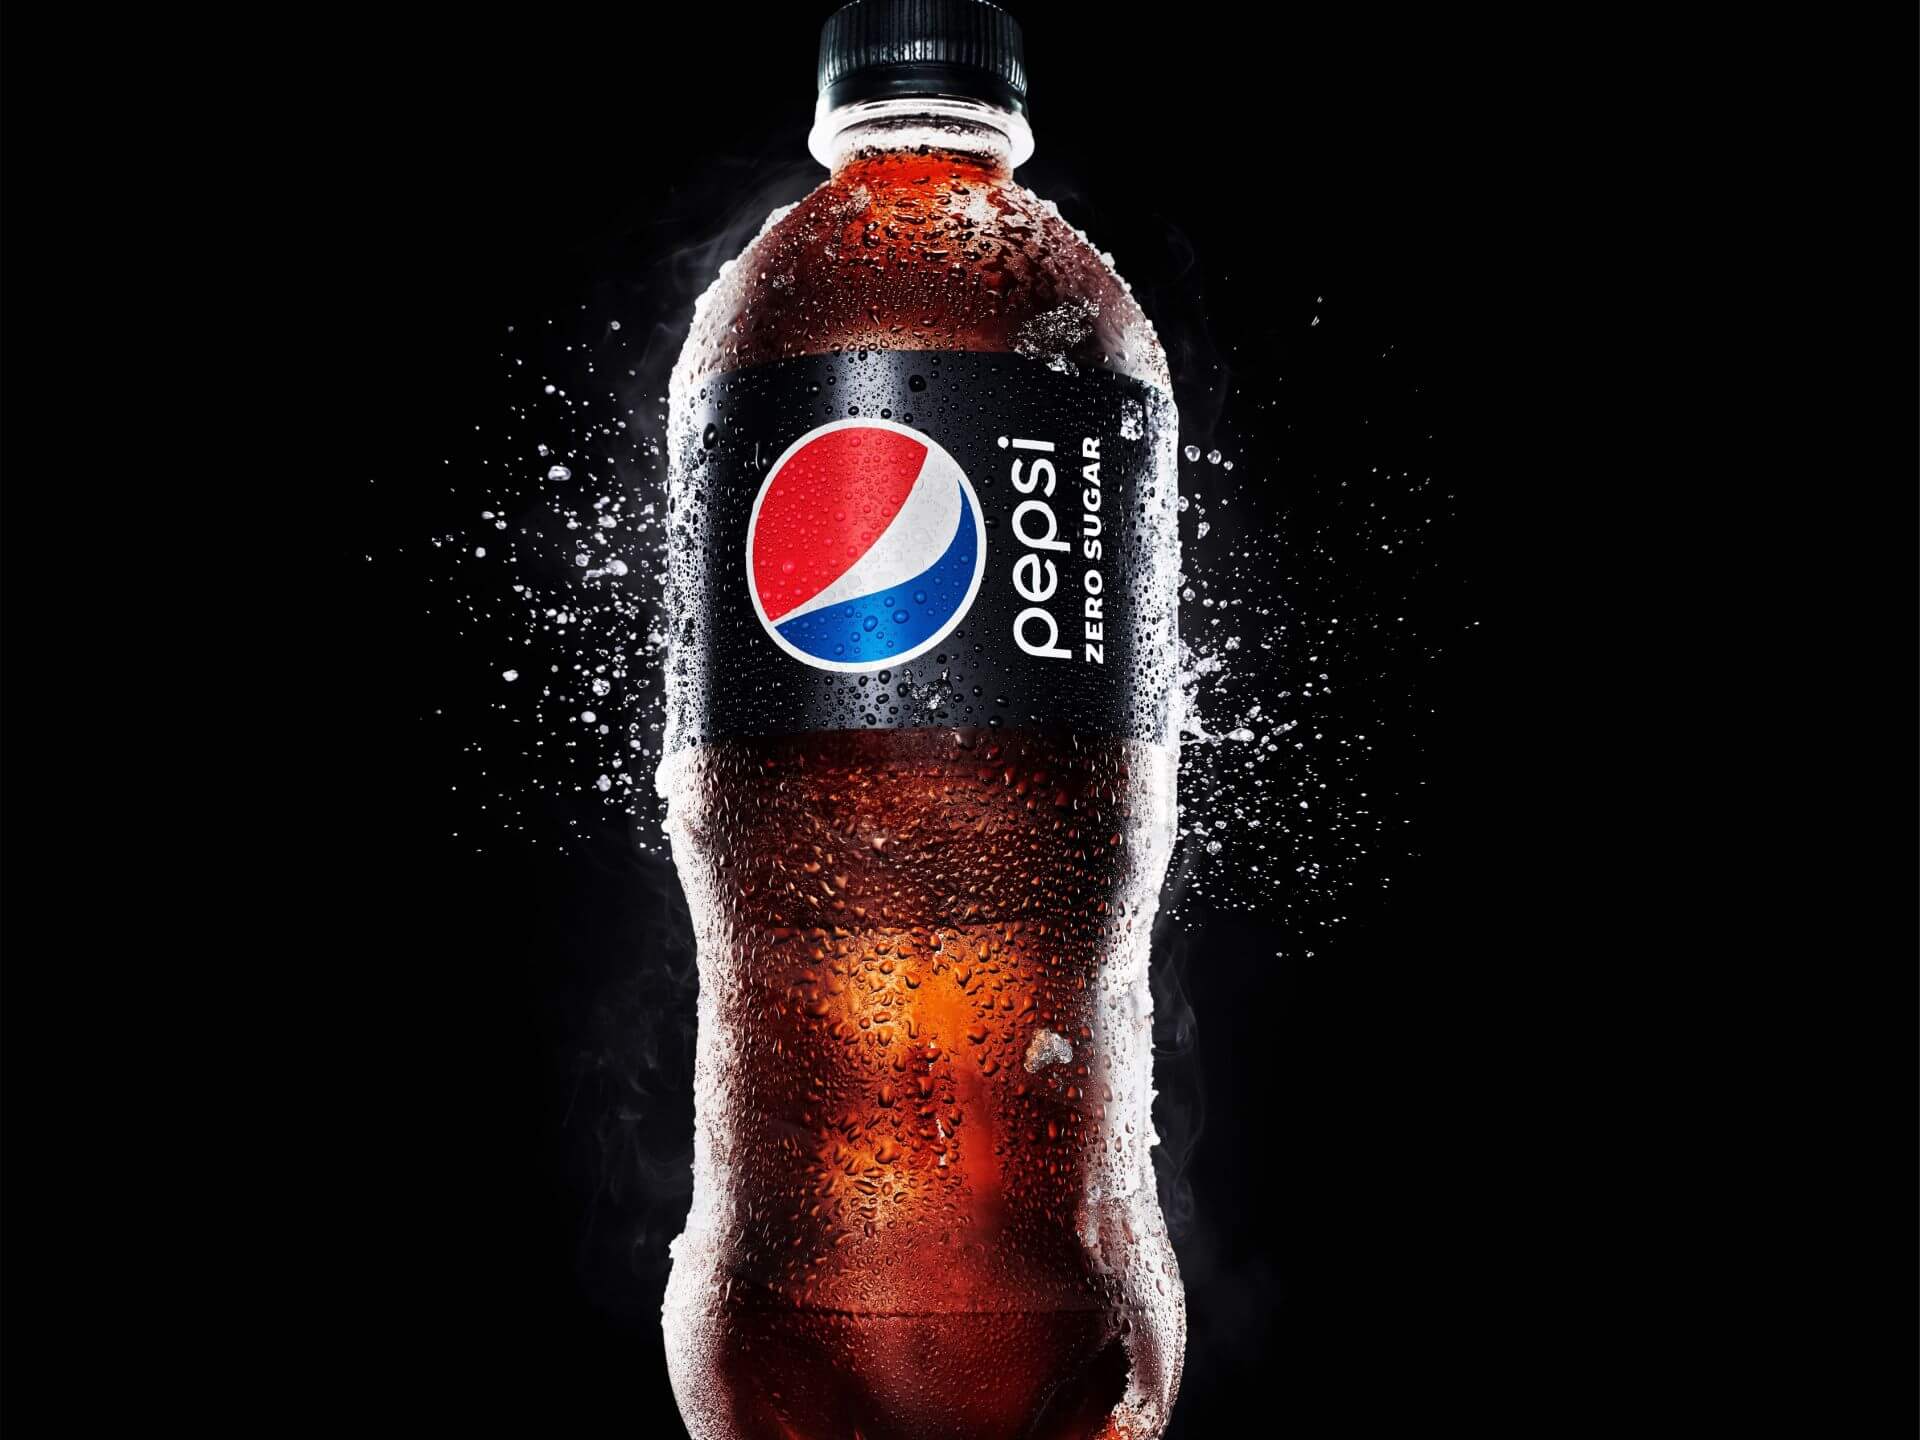
Pepsi Zero Sugar bottle

One of the biggest Super Bowl ad winners is Pepsi Zero Sugar.

Brands spent hundreds of millions of dollars to advertise during Super Bowl LVII, but do their ads actually translate to demand for their products?

A week ago we shared our ten favorite beverage-focused Big Game ads. Along with those ads we shared some numbers.

One of those numbers was $7 million, the cost of a 30-second Super Bowl ad on Fox. Other numbers? $500 million and $700 million, the range of revenue it’s estimated that Fox generated this year from Super Bowl ads.

At this point, these ads and the Halftime Show have essentially become their own entities. Some people watch the Big Game for the ads, some for the show halfway through. It stands to reason that brands are well aware of this development. So, they try to create the most impactful ad possible in the hopes of generating consumer demand.

In other words, these brands aren’t spending all this money just so they’re commercial can be deemed cool. Sure, brands want that buzz. But they also want an ROI on the millions they spend.

The big question is, then, are they seeing a return? Well, it just so happens that behavioral insight platform Veylinx has a data-driven answer to that question.

In short, the answer is yes. Of course, it’s a nuanced yes. For example, it appears Gen Z doesn’t care much about Super Bowl ads, as you’ll see below. Also, non-advertisers in the same categories as Super Bowl advertisers appear to see a benefit from the ads.

You’ll learn more from the Veylinx press release below. It’s an interesting read with valuable data for restaurant, bar, and hotel operators.

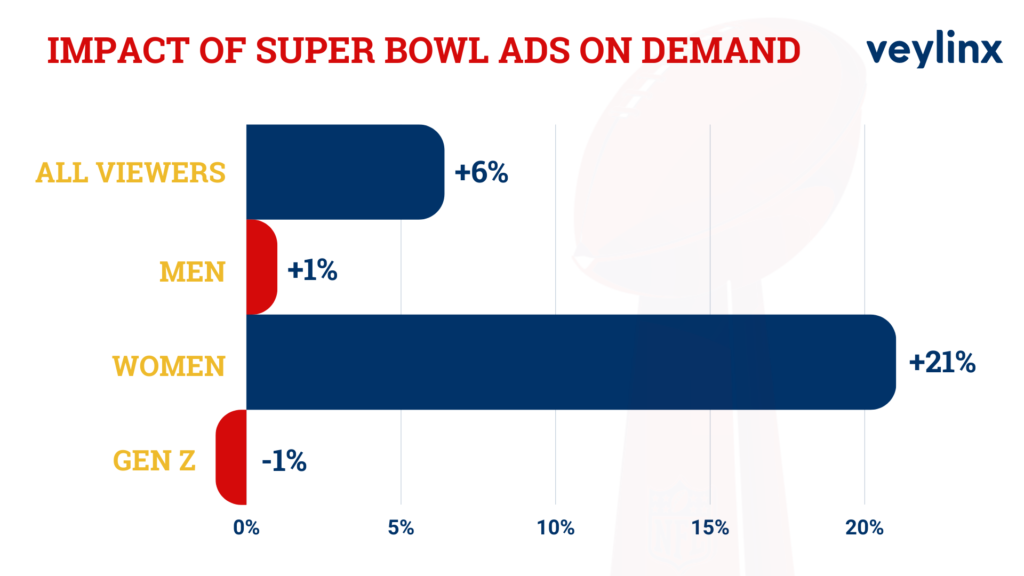
NEW YORK, Feb. 22, 2023 — A new study from behavioral research company Veylinx determined whether or not Super Bowl commercials boost consumer demand for the products advertised. The results show that 2023 Super Bowl advertising fueled a 6.4% increase in demand among viewers.

The overall increase in consumer demand was driven by women, who accounted for a 21% increase in demand growth. The commercials had minimal impact on men, yielding just 1% demand growth for the brands tested. Gen Z viewers were largely unimpressed by the Super Bowl ads, with demand among 18 to 25 year olds actually shrinking by 1%.

2023 Veylinx impact of Super Bowl ads on consumers chart

“It’s not really a surprise to see that Super Bowl ads improve sales, but the short term bump alone may not be enough to justify the $7 million price tag,” said Veylinx founder and CEO Anouar El Haji. 

Using Veylinx’s proprietary methodology—which measures actual demand rather than intent—the study tested purchase behavior during the week before the Super Bowl and again the week after. The research focused on measuring the change in consumer demand for eight brands with Super Bowl ads: Michelob Ultra, Heineken 0.0%, Hellmann’s Mayo, Downy Unstopables, Crown Royal Whisky, Frito-Lay PopCorners, Pringles and Pepsi Zero Sugar. 

Super Bowl Advertising Winners Overall

Michelob Ultra – 19% increase in demand

Pepsi Zero Sugar – 18% increase in demand

Frito-Lay PopCorners – 12% increase in demand

Heineken 0.0% – 11% increase in demand

Super Bowl Advertising Winners Among Women

Pepsi Zero Sugar – 45% increase in demand

Michelob Ultra – 40% increase in demand

Heineken 0.0% – 40% increase in demand

Crown Royal Whisky – 26% increase in demand

Veylinx, top performing brands during 2023 Super Bowl

Halo Effect for Non-Advertisers

The biggest winners were arguably brands in the same product categories as Super Bowl advertisers. Non-advertisers in those categories appeared to benefit nearly as much as the advertisers: demand grew by 4.2% percent for the study’s control group of non-advertising competitors. Corona Extra, Kraft Mayo and Lay’s STAX were the greatest beneficiaries in a control group that also included Budweiser Zero, Arm & Hammer Clean Scentsations, Canadian Club Whisky, Popchips, and Coke Zero Sugar. Notably, every non-advertiser saw at least a slight increase in post-Super Bowl demand.

“The goal of our study was to look specifically at how consumer demand is affected by running a commercial during the Super Bowl,” El Haji said. “It’s possible that the non-advertisers deployed other marketing efforts to offset or take advantage of the Super Bowl advertising—or they simply benefited from increased exposure for their categories.” 

Additional Findings

Study participants also answered a series of follow-up questions about their preferences, perceptions and how they watched the Super Bowl. More than three-quarters watched at home through various platforms, the most popular being the live cable/satellite broadcast (38%), followed by YouTube TV (15%) and Hulu (10%). When asked why they watched, it’s no surprise that participants were all about the game (64%)—but the commercials were the next most popular reason for watching (39%), followed by halftime (35%), the social aspect (26%) and fear of missing out (13%). 

About the Research

Veylinx studied the behavior of 1,610 U.S. consumers pre- and post- Super Bowl LVII. Unlike typical surveys where consumers are simply asked about their purchase intent, Veylinx measures whether consumers will pay for a product through a real bidding process. Consumers reveal their true willingness to pay by placing sealed bids on products and then answering follow-up questions.

For more information about the study and the Veylinx methodology, visit info.veylinx.com/super-bowl

About Veylinx

Veylinx is the most realistic behavioral insights platform for confidently answering critical business questions during all stages of product innovation. To reliably predict demand, Veylinx captures insights through a Nobel Prize-winning approach in which consumers have real skin in the game. This is a major advance from traditional market research practices that rely on what consumers say they would hypothetically buy. Veylinx’s unique research methodology is trusted by the world’s largest and most innovative consumer goods companies.

Main article image: PepsiCo / Article body images: Veylinx

KRG Hospitality Bars & Lounges, 2023 icon

by David Klemt David Klemt No Comments

Global Trends 2023: Technomic

Global Trends 2023: Technomic

by David Klemt

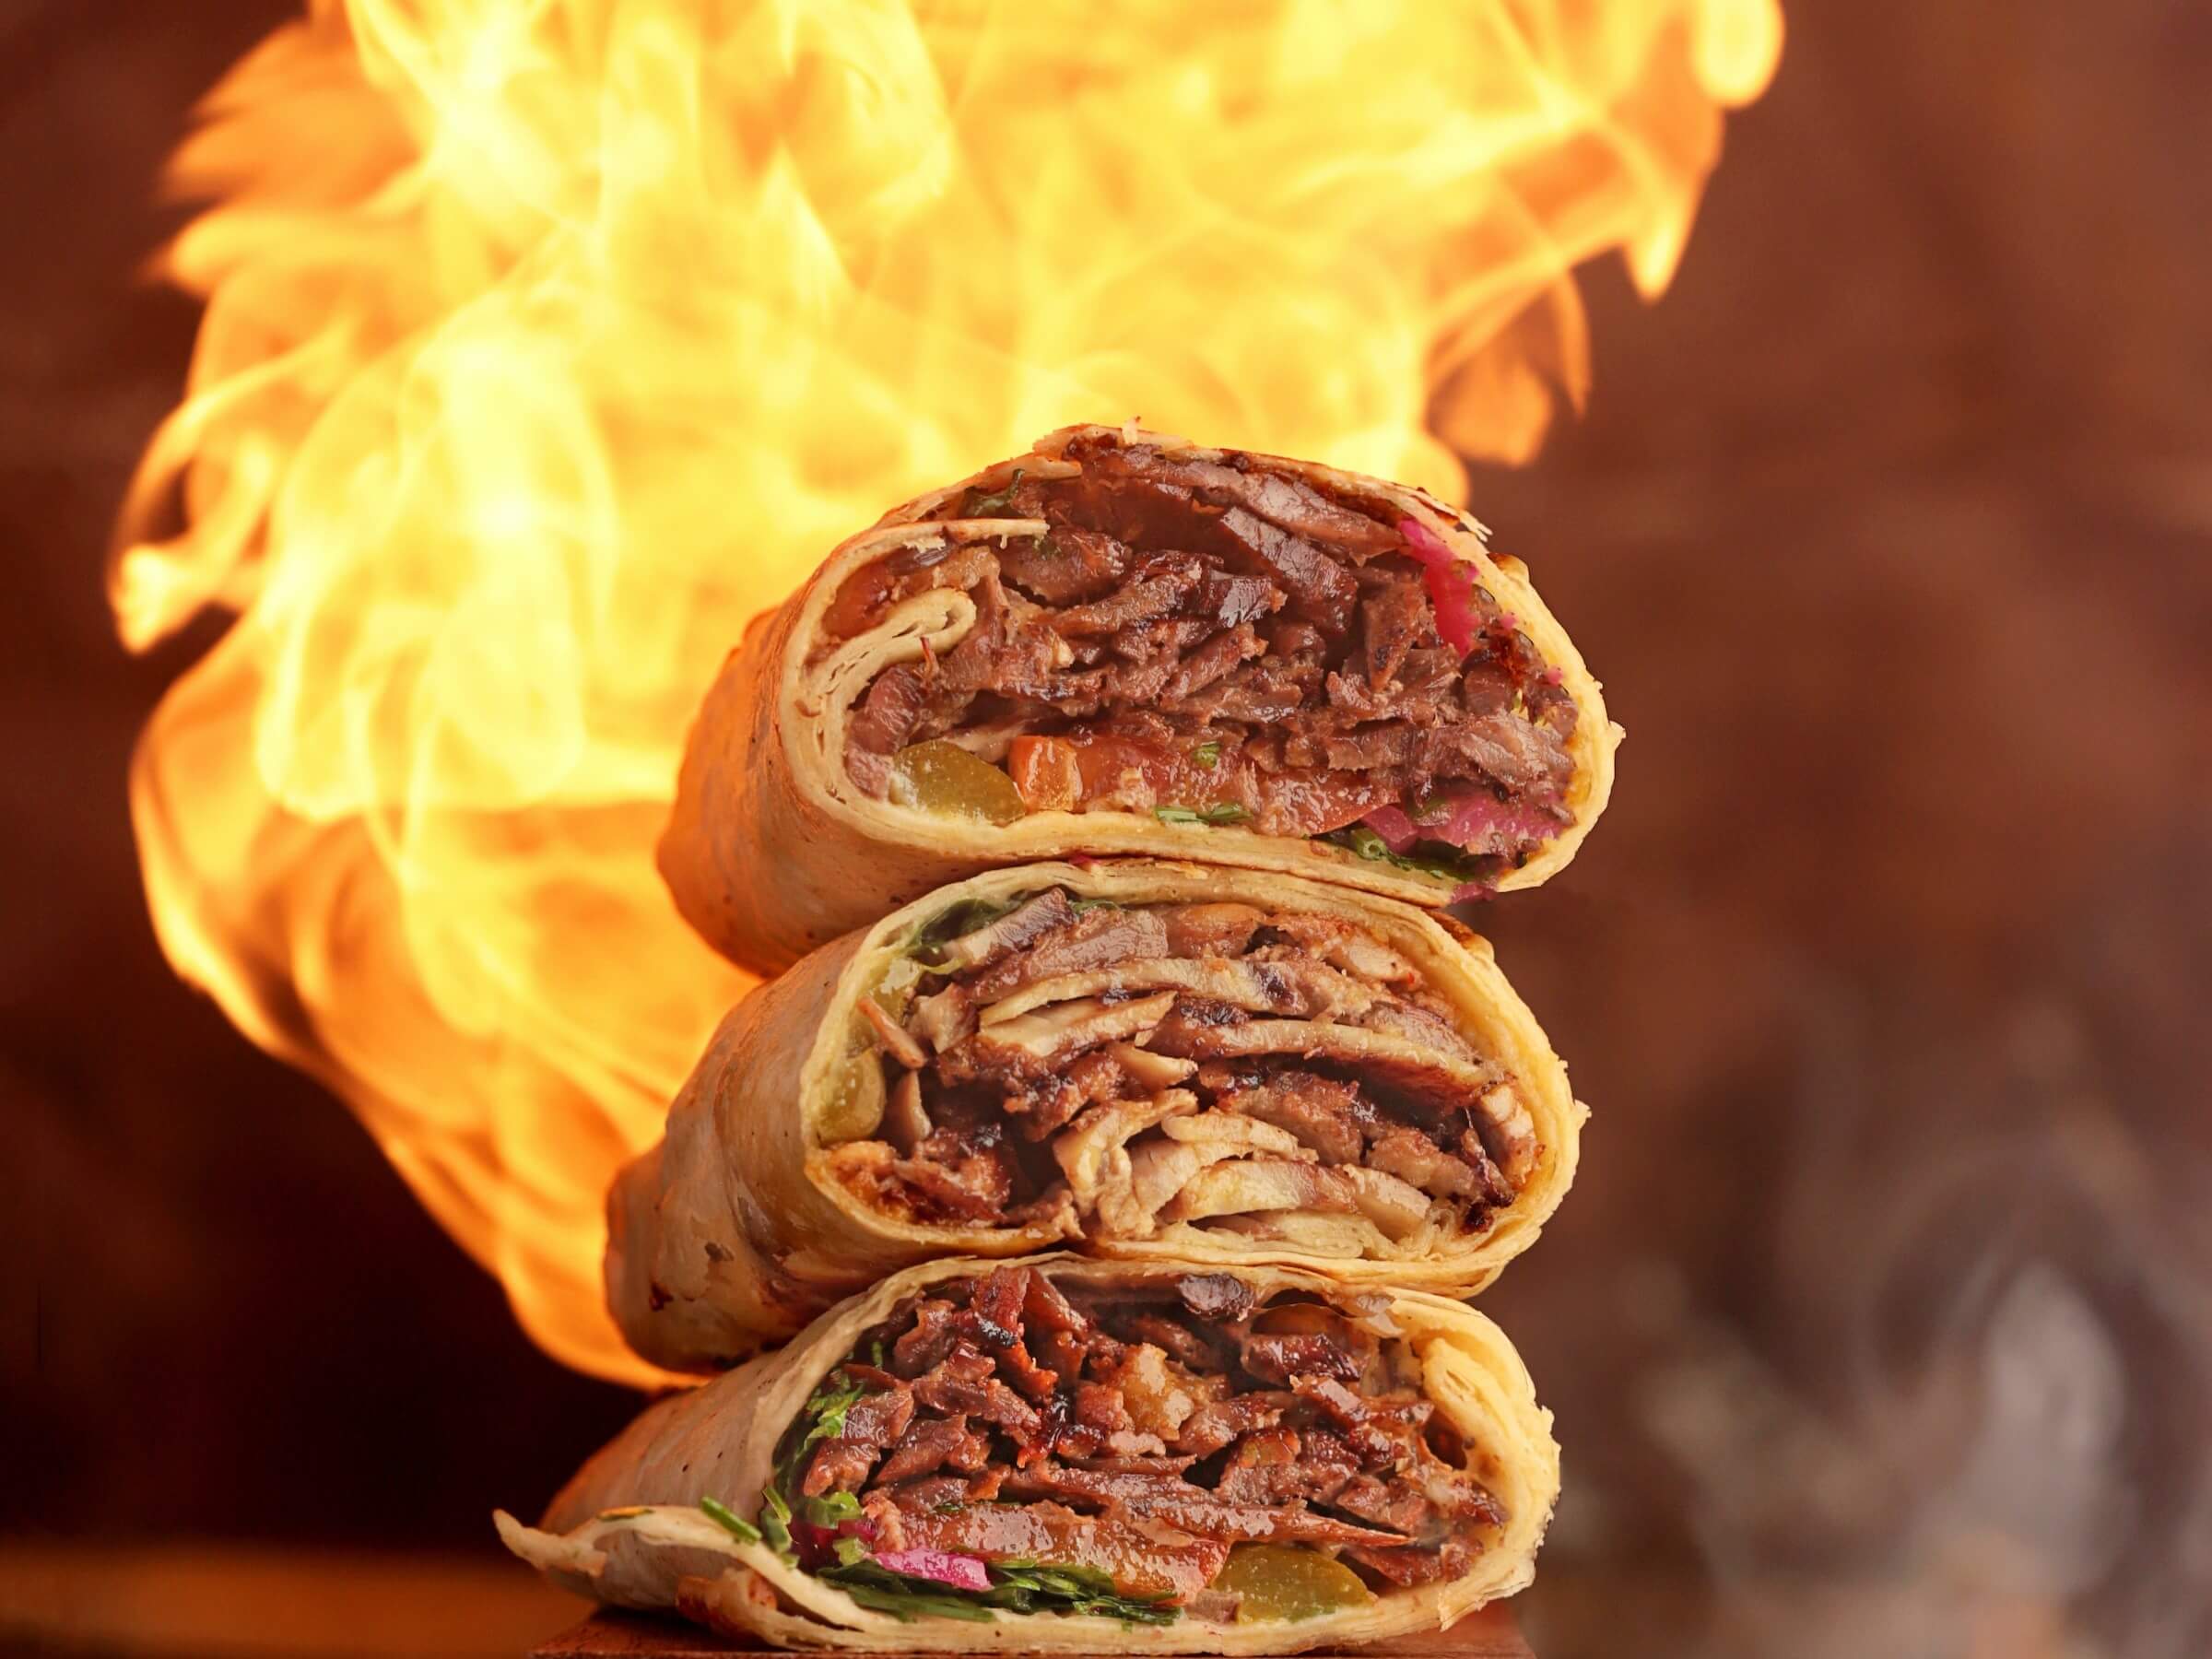
Shawarma stacked with fire in the background

Not content to focus solely on North America, foodservice research firm Technomic is predicting foodservice trends that will span the globe in 2023.

As the firm points out themselves, making predictions is a best-guess proposition. Many of Technomic’s 2022 predictions for Canada, the USA, and the globe have proven true. However, a handful of their trend predictions have yet to manifest.

Further, not all trends will work for all operators and their concepts. Chasing every passing fad or trend is great if you like to watch your costs spiral. Doing so is also an excellent way to confuse guests and stress staff.

So, when considering any trend, make sure it works with your concept, has some staying power, and will resonate with your guests. Speaking to that last point, this is one reason it’s crucial to collect guest data. Making important menu and guest-impacting operational decisions without data just doesn’t make sense.

When you’re done with this article, take a look at our examination of Technomic’s other predictions. The firm’s Canadian predictions are here. And you can read the American trends by clicking this link.

For your own copy of Technomic’s international trends report, click here.

Operations

For 2023, Technomic is making predictions that certainly appear plausible. A number of them pertain to operations.

Kicking things off, sustainability. Driven in part by the global impact of the pandemic, the health of our planet is top of mind for many people.

For example, Canada’s single-use plastics ban is now in effect. England plans to move forward with a similar ban by October of this year.

Alongside such bans, Technomic believes operators—small independents and global chains alike—will implement entire sustainability strategies. These will range “from packaging and restaurant operations to marketing and menu development.”

Does your concept have a dedicated pickup window? Perhaps a takeaway counter? Maybe even a drive-thru? If not, 2023 may be the year you make that change. Not only that, you’ll likely want to position them front and center.

Per Technomic, many consumers are done with delivery. From rising costs outweighing convenience to delivery failures, pickup may become more appealing. Pickup is still convenient, it’s less expensive, and the consumer is in control.

Additionally, many people are well aware of how costly third-party platforms are to operators. In fact, Technomic identifies these platforms and their fees as “the biggest industry villain” of 2023.

Menu

One of Technomic’s predictions is particularly enticing: Lebanese street foods. To clarify, the firm believes all manner of street foods from around the globe will perform well in 2023.

However, they feel Lebanon’s street foods will stand out from the rest. So, think shawarma, labneh, kibbe, and pickled vegetables. That last item, by the way, follows Technomic’s prediction that pickling and fermenting will be hot trends in the US and Canada.

Of course, there are other items that Technomic thinks will shine in 2023. If the firm is correct, there’s a new “holy trinity” to keep an eye on and consider for your menu: sushi, poke, and ceviche. According to Technomic, each performs very well when it comes to takeout.

Interestingly, the research firm suggests that this particular holy trinity will spawn new virtual brands. If Technomic’s predictions prove accurate, some of these brands will focus on fried chicken or plant-based versions.

Speaking to that last point, Technomic is predicting that plant-based will “evolve” in 2023. This evolution will focus on more traditional meat counterparts. Providing examples, Technomic suggests that avocado, modern takes on black bean patties, cauliflower, tofu, tempeh, and seitan will be this year’s plant-based rock stars.

Are this year’s 2023 Technomic predictions going to prove accurate? It’s far too early to tell. However, one thing I can say with confidence is this: their predictions are rooted deeply in data. When Technomic makes a “guess,” it’s always an informed one.

Click here to read Technomic’s report in its entirety.

Image: Slashio Photography on Unsplash

KRG Hospitality Restaurants & Cafes, 2023 icon

by David Klemt David Klemt No Comments

American Trends 2023: Technomic

American Trends 2023: Technomic

by David Klemt

Pink pineapple against pink background

Foodservice research firm Technomic has some interesting predictions for the hospitality industry in the United States of America this year.

On the topic of operations, Technomic foresees more negotiating power among workers. Additionally, the firm looks at both the economy and pent-up guest demand.

When it comes to food, the US and Canada have a trend prediction in common. And as the image atop this article signifies, a particular color may be a hit on menus in 2023.

Before we jump in, Technomic’s 2023 Canadian trend predictions are here. Last year’s Technomic predictions for America are here. Curious readers can review the firm’s 2023 predictions in their entirety here.

Okay, let’s go!

Think Pink

I want to address this prediction first. According to Technomic, pink is going to be the F&B color of 2023.

As they explain, the color is fun, nostalgic, and photogenic. Yes, operators must still consider the Instagram-worthiness of their menu items. That may change one day, but it’s not today.

Per Technomic, pink also signals that a food or drink may have antioxidants.

Some of the items the research firm names specifically: pink pineapple, pink salt, pink celery, cara cara oranges, and schisandra berries.

Pickle It

This is the culinary trend that, per Technomic, Canada and America will share in 2023.

Along with fermenting, pickling gives the kitchen and bar teams a unique experimentation method to explore. So, encourage these teams to get creative and add pickling and fermentation to your next menu update.

Of course, that’s not the only reason to consider putting pickling front and center. For many, these preparations indicate a healthy F&B choice. Think kombucha, as an example.

As we know, healthy choices continue to be top of mind for many guests.

One more note: Technomic suggests being transparent and identifying the pickling and fermenting processes your team leverages to produce each menu item.

Economics

For those looking for a bit of optimism in these trying times, Technomic may have what you’re looking for. This year’s report, What We Foresee for 2023, says the following about the possibility of a recession:

“There is reason for optimism in the coming year, however, as any recession is expected to be relatively mild.”

Yes, that’s just one source’s opinion. However, Technomic is known for their voraciousness when it comes to data. So, if this firm is optimistic it could be a solid sign that things are looking up in 2023.

“Pent-up consumer demand” and variations thereof have been making the rounds since 2o21. However, it’s still a relevant phrase.

As it pertains to 2023, Technomic believes on-premise dining may “bounce back” this year. In fact, the firm suggests that people want to socialize and dine in person now more than ever.

Also, delivery and pickup times appear to be growing. So, plenty of people will see in-person dining as the more appealing option in 2023.

Operations

In part due to legislation addressing minimum wage and workplace conditions, employees may have the upper hand this year.

Add the fact that many people seeking work know many operators are dealing with a labor shortage and their negotiating position looks even stronger.

So, we could finally be in for a significant change when it comes to how the industry looks at compensation. More and more workers—and the guests they serve—are taking issue with tipping. Instead, many people outside and inside of the industry want to see operators pay staff a competitive, living wage.

Of course, there are also the hospitality professionals who prefer tips to minimum wage. In 2023, the industry could experience the start of a sea change. Time will tell.

For more predictions and this Technomic report in its entirety, please click here.

Image: Alex Gruber on Unsplash

by David Klemt David Klemt No Comments

What Consumers Expect from Delivery

What Consumers Expect from Delivery

by David Klemt

Delivery or takeout food order in brown paper bag

Consumers are developing specific behaviors and opinions regarding delivery that impact their perception of restaurants and brands.

Over the course of two years and three surveys, Deloitte has attempted to learn more about consumers and delivery.

In total, Deloitte surveyed 1,550 restaurant customers. Additionally, the multinational interviewed highly positioned executives from ten casual, fast-casual, and QSR brands.

What Consumers Want

First, it should come as no surprise that delivery is here to stay. None of Deloitte’s survey results indicate otherwise.

In fact, it appears that some consumers are showing an interest in additional delivery methods. Half of survey respondents are willing to try driverless or drone delivery.

More than half—64 percent—don’t expect to return to pre-pandemic dining habits by March of this year. Illustrating the habit of ordering takeout and delivery, 61 percent of respondents engage with restaurants that way at least once per week. That represents a 32-percent increase from June 2020 to September 2021.

When dining off-premise, 57 percent of Deloitte survey respondents prefer to place orders via an app. However, 40 percent of respondents prefer a restaurant’s own branded website or app. That shows that:

  1. A restaurant’s website matters. A significant percentage of consumers want to get information, get a feel for a restaurant, and place orders with a business directly.
  2. Direct delivery is feasible. Consumers want to know and feel as though they’re supporting a restaurant directly rather than a third-party business.

Own the Delivery Experience

Of course, quality is a concern with consumers who place delivery orders. This points to another pitfall regarding third-party delivery beyond the fees.

Unfair as it is, three out of five restaurant customer survey respondents have quality expectations. Specifically, they expect the same food experience off-premise as they receive on-premise. That means the same quality and the same freshness.

They also indicate that wait times of up to 30 minutes are acceptable. Here’s where the risk to restaurants comes into play. Consumers will fault the restaurant for late orders; cold food (or melted or room-temperature food for cold items); iced drinks becoming watered down; and other order issues even if they’re delivered by third-party services.

So, operators must look into and invest into what they can to improve the quality of delivery orders. Containers that keep hot food hot, French fries and other fried foods crisp, and cold foods cold are paramount.

Unfortunately, problems that occur after an order has left a restaurant—which are out of the business’ hands—are often attributed to the venue. Another reason, then, to consider and implement direct delivery.

Image: Yu Hosoi on Unsplash

by David Klemt David Klemt No Comments

Square: 2022 Threats & Opportunities

Square: 2022 Threats & Opportunities

by David Klemt

Square terminal in restaurant kitchen

As all hospitality professionals know, the past nearly two years is imposing rapid change on the industry, necessitating rapid, strategic adaptation.

The key word in the above sentence isn’t “adaptation,” it’s “strategic.”

Of course, it’s hard to make strategic choices without as much information as possible.

To that end, we’ve reviewed Square‘s recently released “Future of Restaurants: 2022 Edition.” This is the company’s second annual Future of Restaurants report.

Square partnered with Wakefield Research, surveying 500 operators and 1,000 consumers to identify 2022 threats and opportunities.

Threat: Labor Shortage

Most operators aren’t going to want to read this prediction from Square. However, we can’t identify and adapt for opportunities if we don’t acknowledge threats.

Per Square’s report, the labor shortage may never see a correction. In other words, welcome to yet another new normal.

More than 70 percent of operators say they’re facing a labor shortage, per Square. Just over 20 percent of available positions were, at the time the survey was conducted, unfilled.

Instead, operators will likely, according to Square, need to make operational and work culture changes:

  • Improve working conditions. For example, encouraging and acting on team feedback. Another example? Modernizing scheduling.
  • Ensure workers are being mentored and not simply managed.
  • Hire, train, assign tasks, and schedule more strategically to operate with a smaller team.
  • Offering incentives that entice higher-quality candidates to work for you.

One participant quoted in the Square report claims that QR code ordering dropped their labor cost percentage by 150 percent.

Threat: Lack of Tech

As SevenRooms suggested when looking forward to 2022, technology solutions can lessen the burden of labor shortages. That leads us to another big threat: failing to embrace tech.

Some operators bristle at the word “automation.” For many, it conjures an image of robots in the kitchen and delivering food to tables.

Obviously, we’re opposed to replacing staff with any form of automation. However, we support automating tasks if that means team members are better utilized.

Why not automate inventory? Why not automate online order filling? If it improves operations and the guest experience, automation is less threatening.

According to Square’s report, 62 percent of operators think automation is appealing for managing online, delivery, and contactless orders. Ninety percent of operators say that back-of-house automation—if staff can focus on more important tasks—is a good idea.

More than 90 percent think automated inventory is an appealing solution.

It has taken a lot of time for hospitality to catch up to other industries in embracing tech. But Square reports that 36 percent of restaurants upgraded their business tech in 2021.

Of course, automation will become a threat if operators lean too heavily into it and stop paying attention to detail.

Phrased another way, be tech-savvy, not tech-reliant.

Opportunity: Omni-channel

Square see implementing an omni-channel strategy as the way forward. In fact, their general manager for Square Restaurants, Bryan Solar, said the following:

“We see the time of the dine-in only or takeout only as largely done forever.”

Going omni-channel (diversifying) in the restaurant space means making online ordering and delivery important elements within the overall business strategy. To that end, Solar posits kitchens will grow in size to better handle online orders.

Square’s survey reveals some intriguing numbers:

  • 13 percent of consumers say they’ll avoid restaurants that don’t offer online ordering.
  • Among restaurants with online ordering, those channels generate 34 percent of their revenue.
  • Over the past year, 54 percent of restaurants either added or expanded online ordering channels.
  • Online ordering is likely here to stay: 69 percent of respondents plan to offer it post-Covid-19.
  • 24 percent of operators are planning to allow guests to order alcohol from them online.

Another interesting set of numbers pertains to first- and third-party delivery. As we’ve stated several times, we much prefer operators offer first-party or direct delivery. According to Square, 49 percent of operators plan go direct delivery. More than half—62 percent—will pursue third-party delivery. That suggests that some operators will offer both.

Opportunity: Direct Ordering

When it comes to engaging online guests, operators need to control the experience. As I wrote for another publication years ago, a restaurant or bar’s website is still very important.

This statistic proves that statement true: Per Square, 68 percent of online guests want to order via a restaurant’s website or app, not a third-party.

More than likely, a significant portion of those guests want to know they’re supporting a restaurant and its staff directly. Hence the importance placed on ordering via the website or their own branded app.

So, operators would do well to ensure their websites feature an ordering widget. Or, they can opt to have an app built (or at least skinned) for their business.

Opportunity: Kiosks

According to Square’s survey results, 79 percent of consumers prefer ordering from kiosks over ordering from staff.

Most consumers and operators likely associate ordering kiosks with fast food restaurants. However, other categories can also benefit from these devices.

Close to half—45 percent—identified it as a preference when ordering at a casual-dining restaurant.

And fine dining isn’t immune to the convenience of tech. A little over 20 percent of consumers prefer to order via kiosk in the fine-dining space.

Overall, kiosks speak to the guest desires for convenience and safety. More than a third indicated that ordering via digital menu is appealing because they don’t have to touch a menu someone else has touched. And 37 percent like a digital option because they don’t have to wait for a server to bring them a physical menu.

Eleven percent of Square survey respondents will avoid a restaurant if they don’t offer digital menus.

Nearly half (45 percent) of restaurants are planning to offer QR code menus post-Covid-19. Another benefit of digital menus is dynamic pricing. As costs fluctuate, operators can increase or reduce prices easily without printing new menus.

Outlook

Representing a stark contrast from 2020 survey results, nearly 60 percent of operators say the survival of their restaurants is a concern in 2022.

That’s still a high number but vastly lower than how operators answered about 2021. Last year, 92 percent of operators surveyed said they were worried about survival.

According to Square’s report, operators are looking past surviving and making long-term plans. That’s a welcome sign that confidence is improving.

To review Square’s “Future of Restaurants: 2022 Edition” report in its entirety, click here.

Image: Patrick Tomasso on Unsplash

Top