Notice: Function _load_textdomain_just_in_time was called incorrectly. Translation loading for the smart-post-show-pro domain was triggered too early. This is usually an indicator for some code in the plugin or theme running too early. Translations should be loaded at the init action or later. Please see Debugging in WordPress for more information. (This message was added in version 6.7.0.) in /var/www/wp-includes/functions.php on line 6114
Site selection | KRG Hospitality

Site selection

by David Klemt David Klemt No Comments

Top 10 US Metro Areas by Inflow, Q3 2022

US Metro Areas with Greatest Outflow and Inflow, Q3 2022

by David Klemt
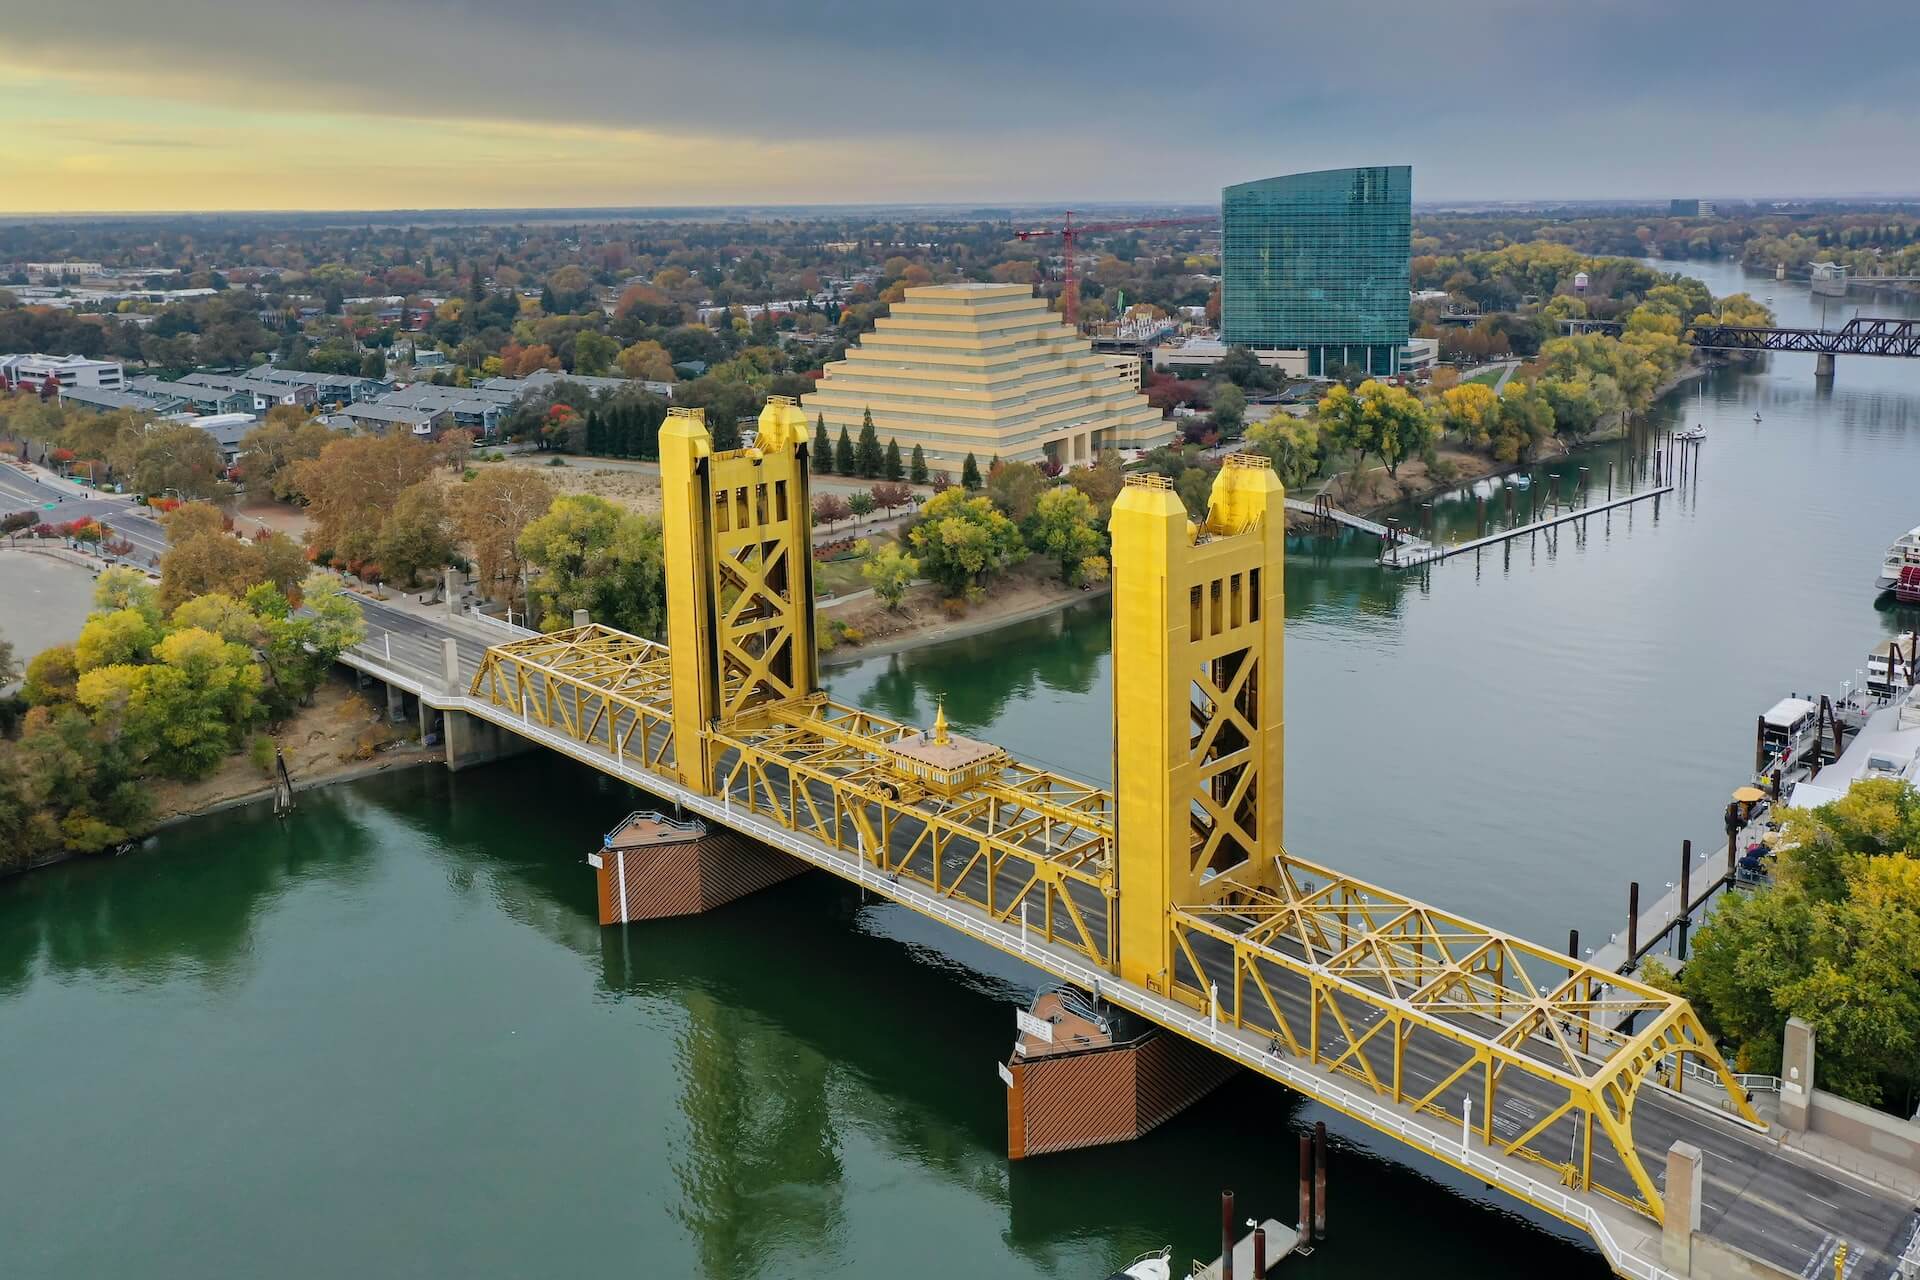
Tower Bridge in Sacramento, California

Real estate brokerage Redfin identifies the top ten American cities in terms of inflow and outflow, according to Q3 data.

Interestingly, a quarter of people appear to be searching for homes in cities different from where they currently live. Also compelling: one state, per the brokerage’s data ending in the month of October, is a clear favorite.

Obviously, this is important data for operators to have. When it comes to labor and guest pool changes, inflow and outflow information can be quite useful.

Top Inflow Cities: August to October 2022

Review the list below to see the metro areas experiencing the greatest inflow.

  1. Orlando, Florida
  2. Dallas, Texas
  3. North Port, Florida
  4. Cape Coral, Florida
  5. Phoenix, Arizona
  6. Tampa, Florida
  7. San Diego, California
  8. Miami, Florida
  9. Las Vegas, Nevada
  10. Sacramento, California

Did you spot the big trend? The state of Florida represents 50 percent of the list. Per Redfin‘s interpretation of the data, home buyers want leave expensive coastal cities behind.

Interesting to us in particular, two cities—Las Vegas and Orlando—are key KRG Hospitality markets. Also interesting is that Nevada and Florida are on the back half of Forbes’ best cities for starting a business in 2023.

However, we’ve seen strong hospitality industry recovery in Las Vegas this year. In fact, even the entertainment industry in Las Vegas is exploding. Additionally, we continue to gain clients in Orlando.

Top Outlow Cities: August to October 2022

Below are the metro areas seeing the greatest outflow.

  1. Philadelphia, Pennsylvania
  2. Seattle, Washington
  3. Denver, Colorado
  4. Detroit, Michigan
  5. Chicago, Illinois
  6. Boston, Massachusetts
  7. Washington, DC
  8. New York, New York
  9. Los Angeles, California
  10. San Francisco, California

If we compare Redfin’s Q2 data to the list above, it’s mostly the same. In fact, the top four outflow cities are identical. Spots five through nine are simply a reshuffling of Q2 and Q3 data.

However, Minneapolis, number ten in Q2, is replaced by Philadelphia in Q3. According to Redfin data, those Philly residents searching for homes elsewhere are showing interest in Salisbury, Maryland.

Consider how expensive it can be to move to and live in LA and San Francisco. It makes sense that California is the only state with two cities on the list above, doesn’t it?

Per Redfin, San Francisco residents are searching Sacramento and Seattle. Those in LA are looking at San Diego and Las Vegas.

Takeaway

It’s important to know where people are moving to and what cities they’re leaving behind. And it’s interesting to get a data-driven view of which states may be best for starting a business.

However, it’s far more useful to know how feasible a given ZIP code may be for a specific concept. So, while these types of lists are helpful, they’re not as practical as a targeted feasibility study.

Moreover, the dust doesn’t appear to have settled when it comes to migratory patterns of home buyers. It’s quite possible that Redfin’s 2023 inflow and outflow data will change once again in Q1 and Q2.

Image: Stephen Leonardi on Unsplash

by David Klemt David Klemt No Comments

The Most-stressed Cities in the US

These are the Most-stressed Cities in the US

by David Klemt

Deflated smiley face balloon in street

There’s a simple argument to be made that one characteristic the happiest cities share is being among the least stressful to live.

Yesterday we took a look at the happiest cities in the US, according to WalletHub analysis. Click here in case you haven’t yet read that article.

Today, let’s check out the most- and least-stressed cities in America. As with their happiest and least-happy cities list, WalletHub ranks 182 cities based on stress levels.

Of course, “least stressed” doesn’t mean “stress-free.” Nor should it—some stress is good for us. After all, stress can push us to perform our best, bring out our problem-solving creativity, and even energize us.

The rankings below may surprise you. Like me, you may even find yourself raising an eyebrow and disagreeing with some of them.

However, it’s a compelling list worth reviewing if you’re an operator, leadership team member, hospitality professional, or in the site-selection portion of opening a restaurant or bar.

The Top 25 Cities of Stress

When determining their results, WalletHub ranked 182 cities according to four main categories. Those categories are: work stress; financial stress; family stress; and health and safety stress. The categories consist of 40 key metrics in total.

I think it’s safe to assume that no city wants to be in the top 25 of this list, or even the top 50. Neither, I’m certain, does any city want to wear the crown of “Most Stressed US City.”

Unfortunately, someone must be number one. Below, the top 25 “Cities of Stress,” per WalletHub:

  1. Cleveland, Ohio
  2. Detroit, Michigan
  3. Gulfport, Mississippi
  4. Baltimore, Maryland
  5. Philadelphia, Pennsylvania
  6. Memphis, Tennessee
  7. New Orleans, Louisiana
  8. Birmingham, Alabama
  9. Louis, Missouri
  10. Toledo, Ohio
  11. Augusta, Georgia
  12. Jackson, Mississippi
  13. North Las Vegas, Nevada
  14. San Bernadino, California
  15. Fayetteville, North Carolina
  16. Akron, Ohio
  17. Wilmington, Delaware
  18. Houston, Texas
  19. Montgomery, Alabama
  20. Shreveport, Louisiana
  21. Cincinnati, Ohio
  22. Newark, New Jersey
  23. Mobile, Alabama
  24. Columbus, Georgia
  25. Indianapolis, Indiana

Alas (I don’t get to use this word much), Ohio has four cities on this list. In fact, the Buckeye State has two cities in the top ten.

Of course, Ohio isn’t the only state with multiple cities in the top 25 stressed cities. Alabama has three cities among the top 25. Also, Mississippi and Louisiana each have two cities on this part of the list, unfortunately.

Cities 26 Through 91

As you’ll see below, Ohio shows up a couple of times in this portion of the list. However, so do a handful of other states.

For example, ten Texas cities land on this part of the list. That means Texas has 11 cities among the “top” half of the most-stressed US cities.

  1. Baton Rouge, Louisiana
  2. Las Vegas, Nevada
  3. Huntington, West Virginia
  4. Springfield, Missouri
  5. Dover, Delaware
  6. Norfolk, Virginia
  7. Milwaukee, Wisconsin
  8. Chicago, IL
  9. Newport News, Virginia
  10. Washington, DC
  11. Dallas, Texas
  12. Richmond, Virginia
  13. Tulsa, Oklahoma
  14. Chattanooga, Tennessee
  15. Bridgeport, Connecticut
  16. San Antonia, Texas
  17. Atlanta, Georgia
  18. Glendale, Arizona
  19. New York, New York
  20. Tucson, Arizona
  21. Columbia, South Carolina
  22. Columbus, Ohio
  23. Knoxville, Tennessee
  24. New Haven, Connecticut
  25. Brownsville, Texas
  26. Rochester, New York
  27. Casper, Wyoming
  28. Vancouver, Washington
  29. Oklahoma City, Oklahoma
  30. Jacksonville, Florida
  31. Corpus Christi, Texas
  32. Charleston, West Virginia
  33. Henderson, Nevada
  34. Phoenix, Arizona
  35. Modesto, California
  36. Wichita, Kansas
  37. Winston-Salem, North Carolina
  38. Little Rock, Arkansas
  39. Moreno Valley, California
  40. Louisville, Kentucky
  41. Stockton, California
  42. Spokane, Washington
  43. Fresno, California
  44. Miami, Florida
  45. Kansas City, Missouri
  46. El Paso, Texas
  47. Salem, Oregon
  48. Hialeah, Hawaii
  49. Los Angeles, California
  50. Fort Smith, Arizona
  51. Fort Worth, Texas
  52. Denver, Colorado
  53. Arlington, Texas
  54. Buffalo, New York
  55. Greensboro, North Carolina
  56. Bakersfield, California
  57. Fort Wayne, Indiana
  58. Providence, Rhode Island
  59. Tacoma, Washington
  60. Port St. Lucie, Florida
  61. Lewiston, Maine
  62. Laredo, Texas
  63. Cape Coral, Florida
  64. Grand Prairie, Texas
  65. Garland, Texas
  66. Aurora, Colorado

Cities 92 Through 137

This is where things begin to turn around, at least mathematically. This is the “bottom” half of the list.

Or, to phrase it another way, this section starts identifying the least-stressed cities in America.

  1. Portland, Oregon
  2. Ontario, California
  3. Lubbock, Texas
  4. Reno, Nevada
  5. Huntsville, Alabama
  6. Sacramento, California
  7. Amarillo, Texas
  8. Albuquerque, New Mexico
  9. Tampa, Florida
  10. Long Beach, California
  11. Colorado Springs, Colorado
  12. Fontana, California
  13. Tallahassee, Florida
  14. Las Cruces, New Mexico
  15. Worchester, Massachusetts
  16. Orlando, Florida
  17. West Valley City, Utah
  18. Fort Lauderdale, Florida
  19. Peoria, Arizona
  20. Riverside, California
  21. Mesa, Arizona
  22. Nashville, Tennessee
  23. Des Moines, Iowa
  24. Nampa, Idaho
  25. Tempe, Arizona
  26. Irving, Texas
  27. Oakland, California
  28. Grand Rapids, Michigan
  29. Charlotte, North Carolina
  30. Rancho Cucamonga, California
  31. Boston, Massachusetts
  32. Pittsburgh, Pennsylvania
  33. Honolulu, Hawaii
  34. Oceanside, California
  35. Pearl City, Hawaii
  36. Anchorage, Alaska
  37. Warwick, Rhode Island
  38. Virginia Beach, Virginia
  39. Cheyenne, Wyoming
  40. Petersburg, Florida
  41. Chesapeake, Virginia
  42. Billings, Montana
  43. Lexington-Fayette, Kentucky
  44. Durham, North Carolina
  45. Santa Ana, California
  46. Jersey City, New Jersey

Cities 138 through 182

Finally, we reach what cities, according to WalletHub analysis, experience the least amount of stress.

  1. Salt Lake City, Utah
  2. Aurora, Illinois
  3. Santa Clarita, California
  4. Glendale, California
  5. Manchester, New Hampshire
  6. Paul, Minnesota
  7. Garden Grove, California
  8. Pembroke Pines, Florida
  9. Yonkers, New York
  10. Chandler, Arizona
  11. Oxnard, California
  12. Juneau, Alaska
  13. Anaheim, California
  14. Santa Rosa, California
  15. Chula Vista, California
  16. Charleston, South Carolina
  17. Raleigh, North Carolina
  18. San Francisco, California
  19. Huntington Beach, California
  20. Omaha, Nebraska
  21. San Diego, California
  22. Gilbert, Arizona
  23. Scottsdale, Arizona
  24. Rapid City, South Dakota
  25. Austin, Texas
  26. Seattle, Washington
  27. Minneapolis, Minnesota
  28. Missoula, Montana
  29. Boise, Idaho
  30. Nashua, New Hampshire
  31. Plano, Texas
  32. Cedar Rapids, Iowa
  33. Lincoln, Nebraska
  34. Portland, Maine
  35. Irvine, California
  36. Burlington, Vermont
  37. Sioux Falls, South Dakota
  38. Bismarck, North Dakota
  39. San Jose, California
  40. Columbia, Maryland
  41. Fargo, North Dakota
  42. Overland Park, Kansas
  43. Madison, Wisconsin
  44. South Burlington, Vermont
  45. Fremont, California

Twelve of the cities on this part of the list are in California. Further, the least-stressed city in California: Fremont. If you read yesterday’s article, you know that WalletHub ranked Fremont, California, the happiest city in the US.

Image: Nathan Dumlao on Unsplash

by David Klemt David Klemt No Comments

Which Cities and States are the Happiest?

Which US Cities and States are the Happiest?

by David Klemt

Yellow smiley face ball

As an entrepreneur and operator evaluating a market for a first location or expansion, it can help to know where people are happiest.

Equally as helpful: Knowing the cities and states that are the least happy. Not, necessarily, so an operator can avoid these markets.

Rather, one’s concept may be a ray of stress-free sunshine for a given community. Providing a great workplace with a positive culture can work wonders for both the happiest and least-happy places. And as the cornerstones of the communities they serve, restaurants and bars can improve their guests’ quality of life.

We’ve looked at the US cities with the greatest inflow and outflow (which can reveal happiness levels), as identified by Redfin. And we’ve checked out the best US retirement cities, researched by Clever.

Now, we’re taking a look at which US cities and states are the happiest and least happy, according to WalletHub. In case you’re unaware, personal finance site WalletHub researches a vast array of topics. You can browse them here.

Happiest Cities

While determining which are happiest, WalletHub identified the happiest 182 cities. Obviously, that’s a far cry from how many cities are in the US.

According to one source, there 19,495 cities, towns, and villages across the country (per data from 2018). Of those, 4,727 cities have populations of 5,000 or more. A total of 310 cities have populations of at least 100,000, and only ten are home to one million people or more.

So, living in any of the 182 cities WalletHub suggests one is pretty happy. However, these are the ten happiest cities, in descending order:

  1. Fremont, California
  2. Columbia, Maryland
  3. San Francisco, California
  4. San Jose, California
  5. Irvine, California
  6. Madison, Wisconsin
  7. Seattle, Washington
  8. Overland Park, Kansas
  9. Huntington Beach, California
  10. San Diego, California

As you can see, six of the 10 cities are in California. In fact, 29 of the 182 cities on this list are located in the Golden State.

To create their list, WalletHub analyzed several metrics that make up three main categories: emotional and physical well-being; work environment; and community and environment.

Fremont, CA, is number one for emotional and physical well-being. The top spot for work environment goes to San Francisco, CA. And the number-one city for community and environment is Casper, Wyoming, which is number 79 on the list overall.

Least-happy Cities

Again, understanding that there are more than 19,400 cities, towns, and villages in the US alters the context of this list a bit.

Living and operating in one of these 182 cities indicates a person is living in a happy city. Basically, it isn’t the worst place to live if it’s on this list.

At any rate, let’s look at the 10 cities that make up the bottom of WalletHub’s list. Or, the “least-happy” cities, at least as far as these rankings are concerned.

  1. Detroit, Michigan
  2. Gulfport, Mississippi
  3. Memphis, Tennessee
  4. Huntington, West Virginia
  5. Montgomery, Alabama
  6. Cleveland, Ohio
  7. Augusta, Georgia
  8. Fort Smith, Arizona
  9. Mobile, Alabama
  10. Shreveport, Louisiana

Happiest States

WalletHub also ranked 50 states to determine the happiest and least happy. I checked, and, yep, that’s all of ’em! I will say it’s a bit disappointing they didn’t include Puerto Rico, but it isn’t the 51st state (yet).

WalletHub focused on 30 metrics to rank the states, which make up three main categories: emotional and physical well-being; work environment; and community and environment.

In descending order, the happiest states in America are:

  1. Hawaii
  2. Maryland
  3. Minnesota
  4. Utah
  5. New Jersey
  6. Idaho
  7. California
  8. Illinois
  9. Nebraska
  10. Connecticut

Hawaii doesn’t just take the top spot overall, it also claims number one for emotional and physical well-being. Utah takes first for work environment, and community and environment.

Rounding out the “happiest half” of the US are:

  1. Virginia
  2. South Dakota
  3. North Dakota
  4. Massachusetts
  5. New Hampshire
  6. Iowa
  7. Delaware
  8. Florida
  9. Georgia
  10. North Carolina
  11. Wisconsin
  12. Washington
  13. New York
  14. Maine
  15. Wyoming

Least-happy States

Conversely, the following are the least-happy states, starting with the unhappiest:

  1. West Virginia
  2. Louisiana
  3. Arkansas
  4. Kentucky
  5. Alabama
  6. Mississippi
  7. Oklahoma
  8. Tennessee
  9. New Mexico
  10. Missouri

Filling out the least-happy half of the country are:

  1. Alaska
  2. Michigan
  3. Ohio
  4. Indiana
  5. Texas
  6. Nevada
  7. Vermont
  8. South Carolina
  9. Kansas
  10. Arizona
  11. Colorado
  12. Montana
  13. Rhode Island
  14. Pennsylvania
  15. Oregon

In terms of the three metrics WalletHub analyzed, West Virginia is ranked last for emotional and physical well-being. Unfortunately, Mississippi is last for work environment. And Texas comes in last for community and environment.

Image: chaitanya pillala on Unsplash

by David Klemt David Klemt No Comments

US Cities with Greatest Outflow and Inflow

US Cities with Greatest Outflow and Inflow

by David Klemt

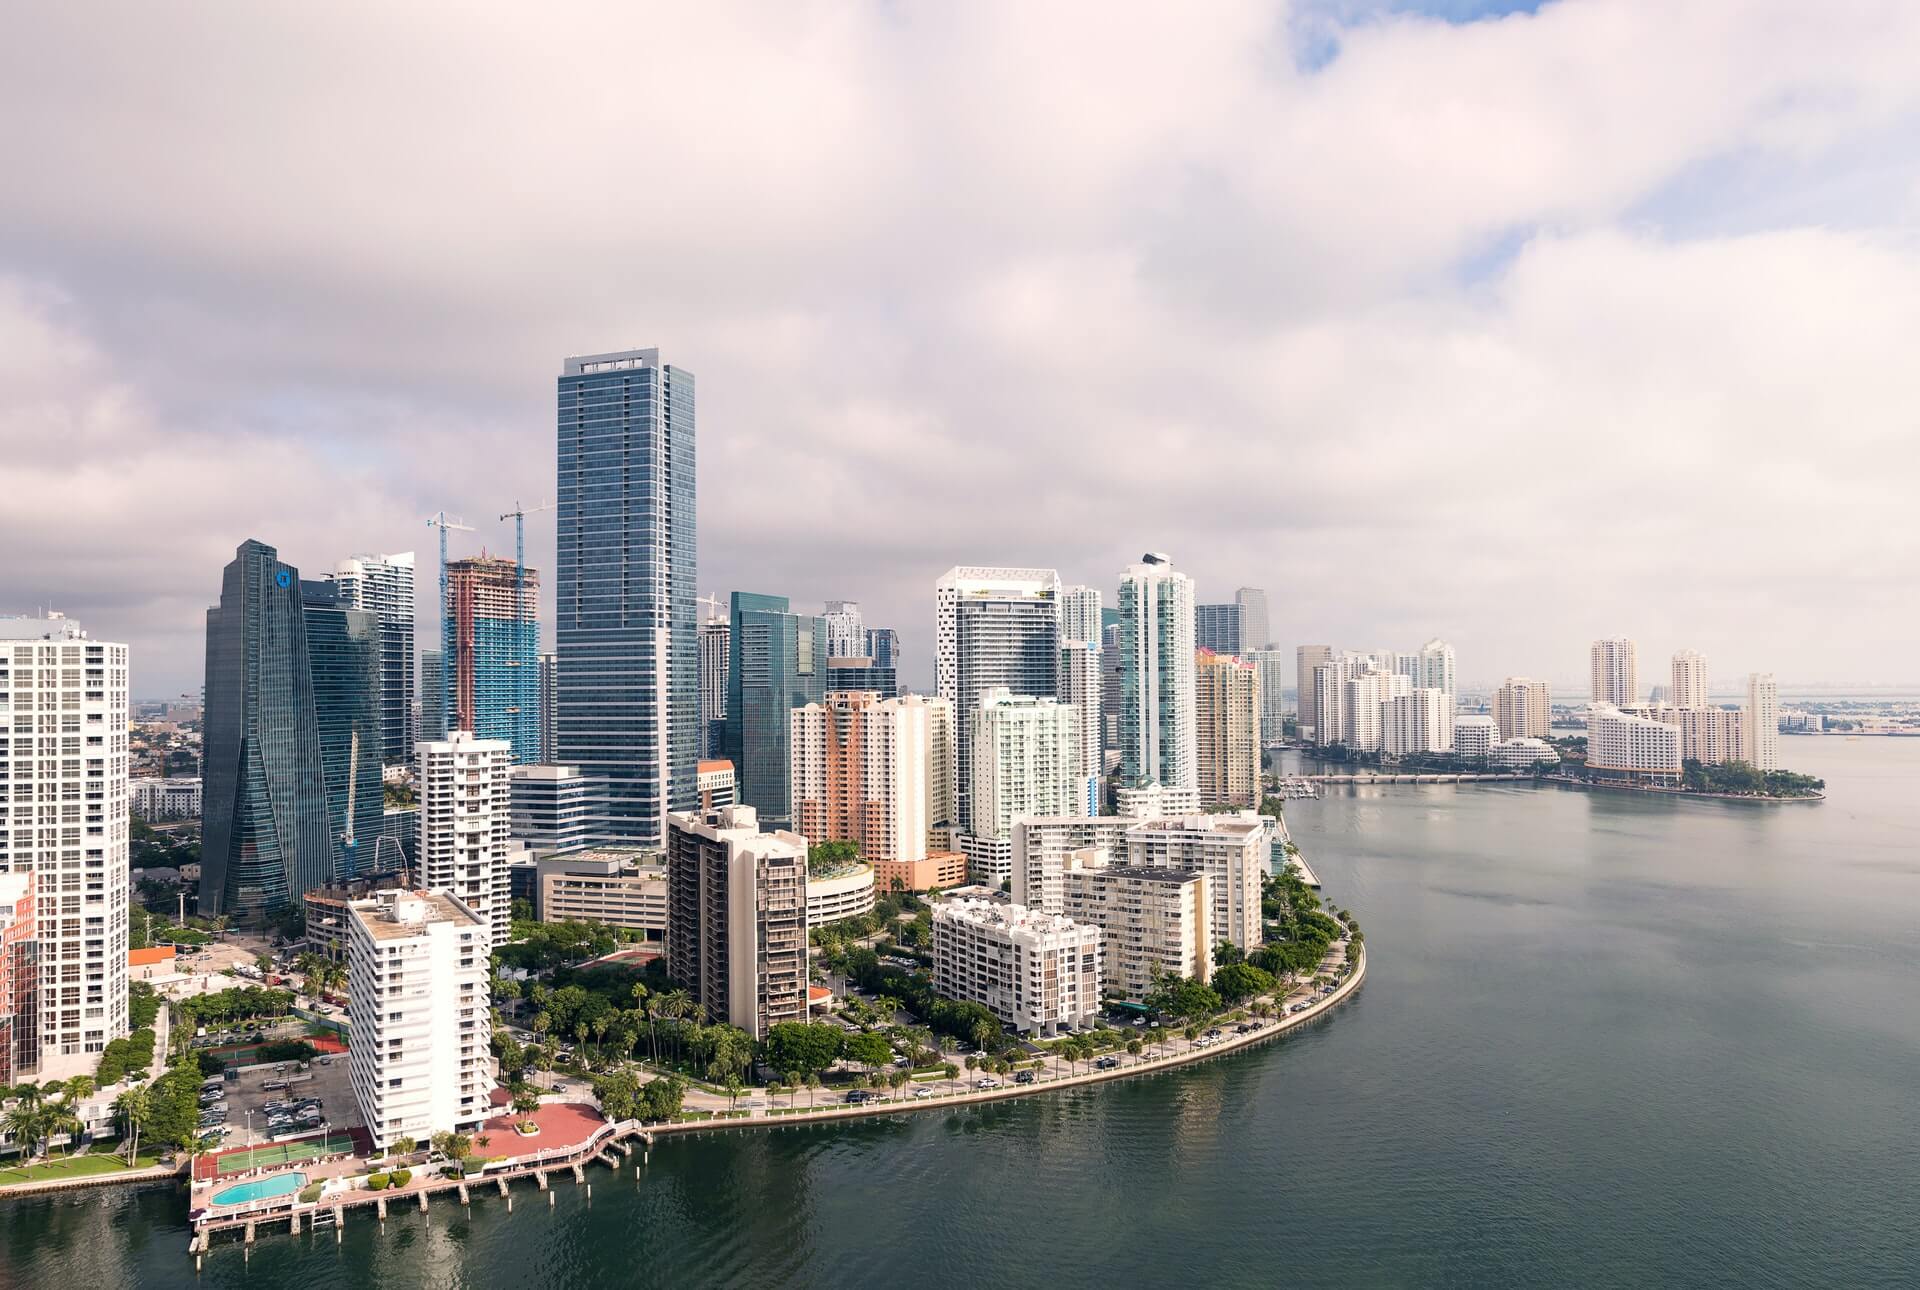
Brickell in Miami, Florida

Seattle-based real estate brokerage Redfin reveals the US cities seeing the greatest numbers of people leaving and moving in.

Obviously, real estate brokers need to know where people are selling and where they’re buying. Going deeper, they also need to know if populations are growing, remaining the same, or dwindling.

However, there’s another group of people who need this information: restaurant, bar, and hotel owners, operators, and workers.

Regardless of experience, owners and operators know site selection is one of the most important decisions they’ll make. Seriously, is there anyone who hasn’t heard the maxim, “Location, location, location” at this point?

Let’s say a new operator is considering where they should locate their business. When looking at major cities, it’s important to understand out- and inflow trends. The same holds true for operators seeking to expand. Clearly, it’s beneficial to know what cities are growing. Equally as important to consider: Is it best to open a location in the heart of the city or the surrounding suburbs?

Of course, there are considerations when looking at outflow and inflow data. For example, operators in cities seeing an influx need to strategize to leverage the area’s growth. How will they appeal to new residents? What can they do to convert them to regulars? Looking at operations, do they need to fill roles and are these new residents looking for work?

Now, when people are leaving cities in significant numbers it affects business. So, if there’s a noticeable downturn, it could be a good idea for operators to contact landlords. And for new operators, an exodus can be a bargaining chip to use during lease negotiations.

Outflow

According to Redfin, these are the top ten cities experiencing outflow.

  1. Minneapolis, Minnesota
  2. Chicago, Illinois
  3. Denver, Colorado
  4. Detroit, Michigan
  5. Boston, Massachusetts
  6. Seattle, Washington
  7. Washington, DC
  8. New York, New York
  9. Los Angeles, California
  10. San Francisco, California

Of particular note, Redfin reports that the average cost of a house in San Francisco is now over $1.5 million. No wonder so many people are leaving. Selling a home in that market can give sellers an influx of cash that will go much further elsewhere.

Inflow

Conversely, these are the ten American cities seeing the greatest inflow.

  1. Dallas, Texas
  2. San Antonio, Texas
  3. North Port, Florida
  4. San Diego, California
  5. Cape Coral, Florida
  6. Las Vegas, Nevada
  7. Sacramento, California
  8. Phoenix, Arizona
  9. Tampa, Florida
  10. Miami, Florida

Now, looking at this list, Florida is crushing it in terms of homebuyer growth. So, new and veteran operators should look into the Sunshine State for their first location or expansion.

Of course, the rest of this list is also certainly worthy of consideration, per Redfin’s data analysis. However, the brokerage notes that net inflow for Dallas, Las Vegas, Phoenix, and Sacramento is slowing in comparison to 2021.

Interestingly, to me, half of the outflow list is on Time Out’s 2022 top cities list: Boston, Chicago, Los Angeles, New York, and San Francisco. On the other hand, Miami is also on the Time Out List.

This is to say that data can be interpreted a multitude of ways, so always proceed with caution. The best way to select locations is with focused feasibility studies that drill down to particular ZIP codes and neighborhoods.

Image: Ryan Parker on Unsplash

Top