Traffic

by David Klemt David Klemt No Comments

Campbell’s Shares Tips for LTOs

Campbell’s Shares Tips for LTOs that Generate ROI

by David Klemt
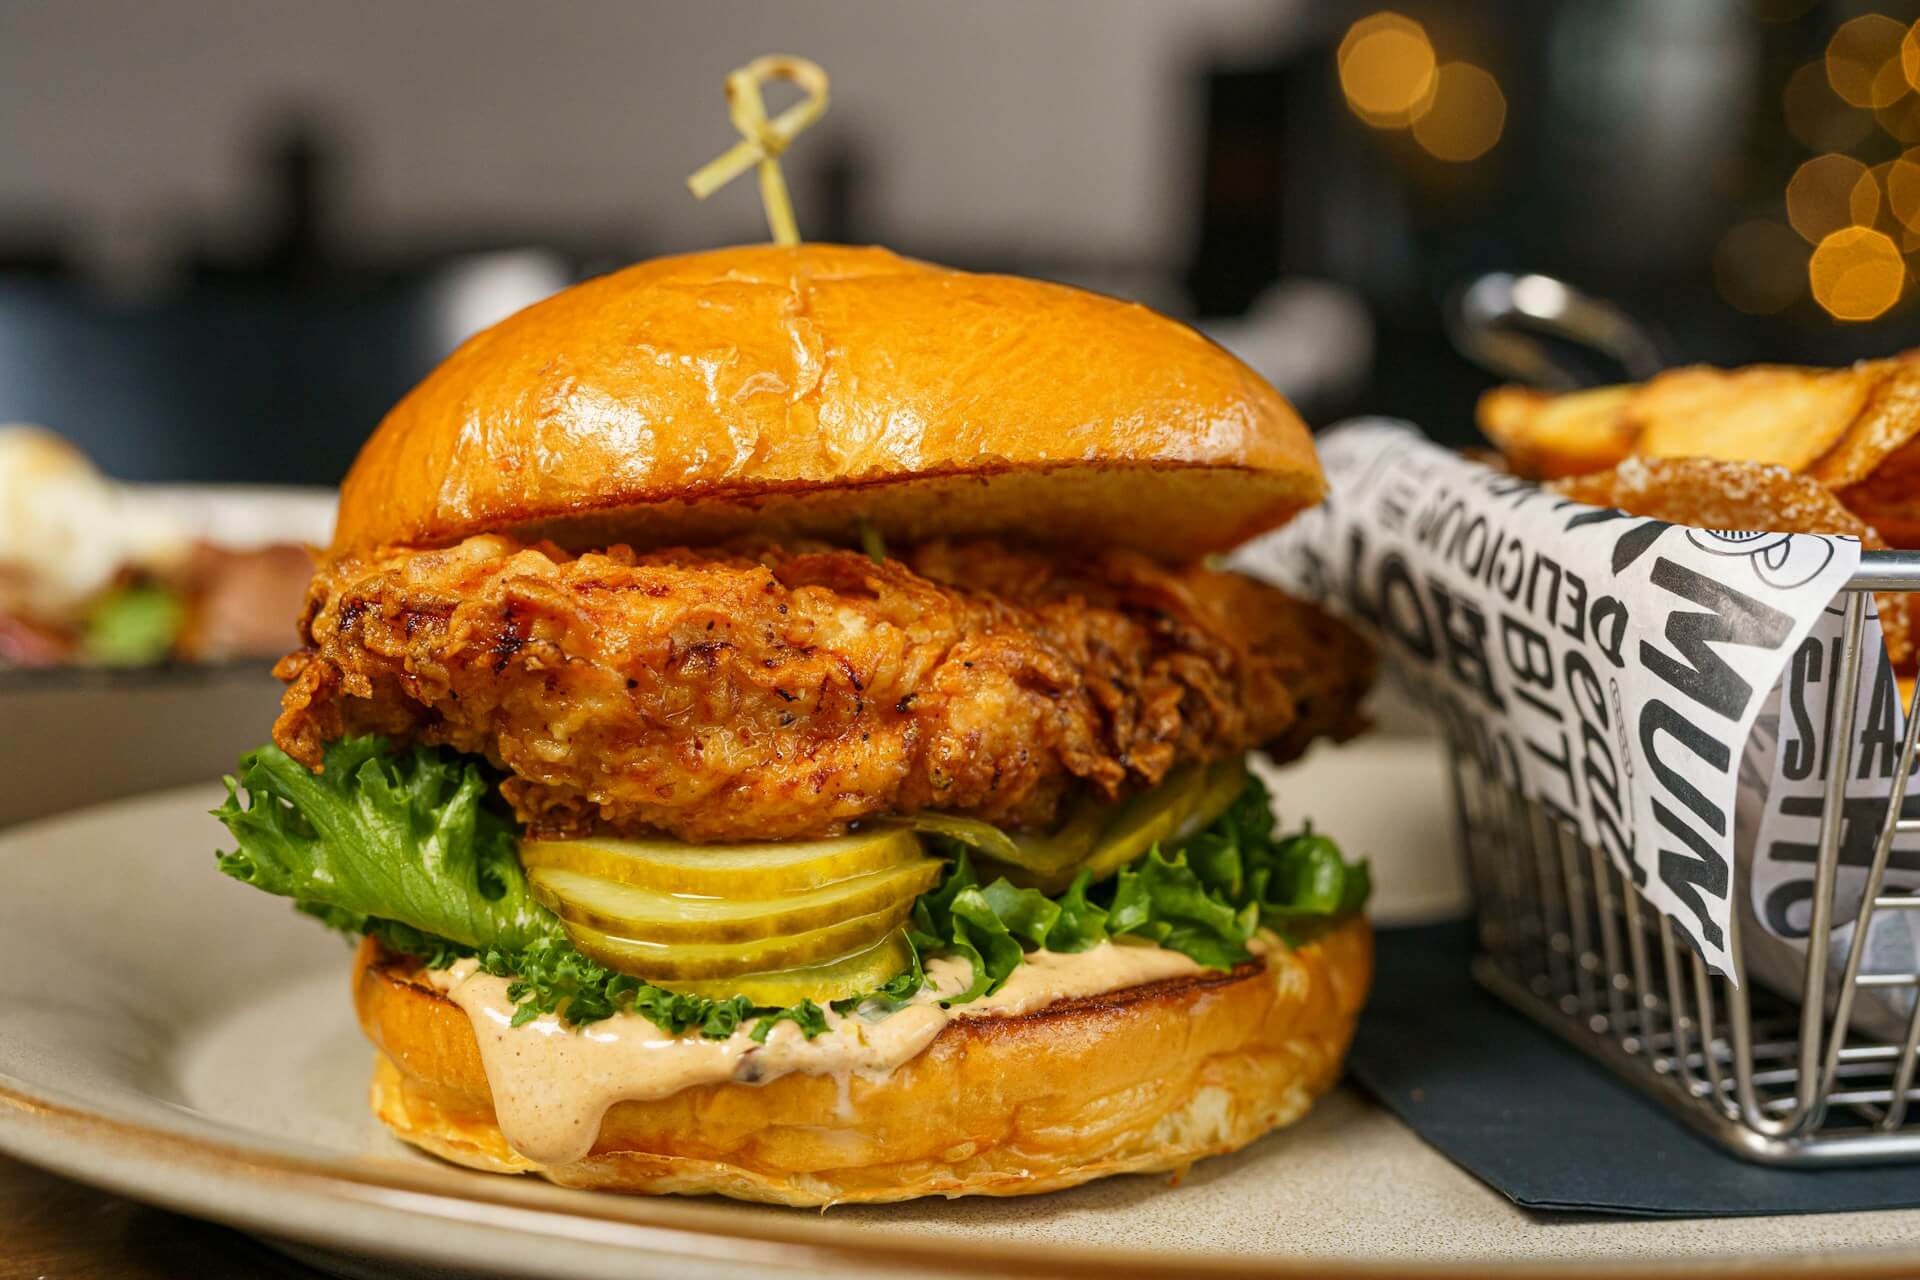
A well-crafted chicken sandwich with pickles, lettuce, and sauce, served next to a basket of French fries

Yes, the Chicken Sandwich Wars are still going strong in 2024.

We appreciate Campbell’s Foodservice’s reports and posts, and their most recent insights address how operators can succeed with LTOs.

For example, our look into their tips for leveraging nostalgia is here. And our thoughts on Campbell’s Culinary TrendPulse 2024 report are here for your review.

This time out, Campbell’s Foodservice, utilizing data from Technomic, Datassential, and other sources, is tackling LTOs.

If you’re a regular reader of KRG Hospitality’s industry insights, you know we love an LTOif an operator executes it effectively. Along those lines, you probably also know that we view Taco Bell as a leader in the industry when it comes to leveraging the power of LTOs.

Not only does the QSR giant know what their guests want, they know how to generate demand. In fact, Taco Bell understands the power not just of LTOs but of tying them to their subscriptions. Take, for example, their Taco Lover’s Pass and the Toasted Breakfast Taco menu drop.

When approached with thoughtful consideration, well-executed LTOs are a crucial element of an operator’s marketing and branding strategy. They drive traffic and sales, boost guest engagement and loyalty, and attract attention from first-time guests.

Of course, crafting a gainful LTO—gaining profits, loyalty, and positive public perception—can be easier said than done. However, there are a number of steps you can take to get the ball rolling and come up with one that reflects your brand, and resonates with guests.

Four Steps

Kicking off their tips, Campbell’s Foodservice recommends keeping LTOs simple. As they say in their report, which you can read here, operators need not “reinvent the wheel” when developing these promotions.

You can differentiate an LTO menu item from its standard counterpart in a number of simple ways. A few examples are using a unique cooking process, crafting a limited-edition sauce, and featuring a distinctive and specific topping or two.

Another tip is to do your best to offer LTOs that embrace current trends. While sharing these tips, Campbell’s cites Datassential and the revelation that just 20 percent of all LTOs are recurring. That means that the vast majority of LTOs are new creations, not stalwarts like the McRib. To draw the attention of a wider swath of guests, feature regional and local items and flavors. Per Datassential, 70 percent of guests are interested in such LTOs.

Speaking of attention, operators should learn how to take and edit attractive F&B images. Or, as Campbell’s says, “make LTOs pretty.” Per Datassential, roughly a third of consumers will try an LTO if it looks appealing in an advertisement or in-store imagery.

Finally, and this one is crucial as it embodies the previous three tips, leverage seasonality. It’s currently summer, so what can you add in the way of flavor to an existing item? Is that item regional and locally sourced? Will photographing it and crafting a sharp post communicate the season and inspire a bit of FOMO? These questions can help guide your approach to crafting profitable LTOs.

Oh, and to help you get started, I’ve shared Campbell’s season flavor suggestions below. Cheers!

Campbell’s Foodservice Seasonal Flavors

Not only did Campbell’s share tips for succeeding with LTOs, they also provided several examples of seasonal flavors to inspire you and your team.

Since it’s July, I’ll start with their summer suggestions.

Summer: basil, blackberries, corn, cucumbers, peaches, tomatoes, watermelon, zucchini

Fall: artichokes, cranberries, edamame, parsnips, pears, pumpkin, sweet peppers, tomatillos, turnips,

Winter: butternut squash, persimmons, radishes, salsify (a root vegetable), sunchokes, sweet potatoes, tangerines

Spring: asparagus, fava beans, pea greens, rhubarb, snap peas, spring onions, strawberries

Campbell’s Foodservice sources:

  1. Foodservice and Hospitality: A strong LTO strategy helps operators retain and grow their customer base (March 2024)
  2. Datassential: Limited Time Offers Keynote Report
  3. Technomic: 162 Best-in-Class LTOs for 2023
  4. Food & Drink Resources: A Limited Time Offer Strategy For Restaurants
  5. Your Guide to Seasonal Fruits and Vegetables, The Spruce Eats
  6. Datassential: State of the LTO 2024

Image: Hybrid Storytellers on Unsplash

Bar Nightclub Pub Brewery Menu Development Drinks Food

by David Klemt David Klemt No Comments

Taco Bell Racking Up Rewards Program Wins

Taco Bell Racking Up Rewards Program Wins

by David Klemt

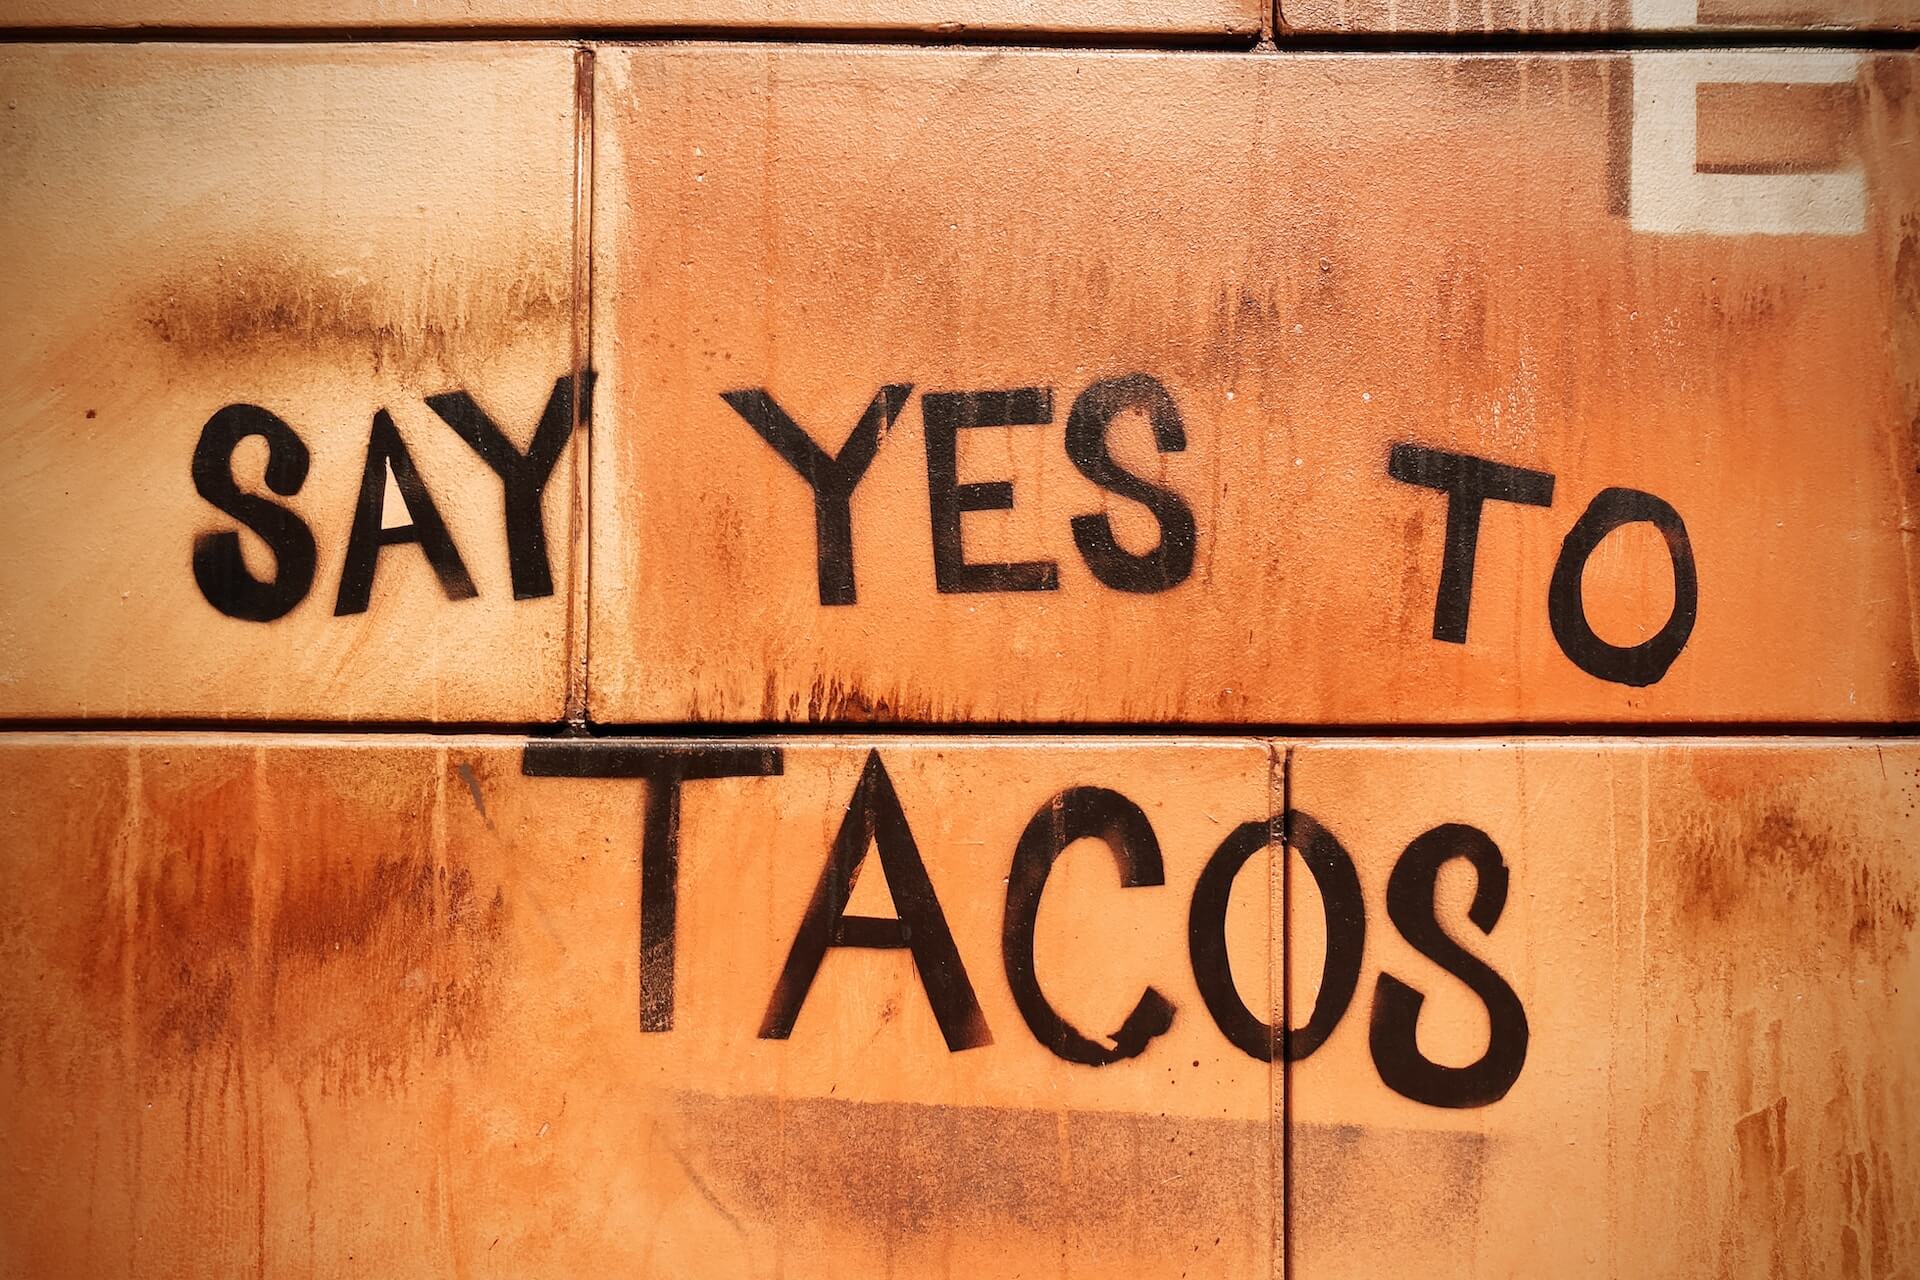
"Say yes to tacos" graffiti

Taco Bell, masters of the limited-time offer and loyalty program, continue to rack up wins with the return of a fan-favorite promotion, and more.

The fast-food giant operates more than 7,800 restaurants in the US alone. However, the company understands that sheer numbers aren’t enough to turn a profit.

Rather, Taco Bell continually proves they understand the power of promotions, loyalty, and LTOs.

The QSR routinely releases specialty items, then packs them away to generate buzz and traffic by making them available once again—for a limited time. Compellingly, Taco Bell also ties their LTOs to their loyalty program. Often times, the only way for guests to enjoy special perks and items is to be a Taco Bell Rewards member.

Not only does this help to engage existing members, this approach drives new program signups.

Case in point: the Taco Lover’s Pass.

National Taco Day Promotion

If you’re industry or a fan of Taco Bell, you should be aware of the Taco Lover’s Pass by now.

Tracing its genesis to 2021 in Arizona, the LTO pops up every now and then. In exchange for $10, those who grab a pass can get one free taco each day for 30 consecutive days.

Oh, and the pass is now only available via the Taco Bell app, and to members of the Taco Bell Rewards program. Again, this is an excellent way to boost engagement. Do guests want to take advantage of this LTO? Great—they’ll need to exchange their info and provide access to themselves to do so.

Normally, the Taco Lover’s Pass is available for purchase for just one day. However, this time around Taco Bell gave rewards members two days to snag one. This is likely due to a new menu item drop coming tomorrow.

For quite some time now, Taco Bell has been hinting that they’ll be making breakfast easier and better. And now we know how they plan to accomplish that goal.

Joining the Seasoned Beef Crunchy Taco, Seasoned Beef Crunchy Taco Supreme, Seasoned Beef Soft Taco, Seasoned Beef Soft Taco Supreme, Spicy Potato Soft Taco, Seasoned Beef Doritos® Locos Tacos, and Seasoned Beef Doritos® Locos Tacos Supreme on the Taco Lover’s Pass is the new Toasted Breakfast Taco.

Today, October 12 (a Taco Tuesday!), Taco Bell drops the Toasted Breakfast Taco, and holders of their coveted pass can grab one for free.

Clearly, Tuesdays are important to Taco Bell. Let’s not forget that they very publicly challenged the “Taco Tuesday” trademark, and very publicly celebrated its cancellation. So, launching an all-new item that will drive traffic to Taco Bell during the breakfast daypart makes perfect sense. The drop also further solidifies their branding and marketing.

Steal a Base…

…Steal a Taco. Not only is the Taco Lover’s Pass back, so is Taco Bell’s Major League Baseball promotion.

And, once again, it’s available only via the Taco Bell app, and only to Taco Bell Rewards members.

Focusing on the Fall Classic, “Steal a Base, Steal a Taco” is a collaboration between Taco Bell, the MLB, and Topps.

Starting October 27 (not a Tuesday), the first player to steal a base will earn the title Taco Hero. That player will also earn free Nacho Cheese Doritos® Locos Tacos for Taco Bell Rewards members.

Taking things further, however, is Topps. The iconic trading card brand has put a limited run of Topps TacoFractor cards into circulation. People who hold the card of the first player to steal a base during the 2023 World Series could win Taco Bell for life. For this promotion, that comes in the form of a digital $15,000 Taco Bell gift card.

Alternatively, the holders of Topps TacoFractor Wild Cards could win the big prize.

On October 10 (a Tuesday!), Taco Bell Rewards members will have the chance to score free Topps Chrome or Cosmic Chrome packs. This limited Tuesday Drop could lead to a Taco Hero card, which in turn can lead to winning Taco Bell for life.

Takeaway

Unquestionably, Taco Bell understands the power of marketing messaging, branding, promotions, and the LTO.

However, they also understand the need for loyalty and rewards programs to do more than just offer discounts and free menu items. A great loyalty program needs to be big, bold, and encourage constant engagement.

With that in mind, it’s more than likely time for most operators, regardless of size, to review and rethink their programs.

Image: Chad Stembridge on Unsplash

Bar Nightclub Pub Brewery Marketing Agency Team

by David Klemt David Klemt No Comments

Celebrating the Espresso Martini

Celebrate the Espresso Martini with Mr. Black

by David Klemt

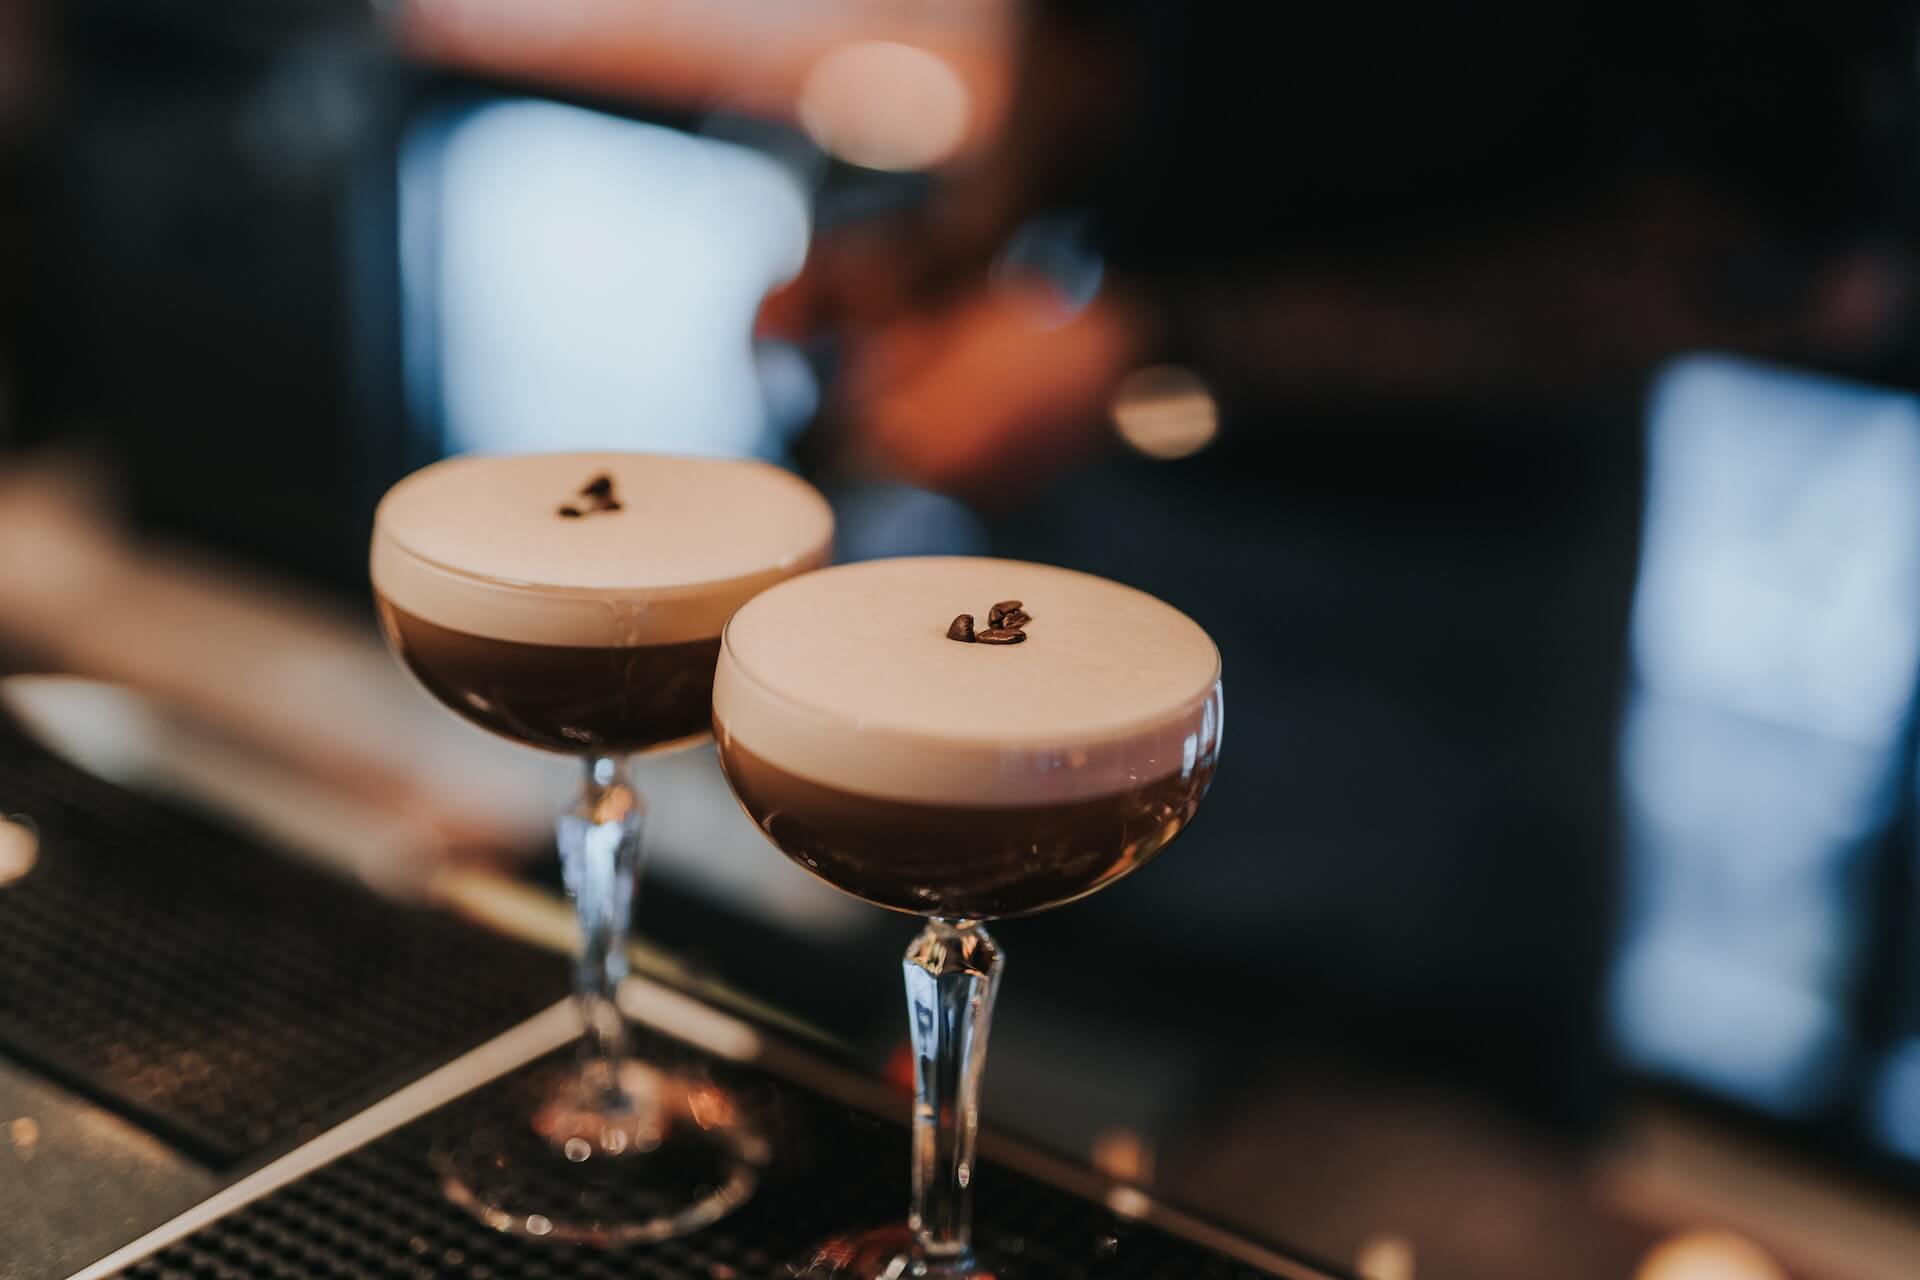
Two Espresso Martinis on a bar

For the second time in its brief but exciting history, Mr. Black Espresso Martini Fest is coming to bars throughout America.

Last year, 70 bars in eight cities across the US took part to celebrate the Espresso Martini. This year, participation more than doubles.

Fourteen cities in ten states will play host to more than 200 bars during the fest. For 2023, Austin, Boston, Dallas, Denver, Nashville, Phoenix, and Seattle are joining in on the fun.


View this post on Instagram


A post shared by Mr Black Spirits (@mrblackspirits)

I, for one, expect Espresso Martini Fest to have the same staying power as other cocktail celebrations. The inaugural event took place in 2016 in Australia. In 2018, the Fest spread to the UK. After launching in the US, the week-long event growth has doubled over the course of just one year.

Logically, Mr. Black Espresso Martini Fest should join the ranks of Negroni Week, Old Fashioned Week, and Bee’s Knees Week.

Now, I know I’ve called the Espresso Martini “the cocktail that won’t die.” And yes, I’ve pointed out that it’s not technically a Martini, and that many bartenders hate it for the time it can take to make. That doesn’t mean participating in Espresso Martini Fest is a bad idea.

This is a cocktail that guests enjoy. It’s a drink that generates headlines each year. And clearly it’s a beverage that can drive traffic and generate revenue. At the end of the day, participation is a smart move.

2023 Espresso Martini Fest Cities

Given that the Fest runs from October 9 to 15, it’s unlikely the organizers are still vetting venues for participation. However, at the time of this article’s publication, the portal appeared to be open. It’s a worth a shot if you want your bar to join Espresso Martini Fest!

At least you’re aware of the event now so you can prepare to sign up next year.

Bars in the following cities are taking part in this year’s Fest:

  • Austin, Texas
  • Boston, Massachusetts
  • Chicago, Illinois
  • Dallas, Texas
  • Denver, Colorado
  • Houston, Texas
  • Los Angeles, California
  • Miami, Florida
  • Nashville, Tennessee
  • New York, New York
  • Phoenix, Arizona
  • San Diego, California
  • San Francisco, California
  • Seattle, Washington

I certainly anticipate this list growing by at least 50 percent for 2024. Cheers!

Image: Krists Luhaers on Unsplash

KRG Hospitality. Bar Consultant. Nightclub. Lounge. Mixology. Cocktails.

by David Klemt David Klemt No Comments

Fantasy Sports, Sports Betting on the Rise

Interest in Sports Betting and Fantasy Sports Grows

by David Klemt

Wall full of American footballs behind large NFL logo

A recent CGA by NIQ On Premise Impact Report for August, 2023 reveals an interesting insight into consumer behavior and expectations.

To be clear, all the data on this new one-pager is useful. However, a particular revelation stands out from the rest, for me.

The CGA by NIQ US On Premise Impact Report for August 24, 2023 addresses:

  • total on-premise sales;
  • dining versus drinking occasions;
  • cost of living impact in the past month; and
  • consumer interest in fantasy sports and sports betting.

It’s that final bullet point that I find compelling. However, let’s check out the numbers for the first three points before we jump into sports.

To download your own copy, please click here.

August by the Numbers

In comparison to August 20, 2022, check value is up one percent to $50.09. Ticket count, however, is down one percent to 1,569.

As one would expect, dining occasions outweigh drinking occasions. Seventy percent of consumers have dined out in a restaurant or bar in the past two weeks.

Compared to July 2o23, that’s a two-percent increase in dining traffic.

Over the course of the same amount of time, 40 percent of consumers have gone drinking in a bar or restaurant. That’s a decrease of one percent in comparison to July 2023.

Considering that many families travel in the month of August before kids head back to school (or to drop them off at university), these numbers make sense.

Of course, cost of living may also be impacting dining and drinking occasion. Most consumers report no changes to the frequency with which they go out for drinks. Some consumers even report going out more frequently for drinks. But some are also cutting back.

For example, 28 percent of consumers have decreased how often they go out for drinks. Eleven percent are consuming lower quality drinks when they do go out, and nine percent are decreasing the “quality” of the establishments they visit.

That said, 20 percent of consumers are increasing drink quality and 21 percent are increasing establishment quality per visit. Seventeen percent are increasing how often they go out for drinks.

Fantasy Sports & Betting

This, as you may have guessed, is the statistic that I find most compelling.

Fantasy sports and sports betting has been on the rise for some time in the US. Who among us isn’t the target of sports-betting-app ads when streaming or watching sports?

Sports bar operators and operators who can position themselves as sports fans’ “third spot” will find this next number interesting.

According to CGA by NIQ’s latest report, 63 percent of consumers revealed they had plans for NFL week one. Those plans included participating in daily fantasy sports or sports betting.

So, it would be wise for operators who will air NFL games this season to ensure they’re catering to fantasy football and sports betting fans. Becoming the hub for fantasy sports groups in your area can increase traffic, sales, and loyalty. And, of course, it opens up the door to many traffic- and revenue-generating sport- and team-themed LTOs.

Again, to download this new report for yourself, please click here.

Image: Adrian Curiel on Unsplash

KRG Hospitality. Gaming. Entertainment. Consultant. Food Service. Bowling Alley. Golf. Simulator. Arcades. Eatertainment.

by David Klemt David Klemt No Comments

Do Super Bowl Ads Work on Consumers?

Do Super Bowl Ads Work on Consumers?

by David Klemt

Pepsi Zero Sugar bottle

One of the biggest Super Bowl ad winners is Pepsi Zero Sugar.

Brands spent hundreds of millions of dollars to advertise during Super Bowl LVII, but do their ads actually translate to demand for their products?

A week ago we shared our ten favorite beverage-focused Big Game ads. Along with those ads we shared some numbers.

One of those numbers was $7 million, the cost of a 30-second Super Bowl ad on Fox. Other numbers? $500 million and $700 million, the range of revenue it’s estimated that Fox generated this year from Super Bowl ads.

At this point, these ads and the Halftime Show have essentially become their own entities. Some people watch the Big Game for the ads, some for the show halfway through. It stands to reason that brands are well aware of this development. So, they try to create the most impactful ad possible in the hopes of generating consumer demand.

In other words, these brands aren’t spending all this money just so they’re commercial can be deemed cool. Sure, brands want that buzz. But they also want an ROI on the millions they spend.

The big question is, then, are they seeing a return? Well, it just so happens that behavioral insight platform Veylinx has a data-driven answer to that question.

In short, the answer is yes. Of course, it’s a nuanced yes. For example, it appears Gen Z doesn’t care much about Super Bowl ads, as you’ll see below. Also, non-advertisers in the same categories as Super Bowl advertisers appear to see a benefit from the ads.

You’ll learn more from the Veylinx press release below. It’s an interesting read with valuable data for restaurant, bar, and hotel operators.

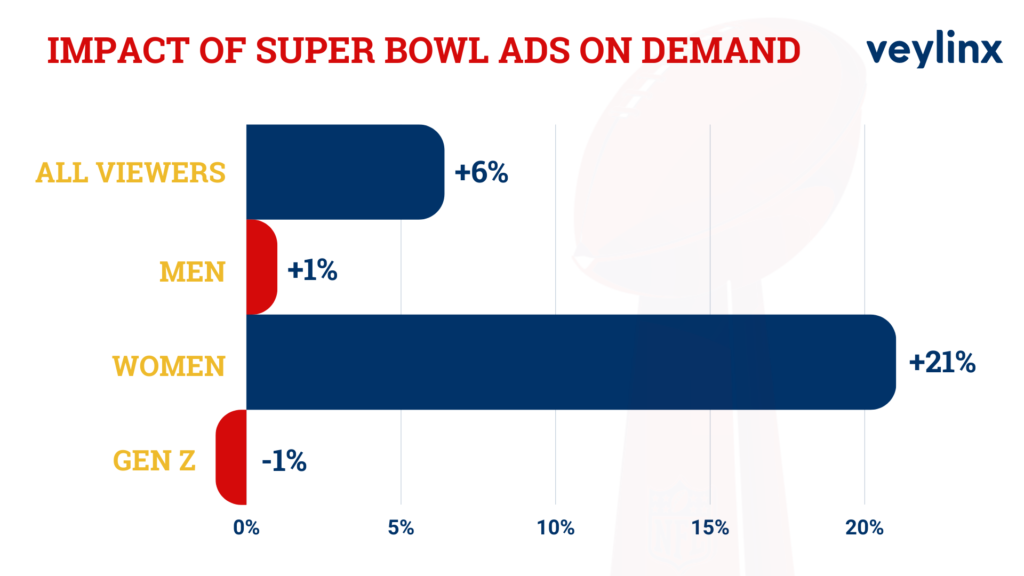
NEW YORK, Feb. 22, 2023 — A new study from behavioral research company Veylinx determined whether or not Super Bowl commercials boost consumer demand for the products advertised. The results show that 2023 Super Bowl advertising fueled a 6.4% increase in demand among viewers.

The overall increase in consumer demand was driven by women, who accounted for a 21% increase in demand growth. The commercials had minimal impact on men, yielding just 1% demand growth for the brands tested. Gen Z viewers were largely unimpressed by the Super Bowl ads, with demand among 18 to 25 year olds actually shrinking by 1%.

2023 Veylinx impact of Super Bowl ads on consumers chart

“It’s not really a surprise to see that Super Bowl ads improve sales, but the short term bump alone may not be enough to justify the $7 million price tag,” said Veylinx founder and CEO Anouar El Haji. 

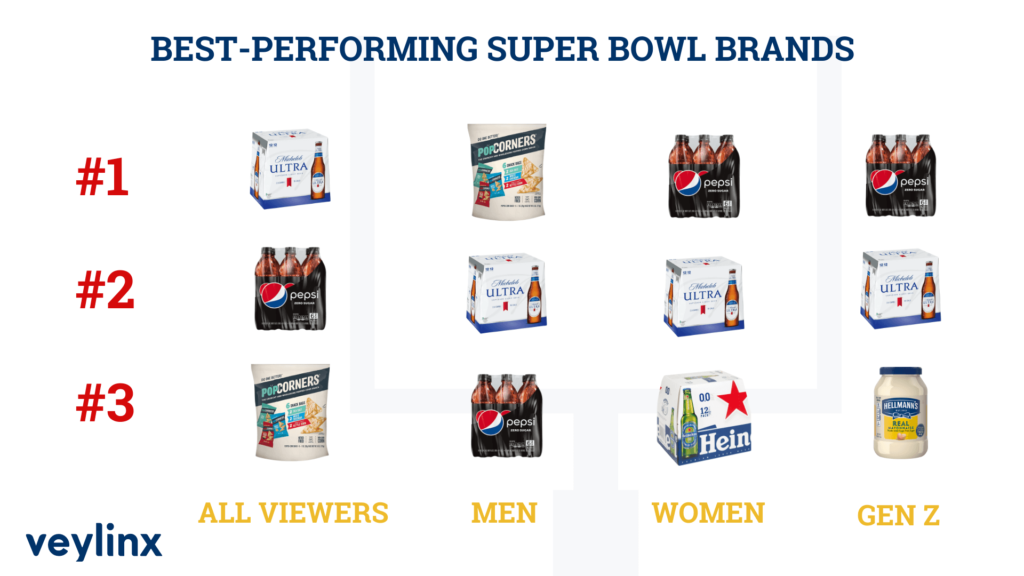
Using Veylinx’s proprietary methodology—which measures actual demand rather than intent—the study tested purchase behavior during the week before the Super Bowl and again the week after. The research focused on measuring the change in consumer demand for eight brands with Super Bowl ads: Michelob Ultra, Heineken 0.0%, Hellmann’s Mayo, Downy Unstopables, Crown Royal Whisky, Frito-Lay PopCorners, Pringles and Pepsi Zero Sugar. 

Super Bowl Advertising Winners Overall

Michelob Ultra – 19% increase in demand

Pepsi Zero Sugar – 18% increase in demand

Frito-Lay PopCorners – 12% increase in demand

Heineken 0.0% – 11% increase in demand

Super Bowl Advertising Winners Among Women

Pepsi Zero Sugar – 45% increase in demand

Michelob Ultra – 40% increase in demand

Heineken 0.0% – 40% increase in demand

Crown Royal Whisky – 26% increase in demand

Veylinx, top performing brands during 2023 Super Bowl

Halo Effect for Non-Advertisers

The biggest winners were arguably brands in the same product categories as Super Bowl advertisers. Non-advertisers in those categories appeared to benefit nearly as much as the advertisers: demand grew by 4.2% percent for the study’s control group of non-advertising competitors. Corona Extra, Kraft Mayo and Lay’s STAX were the greatest beneficiaries in a control group that also included Budweiser Zero, Arm & Hammer Clean Scentsations, Canadian Club Whisky, Popchips, and Coke Zero Sugar. Notably, every non-advertiser saw at least a slight increase in post-Super Bowl demand.

“The goal of our study was to look specifically at how consumer demand is affected by running a commercial during the Super Bowl,” El Haji said. “It’s possible that the non-advertisers deployed other marketing efforts to offset or take advantage of the Super Bowl advertising—or they simply benefited from increased exposure for their categories.” 

Additional Findings

Study participants also answered a series of follow-up questions about their preferences, perceptions and how they watched the Super Bowl. More than three-quarters watched at home through various platforms, the most popular being the live cable/satellite broadcast (38%), followed by YouTube TV (15%) and Hulu (10%). When asked why they watched, it’s no surprise that participants were all about the game (64%)—but the commercials were the next most popular reason for watching (39%), followed by halftime (35%), the social aspect (26%) and fear of missing out (13%). 

About the Research

Veylinx studied the behavior of 1,610 U.S. consumers pre- and post- Super Bowl LVII. Unlike typical surveys where consumers are simply asked about their purchase intent, Veylinx measures whether consumers will pay for a product through a real bidding process. Consumers reveal their true willingness to pay by placing sealed bids on products and then answering follow-up questions.

For more information about the study and the Veylinx methodology, visit info.veylinx.com/super-bowl

About Veylinx

Veylinx is the most realistic behavioral insights platform for confidently answering critical business questions during all stages of product innovation. To reliably predict demand, Veylinx captures insights through a Nobel Prize-winning approach in which consumers have real skin in the game. This is a major advance from traditional market research practices that rely on what consumers say they would hypothetically buy. Veylinx’s unique research methodology is trusted by the world’s largest and most innovative consumer goods companies.

Main article image: PepsiCo / Article body images: Veylinx

KRG Hospitality Bars & Lounges, 2023 icon

by David Klemt David Klemt No Comments

Traffic Up but Margins Thinner

Traffic Up but Margins Thinner

by David Klemt

Chef checking tickets

The One Table 2022 report from Datassential focuses on the state of the operator and what the industry can expect moving forward.

This informative report shares survey results from 801 operators across America. While some of the findings are positive, it’s clear many operators are enduring significant challenges.

For some, traffic and sales are up. However, that’s not the situation others find themselves in.

To download and review the Datassential One Table 2022, please click here.

The Respondents

For this report, Datassential shares the survey answers from 801 respondents.

Most survey respondents are independent operators. In fact, they account for 71 percent of the participants. Making up the rest of the field are chain operators (15 percent) and franchise operators (14 percent).

As far as segment types, the majority of survey participants operate in the fast-casual space (18 percent). Unsurprisingly, fine dining is the smallest group of respondents at six percent. Thirteen percent operate midscale restaurants, and 12 percent are at the helm of casual-dining concepts. Somewhat surprisingly, just ten percent of participants operate QSRs.

Interestingly, the service format is fairly even among survey participants. Fifty-three percent of operators are full-service and 47 percent are limited-service.

Similarly, survey respondents represent the country’s regions pretty evenly:

  • South: 30 percent
  • Midwest: 29 percent
  • Northeast: 21 percent
  • West: 20 percent

In terms of market type, most respondents operate in the suburbs (49 percent). Following somewhat closely are urban-market operators, at 31 percent. Just 20 percent of survey participants operate in rural markets.

Traffic, Sales and Margins

At first glance, Datassential’s survey reveals positive news.

Now, I’m sure people find the terms “pandemic, “pre-pandemic,” and “post-pandemic” exhausting at this point. However, there’s no denying we continue to feel the aftershocks sent through the industry by the pandemic.

So, how do things look now in comparison to pre-pandemic traffic and sales levels?

First, the positives. Nearly half of survey respondents—47 percent—say their traffic is up in comparison to where it was pre-pandemic. Add to that the 14 percent who say their traffic is the same and 61 percent of operators appear to be in good shape.

In terms of sales, 51 percent of survey participants have good news. That news is that their sales are higher in comparison to pre-pandemic levels. Again, add the 14 percent who don’t see any change. So, that’s 65 percent of operators who appear to be performing well.

But with the good there’s bad. Unfortunately, 39 percent of respondents report lower traffic than pre-pandemic levels. And sales are lower than they were before the pandemic for 35 percent of survey participants.

Operator margins are lower for all respondents. Generally speaking, the profit margin for operators before the pandemic sat at 21 percent. Now, the average is 13 percent. QSRs and fast-casual restaurants are a bit higher among survey respondents: 17 percent and 15 percent, respectively.

On paper things do look up for many operators. However, the industry is still suffering, with a third struggling to rise to even pre-pandemic levels of traffic and sales.

Image: Daniel Bradley on Unsplash

by David Klemt David Klemt No Comments

Operators & Guests Respond to Rising Costs

Operators & Guests Respond to Rising Costs

by David Klemt

Canadian dollar bills

Everything is more expensive these days and both operators and consumers have their own ideas for addressing rising costs.

To gather and share insight into people’s mindsets, Restaurants Canada conducted and commissioned two surveys.

For one, the industry research and advocacy organization surveyed operators. The focus was on how much operators anticipated increasing their prices.

On the other side, Restaurants Canada commissioned Angus Reid for a survey focusing on consumers. This survey revealed potential traffic slowdowns and perceived value for money.

For your own copy of Restaurant Canada’s 2022 Foodservice Facts report, click here.

QSR vs. FSR: Consumers

As an operator, converting first-time visitors into repeat guests is paramount. Equally as important: increasing visit frequency per guest.

Of course, an immediate byproduct of rising costs is consumers pulling back and reevaluating their spending. Oftentimes, dining out is one of the first costs consumers slash in order to save money.

Therefore, operators always face the risk of reduced traffic and even losing some guests permanently when they raise prices. However, this is often a necessary risk to take to combat rising costs.

So, how dire is the situation among Canadian consumers currently? Or at least, how did they feel in Q2 of this year? Angus Reid conducted a survey of consumers to find out, and the results can be found within the 2022 Foodservice Facts report.

First, let’s look at visit frequency for QSRs and FSRs. Before we begin, 12 percent of survey respondents answer that they “don’t know for sure” if rising prices will affect their visit frequency for either QSRs or FSRs. Not helpful.

For QSRs, 19 percent of respondents say an increase in prices won’t impact their visit frequency. Thirty-six percent anticipate visiting “a little less often,” while 32 percent will visit much frequently.

As for FSRs, 16 percent of survey respondents won’t change their visit frequency. However, 37 percent anticipate visiting FSRs much less often. Nearly as many, 36 percent, will visit a bit less frequently.

Interestingly, however, is perceived value. More FSR guests believe they receive excellent or good value for their money than they do from QSRs. More QSR guests believe they receive fair, poor, or very poor value for their money.

Overall, though, 90 percent of Canadian consumers feel positive toward the value they receive from QSRs and FSRs.

QSR vs. FSR: Operators

Clearly, it’s good news that the vast majority of Canadians believe they receive good value for their money when dining out.

Nobody enjoys paying more but it appears that both QSRs and FSRs in Canada can increase their prices. At least, they can do so for now while consumers are mostly understanding about inflation.

Restaurants Canada asked QSR and FSR operators a simple but revealing question for their 2022 Foodservice Facts report. The question? How much higher do operators expect to increase their prices by the end of Q4 of this year in comparison to last year?

The majority of operators in both categories anticipate they’ll increase menu prices by more than seven percent. Twenty-seven percent of QSR operators have that expectation. That number rises to 35 percent for FSR operators.

Twenty-two percent of QSR operators anticipate raising prices five to seven percent before the end of 2022. In comparison, 32 percent of FSR operators expect to raise prices in the same range.

At the moment, Canadian consumers appear to be willing to endure these increases. However, it’s likely they expect prices to drop back to “normal” (pre-pandemic prices) or close to it sometime in 2023. That is, unless Canada slides into recession.

Image: PiggyBank on Unsplash

by David Klemt David Klemt No Comments

Canada’s Restaurant Labor by the Numbers

Canada’s Restaurant Labor by the Numbers

by David Klemt

Chef inside commercial kitchen

While there are positive signs for Canada’s foodservice industry, recruiting and retaining labor continues to be a challenge.

Unfortunately, this isn’t a challenge unique to Canada. Operators throughout North America and indeed across the globe are facing labor shortages.

Restaurants Canada addresses this topic in their 2022 Foodservice Facts report. The non-profit research and advocacy group predicts sales will reach pre-pandemic levels by Q4 of this year.

However, restaurants, bars, and nightclubs may have to achieve traffic and revenue growth despite a significant labor deficit.

Please click here to access the 2022 Foodservice Facts report yourself.

Labor Shortage by Category

In their latest report, Restaurants Canada crunches the numbers for three distinct venue categories. These are quick-serve restaurants, full-service restaurants, and bars and nightclubs.

The organization finds that QSRs and FSRs are facing the greatest shortages. In fact, in response to a survey from May of this year, at least half of QSRs and FSRs aren’t operating with fulls staffs.

For QSRs, 52 percent of respondents say they perceive restaurants and bars they’ve visited to be understaffed. A bit over a third (36 percent) think staffing is “about right.” Unhelpfully, 12 percent “don’t know” if restaurants and bars have enough staff.

So, let’s switch gears to FSRs. Precisely half of survey respondends say restaurants and bars don’t have enough staff. Just like their QSR counterparts, 36 percent say that staffing seems to be at the ideal level. Fourteen percent respond that they “don’t know,” which doesn’t tell us much.

Per Canadians who responded to Restaurants Canada’s survey, bars and nightclubs are fairing better…at first. Frustratingly, a staggering 37 percent of respondents “don’t know” if bars or nightclubs have appropriate levels of staffing. Thirty-two percent think they’re understaffed, 31 percent think staffing levels are “about right.”

Industry professionals are probably already putting two and two together here. As long as guests receive the level of service they expect, from greeting to speed of service, to closing out their check, they think things are fine. If they’re made to wait longer than they want, they’ll likely say a restaurant, bar or nightclub doesn’t have enough people on shift.

Labor Shortage by Role

Okay, so the May 2022 Restaurants Canada wasn’t entirely helpful. It still provides interesting insight. That is, we know how guests perceive staffing in at least most instances.

So, let’s get down to hard numbers: shortages in specific roles throughout the industry.

Here, Restaurants Canada provides compelling information, even if it’s not what we want to see. In comparison to 2019, every role is down by thousands of people. In some cases, tens of thousands.

Below you’ll find the deficits by role:

  • Foodservice supervisors: -3,100
  • Chefs: -10,900
  • Bartenders: -17,600
  • Maîtres d’hôtel and hosts/hostesses: -21,100
  • Restaurant and foodservice managers: -22,400
  • Food counter attendants, kitchen helpers, and related support occupations: -43,200
  • Cooks: -44,400
  • F&B servers: -89,500
  • Other: -18,800

Add that up and that’s a shortage of 271,000 people throughout Canada’s foodservice industry. For further context, the industry boasted 1,265,700 workers. In 2021, the industry was down to 994,700.

Unfortunately, from 2020 to 2021, just 4,100 jobs were recovered, according to Restaurants Canada. This situation clearly shows that operators need to change their approach to staffing.

Now, more than ever, operators must focus on effective recruitment, onboarding, and retention. For tips on making improvements, click here. To learn how to implement employee surveys to boost retention and avoid costly turnover, click here.

Image: Brian Tromp on Unsplash

by David Klemt David Klemt No Comments

Datassential’s State of the Operator 2022

Datassential’s State of the Operator 2022

by David Klemt

Guests sitting at the bar inside a restaurant

The latest addition to the Datassential FoodBytes research series shares insights into the top three challenges most—if not all—operators are facing.

Now, some of what the report reveals paints a bleak picture. Inflation, the labor shortage, and supply chain issues persist even past the midway point of 2022.

However, operators are a tenacious and innovative group of business owners. Of course, that tenacity seems to manifest in people thinking this industry can weather any storm. That perception can come at operators’ detriment. Exhibit A: The Inflation Reduction Act of 2022 not including replenishing of the RRF. But, I digress.

“The State of the Operator & the Road Ahead,” which you can download here, is helpful and informative. As you may be aware, we’re fans of Datassential and their FoodBytes reports. In fact, you can find our synopses of FoodBytes reports here and here.

Below are some key points that operators should be aware for consideration. I strongly urge you to download this free report today.

Operator Outlook

First, let’s take a look at traffic. As Datassential points out, some hospitality business segments are performing better than others currently.

In large part, this is due to two factors: People working from home, and people returning to travel. So, operators who rely heavily on commuters and in-person workers are struggling. On the other hand, operators inside or around hotels are, per Datassential, performing the strongest at the moment.

Interestingly, though, nearly half of operators (47 percent) are seeing an increase in traffic in comparison to pre-Covid levels. Fourteen percent of operators are reporting no change in traffic. Unfortunately, traffic is lower for 39 percent of operators.

Next, sales. In comparison to pre-Covid times, more than half (51 percent) of operators report an increase. Again, 14 percent of operators are experiencing no change. But 35 percent of operators are experiencing a decrease in sales.

Finally, profit margins. Half of operators may be seeing increases in traffic in sales, but profit margins are taking a hit. On average, the industry’s profit margin is now hovering at 13 percent. That’s an eight-percent drop in comparison to pre-Covid levels.

Segment Performance

The findings regarding profit margins are likely to be the most alarming to operators. Historically, our industry has operated on razor-thin margins for decades. Dropping from an average of 21 percent to 13 is concerning.

However, context is important. The segments seeing the lowest profit margins in 2022 are: Business & Industry (B&I), Healthcare, and Colleges & Universities (C&U). Again, remote work (and learning) are largely responsible for those particular segments watching their profit margins tumble.

The strongest performers are: Quick-Service Restaurants (QSR) at 17 percent; Fast Casual at 15 percent); and Midscale, Casual Dining, and Fine Dining, each at 13 percent. Lodging is just below the current average at 12 percent.

Operator Adaptation

Inflation, rising food costs, supply chain issues, labor shortages… Operators are finding ways to cope, and in some situation, thrive.

Unsurprisingly, the vast majority of operators are increasing menu prices. In the past 12 months, 77 percent of operators have raised menu prices at least once.

These increases range from one percent a staggering 30 percent. However, the majority have kept these increases to one to ten percent. Most (31 percent) have implemented increases of no more than five percent. Just one percent of operators boosted prices between 25 to 30 percent.

Of course, raising prices isn’t the only strategy operators have at their disposal. Forty percent of operators are streamlining their menu, reducing the sizes of their menus. However, it’s wise for operators to review their menus at least every three months to eliminate poor performers.

Other strategies include focusing on value for guests (27 percent); utilizing LTOs and launching new menu items (26 percent); eliminating a specific daypart or portion of the menu (25 percent); and making portion sizes small, or “shrinkflation” (18 percent).

There’s much more revealed in Datassential’s latest FoodBytes report. Download your copy today.

Image: Luca Bravo on Unsplash

by David Klemt David Klemt No Comments

Top 10 States Attracting High Earners

Top 10 States Attracting High Earners

by David Klemt

The Florida Theater in Jacksonville, Florida

Using the inflow and outflow data of tax filers earning $200,000 or more, SmartAsset identifies the top ten states attracting high earners.

When it comes to the number-one state, “it’s not even close,” says SmartAsset Advisors. Not surprisingly, several top inflow cities (according to Redfin data) line up with SmartAsset’s top inflow state list.

So, why should this information matter to operators? Plainly, it’s important market information. Population, household income, and age information are crucial considerations when opening any business.

In fact, KRG Hospitality includes such data (and much, much more) when conducting research for our proprietary feasibility, business, and concept plans. Among many elements of opening a restaurant, bar, hotel, or entertainment venue, the income of one’s target audience is crucial.

Knowing where high-income households are leaving and moving to can inform many operator decisions. Where should one open their first concept? Which markets should one consider for expansion? What type of concept will work in a market? What are the threshold price points for menu items? How will this information help inform design choices?

Operators need to recoup their outlay. The income of a concept’s ideal guest should be as important to an operator as knowing their costs.

Top Ten Inflow States

Interestingly, the top state on this list did experience significant outflow in 2020. In fact, the state lost 11,756 high-earning households in 2020.

However, the state also added 32,019 such households, netting 20,263 high earners.

  1. Utah
  2. Idaho
  3. Nevada
  4. Colorado
  5. Tennessee
  6. South Carolina
  7. North Carolina
  8. Arizona
  9. Texas
  10. Florida

Another compelling detail of the states on this list pertains to income tax. In short, three of the states don’t levy personal income tax.

Above, they’re the states in bold: Florida, Nevada, and Texas.

Top 10 Outflow States

So, above are the ten states are seeing the greatest an inflow of high-earning households. Which means, of course, there’s an inverse.

Below, the ten states experiencing the greatest outflow of high earners. Unsurprisingly, SmartAsset deems several entries on the list high-tax states. Also, Washington, DC, is a high-tax area.

Moreover, the list below includes five of the top ten high personal income tax jurisdictions (in bold).

  1. Ohio
  2. Minnesota
  3. Washington, DC
  4. Maryland
  5. New Jersey
  6. Virigina
  7. Massachusetts
  8. Illinois
  9. California
  10. New York

However, it’s not as though these states are seeing a massive exodus of high-earning households. In fact, per SmartAsset, these states have more high-income households than the national average.

Nationally, high-earning households account for less than seven percent of all tax filers. According to SmartAsset, nearly nine percent of tax filers are high-income households in the top ten outflow states.

Image: Trevor Neely on Unsplash

Top