Bar news

by krghospitality krghospitality No Comments

Stand Out with Weird Holidays: Oct. 2022

Stand Out with Weird Holidays: October 2022

by David Klemt

Stay Weird neon sign with purple background

Want to stand out from from other restaurants and bars in your area? Then commit to keeping it weird.

Several “holidays” are set against every date on the calendar, and October is no exception. These holidays range from mainstream (Halloween, anyone?) to “weird.”

Pay attention to the latter to raise eyebrows, carve out a niche for your restaurant or bar, and attract more guests. Why do what everyone else is already doing?

Of course, you shouldn’t try to celebrate every holiday, weird or otherwise. And this month’s list in no way includes every odd holiday.

Focus on the days that are authentic to your brand; resonate with your guests; and help you grab attention on social media.

For September’s list, click here.

October 5: Chic Spy Day

Of course, there’s one holiday this month that simply will not allow anyone to ignore it: Halloween. So, why not lean into it early? Encourage guests to show up looking like a chic spy, perfect your Vesper Martini, and show spy movies. In other words, task your guests with really getting into the spy theme, and create a menu that shows off your creativity as well.

October 6: National Orange Wine Day

No, there aren’t any oranges used in the production of orange wine. Rather, it’s white wine with which the grape skins and seeds remain in contact. The result is an orange hue. And as we all know, orange is one of the key colors of October and Halloween. To celebrate National Orange Wine Day, put some orange wines on your menu.

October 7: National LED Light Day

They say there’s a holiday for just about everything. The existence of this holiday points to that sentiment being accurate.

To wow your guests and get them in the mood for your ultimate October promotion, a Halloween bash, drop food-safe, waterproof LEDs into cocktails for a “spooky,” otherworldly effect.

October 13: National Train Your Brain Day

You know what’s an excellent way to train your brain and stay sharp? Trivia! And do you know what a lot of guests like to do at bars? Trivia! Guest what you should plan for National Train Your Brain Day…

October 17: Wear Something Gaudy Day

I mean, it’s Halloween month and people want to dress up. Guide their costume ambitions by encouraging them to get gaudy and tacky on Wear Something Gaudy Day.

October 18: National Chocolate Cupcake Day

Okay, so this isn’t a weird holiday. There’s nothing strange about chocolate cupcakes. What they are is delicious, and your kitchen staff can always decorate chocolate cupcakes with fall and Halloween themes.

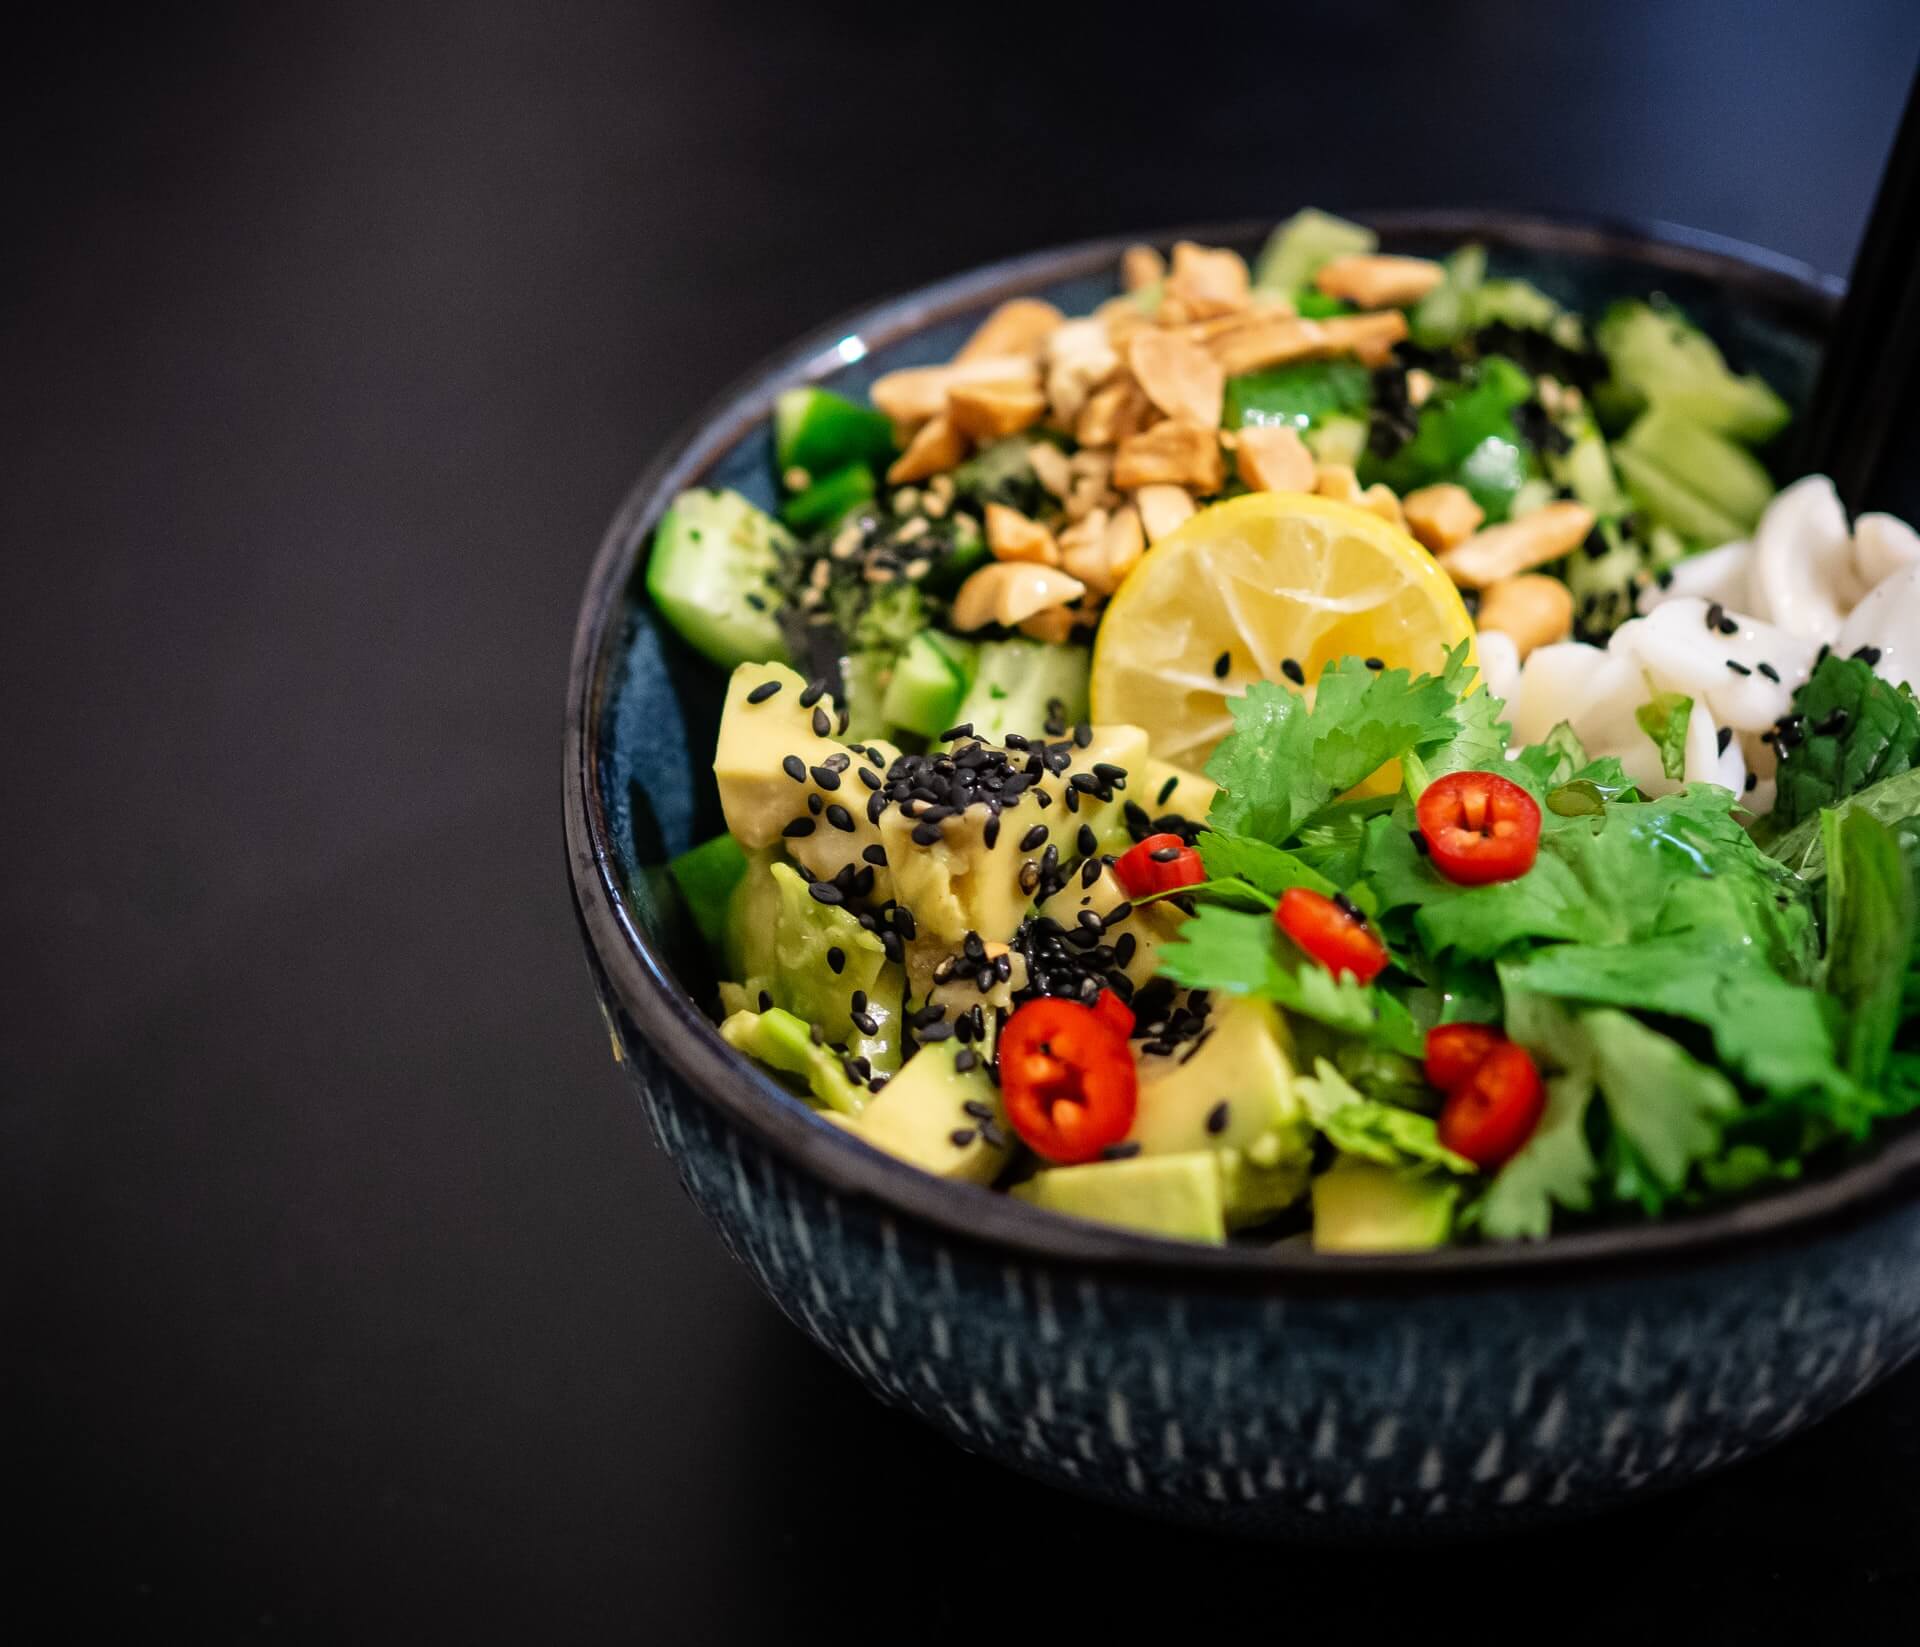
October 20: International Sloth Day

Ah, the sloth. It really has the right idea most days: slow down. On this day, encourage your guests to slow down and relax at your restaurant or bar. Comfort food, delicious beer, and classic brunch cocktails are the order of the day.

October 21: National Count Your Buttons Day

There are several ways to celebrate this day. However, I think a good, old-fashioned “Guess How Many Buttons are in This Jar” contest is the way to go. Give away a bottle, a meal, a bar tab, etc. The sky’s the limit.

October 22: National Make a Dog’s Day

Is your business dog-friendly? Can your kitchen come up with dog-safe menu items? Then encourage your guests to come in and pamper their pooches.

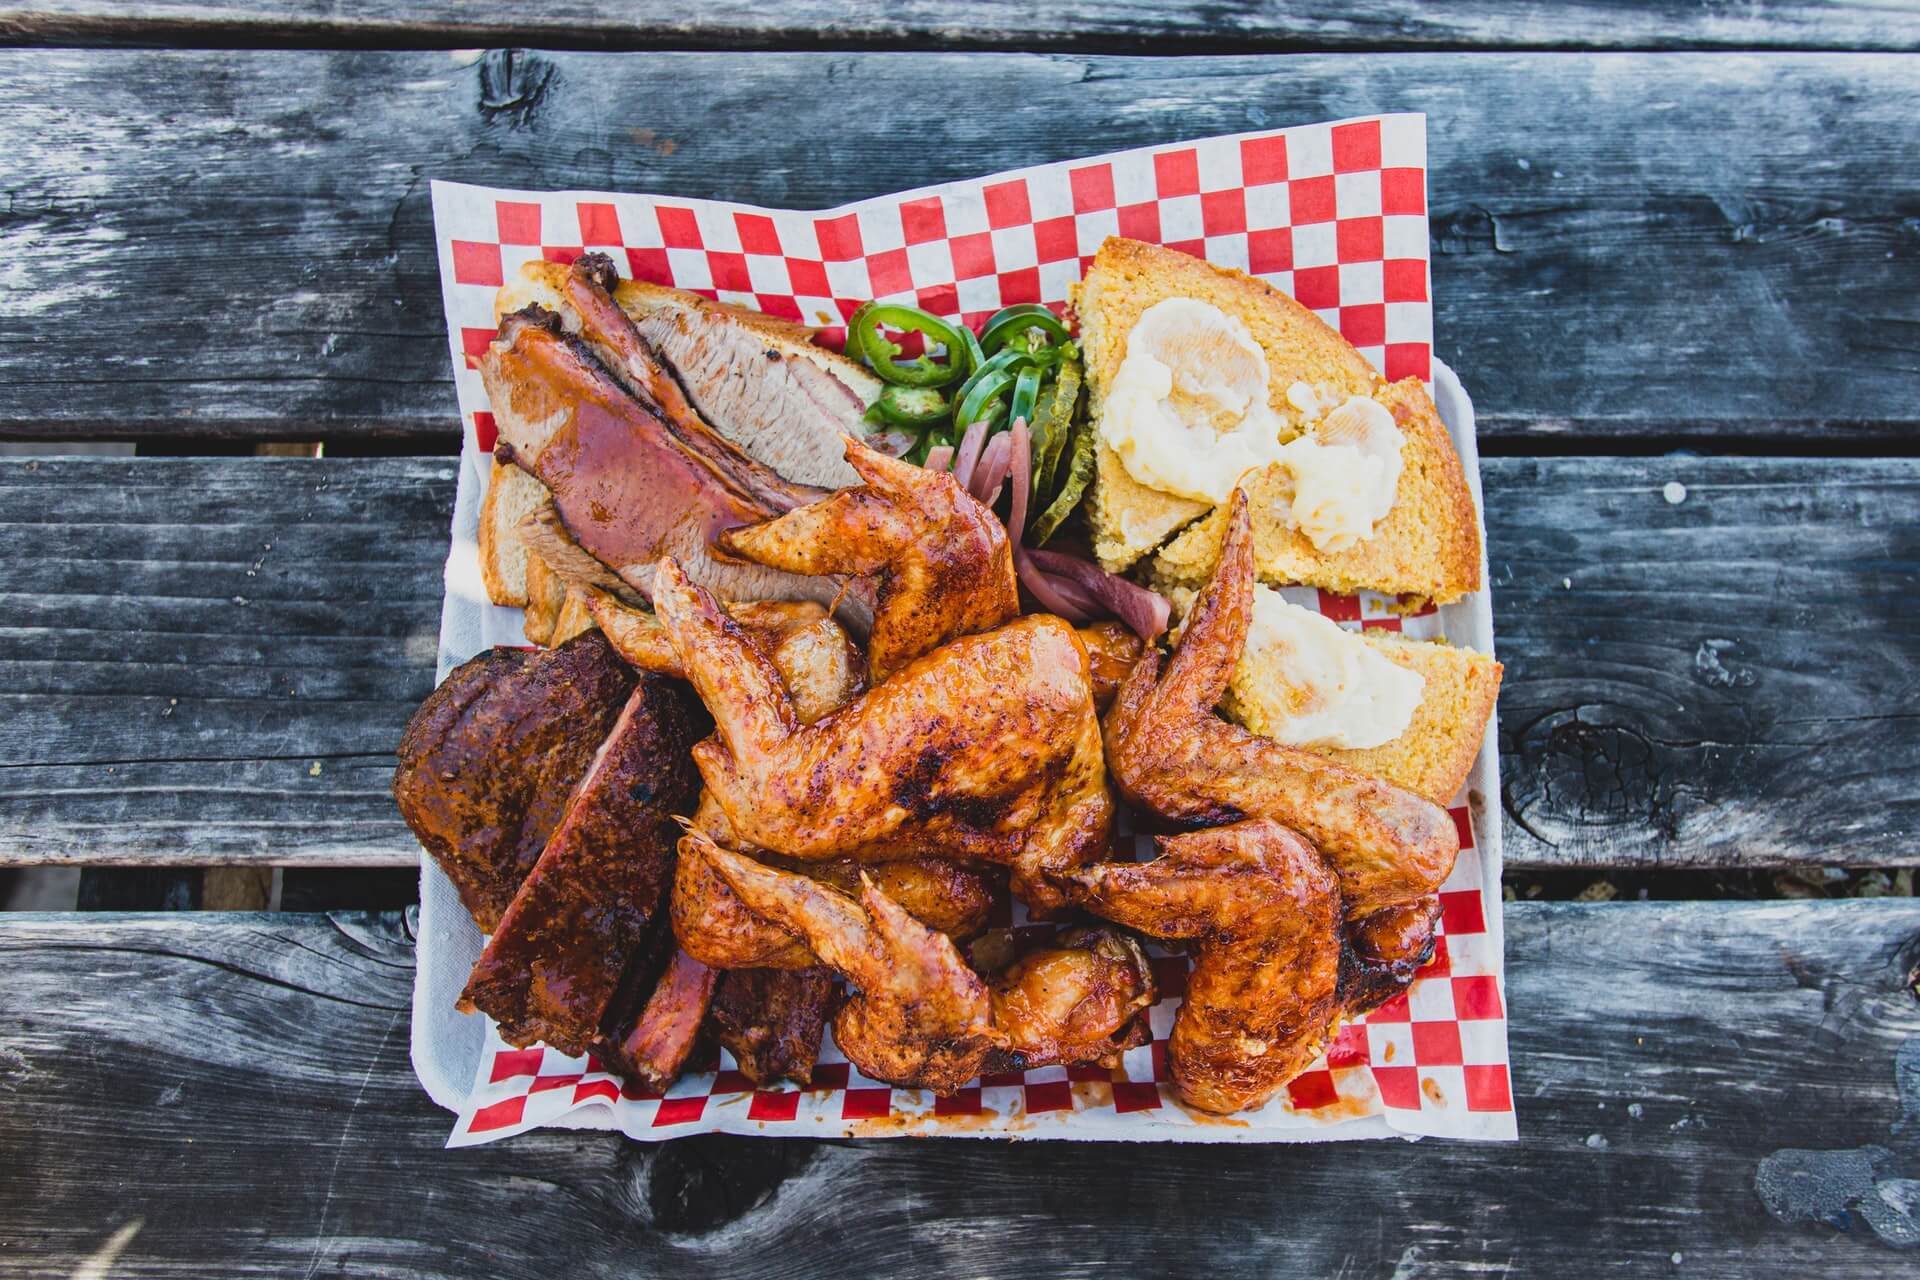
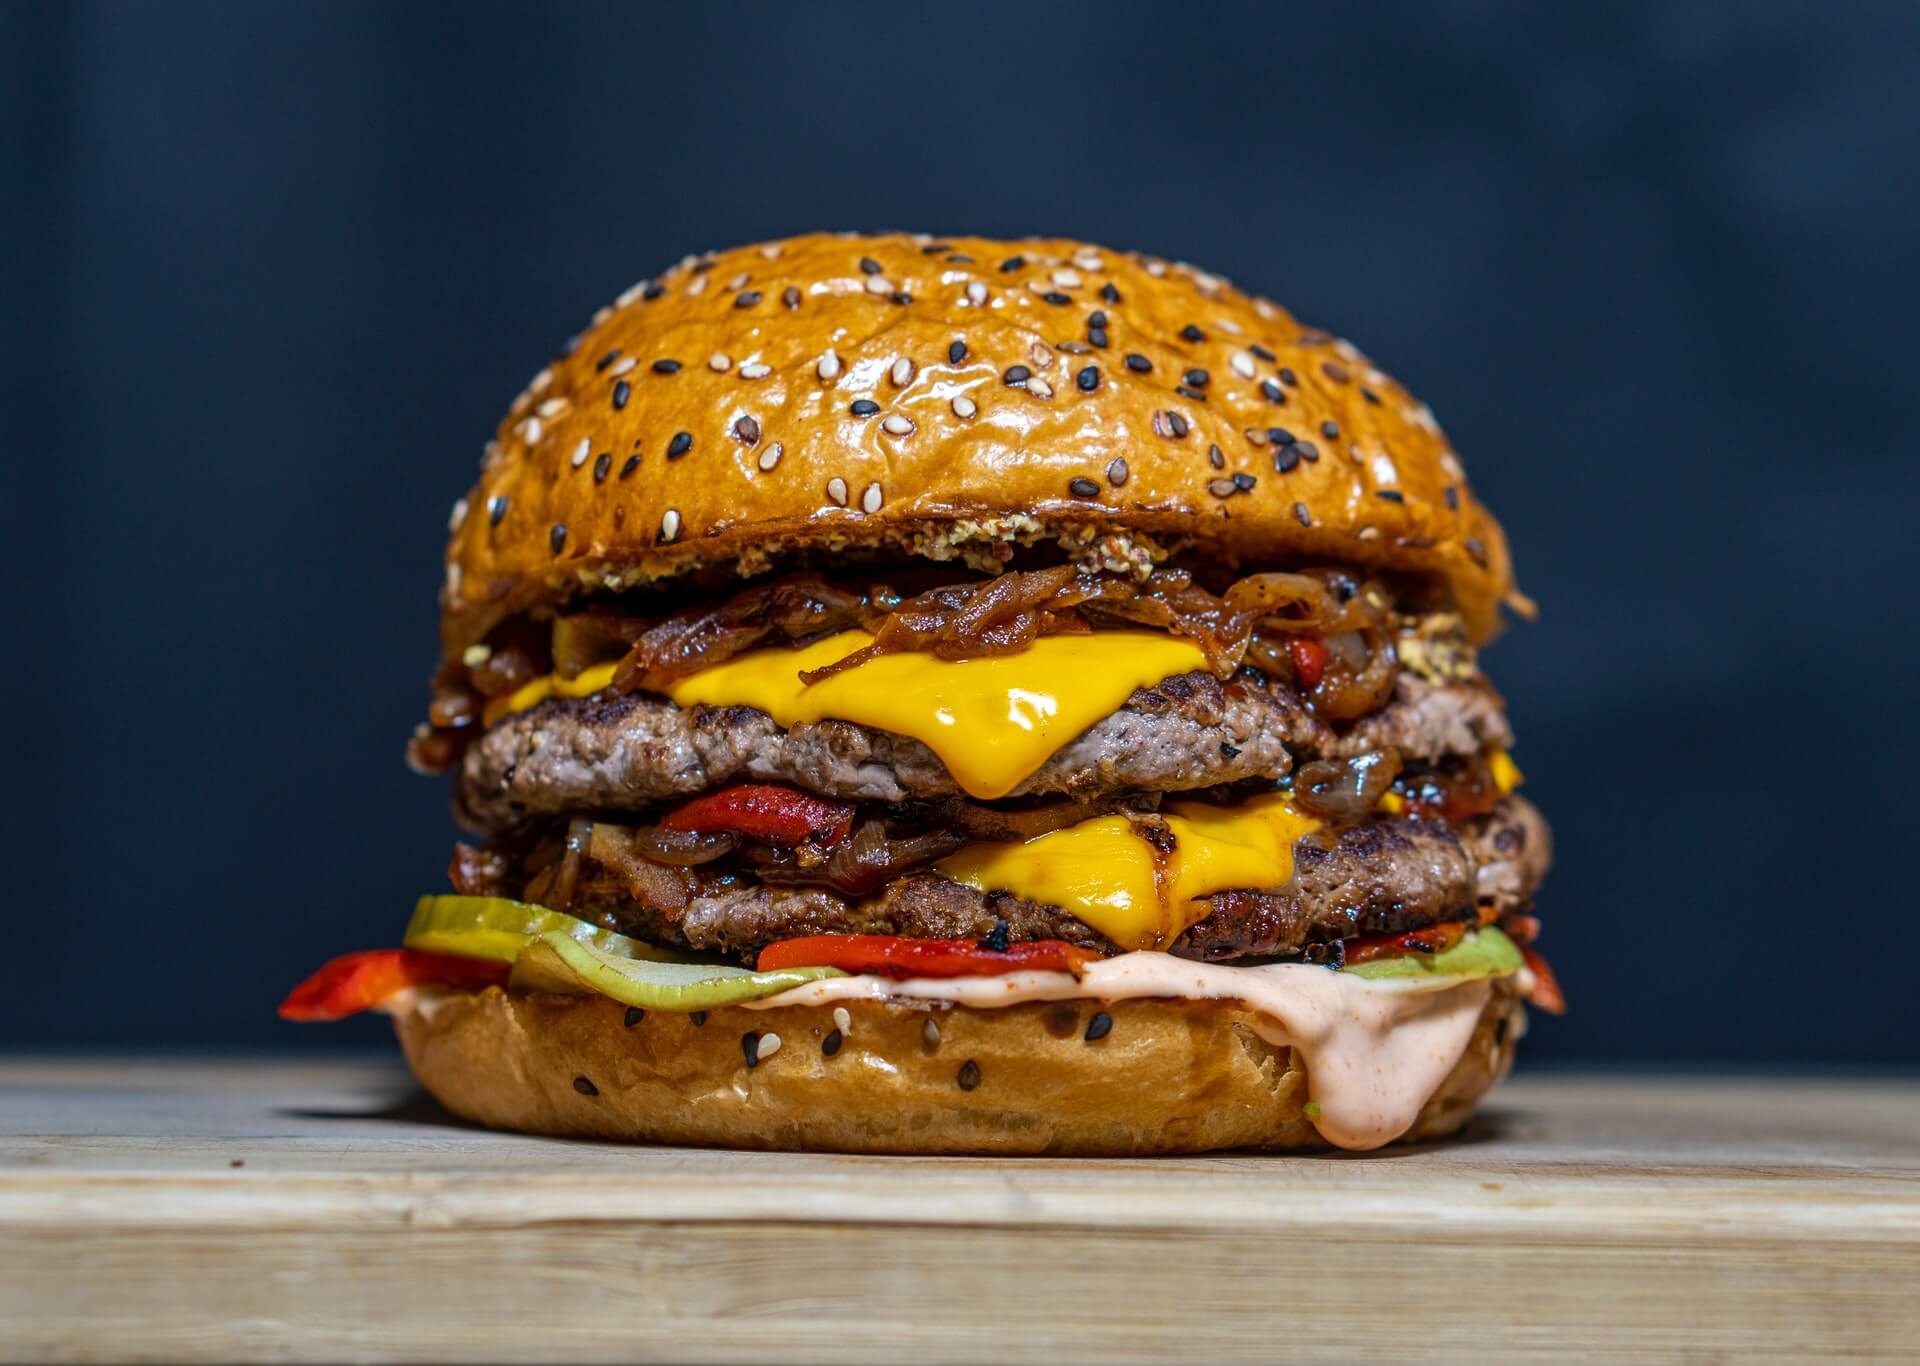
October 25: National Greasy Food Day

There’s no point in competing or programming against Halloween. Not for most operators, anyway. So, celebrate this debaucherous, indulgent day with greasy bar and comfort food ahead of your Halloween promotion.

Image: Dan Parlante on Unsplash

by David Klemt David Klemt No Comments

Operators & Guests Respond to Rising Costs

Operators & Guests Respond to Rising Costs

by David Klemt

Canadian dollar bills

Everything is more expensive these days and both operators and consumers have their own ideas for addressing rising costs.

To gather and share insight into people’s mindsets, Restaurants Canada conducted and commissioned two surveys.

For one, the industry research and advocacy organization surveyed operators. The focus was on how much operators anticipated increasing their prices.

On the other side, Restaurants Canada commissioned Angus Reid for a survey focusing on consumers. This survey revealed potential traffic slowdowns and perceived value for money.

For your own copy of Restaurant Canada’s 2022 Foodservice Facts report, click here.

QSR vs. FSR: Consumers

As an operator, converting first-time visitors into repeat guests is paramount. Equally as important: increasing visit frequency per guest.

Of course, an immediate byproduct of rising costs is consumers pulling back and reevaluating their spending. Oftentimes, dining out is one of the first costs consumers slash in order to save money.

Therefore, operators always face the risk of reduced traffic and even losing some guests permanently when they raise prices. However, this is often a necessary risk to take to combat rising costs.

So, how dire is the situation among Canadian consumers currently? Or at least, how did they feel in Q2 of this year? Angus Reid conducted a survey of consumers to find out, and the results can be found within the 2022 Foodservice Facts report.

First, let’s look at visit frequency for QSRs and FSRs. Before we begin, 12 percent of survey respondents answer that they “don’t know for sure” if rising prices will affect their visit frequency for either QSRs or FSRs. Not helpful.

For QSRs, 19 percent of respondents say an increase in prices won’t impact their visit frequency. Thirty-six percent anticipate visiting “a little less often,” while 32 percent will visit much frequently.

As for FSRs, 16 percent of survey respondents won’t change their visit frequency. However, 37 percent anticipate visiting FSRs much less often. Nearly as many, 36 percent, will visit a bit less frequently.

Interestingly, however, is perceived value. More FSR guests believe they receive excellent or good value for their money than they do from QSRs. More QSR guests believe they receive fair, poor, or very poor value for their money.

Overall, though, 90 percent of Canadian consumers feel positive toward the value they receive from QSRs and FSRs.

QSR vs. FSR: Operators

Clearly, it’s good news that the vast majority of Canadians believe they receive good value for their money when dining out.

Nobody enjoys paying more but it appears that both QSRs and FSRs in Canada can increase their prices. At least, they can do so for now while consumers are mostly understanding about inflation.

Restaurants Canada asked QSR and FSR operators a simple but revealing question for their 2022 Foodservice Facts report. The question? How much higher do operators expect to increase their prices by the end of Q4 of this year in comparison to last year?

The majority of operators in both categories anticipate they’ll increase menu prices by more than seven percent. Twenty-seven percent of QSR operators have that expectation. That number rises to 35 percent for FSR operators.

Twenty-two percent of QSR operators anticipate raising prices five to seven percent before the end of 2022. In comparison, 32 percent of FSR operators expect to raise prices in the same range.

At the moment, Canadian consumers appear to be willing to endure these increases. However, it’s likely they expect prices to drop back to “normal” (pre-pandemic prices) or close to it sometime in 2023. That is, unless Canada slides into recession.

Image: PiggyBank on Unsplash

by David Klemt David Klemt No Comments

Restaurants in Canada: Daypart Performance

Restaurants in Canada: Daypart Performance

by David Klemt

White clock on red background

For both in-person dining and off-premise consumption, more Canadian consumers are ordering from restaurants across all dayparts.

As Restaurants Canada points out in their latest report, traffic and sales remain lower than pre-pandemic levels. However, there are reasons to be positive.

For one example, Restaurants Canada predicts 2022 sales to return to pre-pandemic levels by the end of the year. The foodservice research and advocacy organization’s 2022 Foodservice Facts report provides another positive outlook.

Just looking at Q1 of this year versus Q3, all dayparts are seeing increases in traffic.

To read more about the report and grab your own copy, follow this link.

Numbers Tell the Tale

Per Restaurants Canada, the breakfast daypart slid significantly in 2020. During that time, it fell 20 percent that year.

For the first half of this year, however, Restaurants Canada reports that breakfast traffic is just four percent lower in comparison to 2019.

On a positive note, the breakfast daypart has risen steadily from March of this year to July, or Q1 versus Q3. In fact, all dayparts have grown.

According to Restaurants Canada, 43 percent of Canadians ordered breakfast from restaurants in March 2022. That number grew to 50 percent by July of this year.

In terms of snack purchases, 55 percent of Canadian consumers made purchases from restaurants. By July, that percentage rose to 62 percent.

Continuing along, 64 percent of Canadians placed lunch orders in March. Four months later, that number had increased to 73 percent.

Per the 2022 Foodservice Facts report, a significant percentage of Canadians are placing lunch and snack orders. In fact, Restaurants Canada says that Canadians are making purchases from restaurants during those dayparts two to three times per month.

Of course, there’s one more daypart we need to discuss…

Dinner is King

By the numbers, the dinner daypart is outperforming all others in Canada.

In March of 2022, 85 percent of Canadians had placed dinner orders at restaurants. That number rose to 87 percent in April but dipped to 86 percent in May.

However, dinner saw growth again in June and July, rising to 88 and then 89 percent, respectively.

As the numbers show, dinner orders are outpacing lunch orders 14 percent. Snacks are being outpaced by dinner by nearly 30 percent. Of all dayparts, breakfast is the weakest.

In fact, dinner outperforms breakfast by nearly 40 points. This makes sense when we consider the work-from-home effect.

More people working from home means, in theory, many less people commuting to work. Restaurants that once saw great breakfast daypart traffic are seeing a significant dropoff. Less people commuting means less people popping into a restaurant for breakfast.

It appears that instead, people are clocking in, working until break time, and then going to get a snack. And when lunch rolls around, why not place an order for lunch?

Naturally, after working all day, people are tired or eager to meet up with friends and family to socialize and decompress. So, dinner ruling the daypart roost makes complete sense.

In other words, operators looking to streamline should consider this Restaurants Canada data. The dayparts that require the most labor currently are lunch and dinner, so operators should plan accordingly if that’s viable for their business.

Image: CHUTTERSNAP on Unsplash

by David Klemt David Klemt No Comments

2022 World’s 50 Best Bars: 51-100

2022 World’s 50 Best Bars: 51-100

by David Klemt

Closeup of bartender's hand pouring shot

As we approach the ceremony to announce the 2022 World’s 50 Best Bars we now know which bars across the globe are on the 51 to 100 list.

It’s crucial to keep in mind that these are 50 of the most impressive bars not just in the US, not just in Canada, and not just in North America. Rather, these are among the absolute best bars in the world.

Of particular note, Singapore continues to prove itself as a dominant cocktail destination. There are eight bars on the 2022 51 to 100 list, and I predict that at least three more from Singapore will appear on the 1 to 50 list.

Also, the UK and Cape Town each claim four spots among the best 51 to 100 bars, and Paris boasts three. Operators, bar professionals, and tourists should keep their eyes on Cape Town as it continues to transform into a cocktail hot spot.

Among the 51 to 100 list, four are from the US and, sadly, none are in Canada. Overall, 15 bars on this list are new entries, as are five of the cities represented.

1 to 50: One Week Away

Of course, this leaves us all with a few important questions.

When will we find out about bars 1 through 50? Which bars are on that list? And which bar will be number one this year?

Well, I can answer one of those questions for you. A week from now, October 4, the World’s 50 Best Bars will announce the top 50 bars in the world during a ceremony in Barcelona, Spain.

To learn more about the World’s 50 Best Bars and this year’s ceremony, listen to Bar Hacks episode 82 with Mark Sansom. Also, make sure you’re following the World’s 50 Best Bars on Twitter and Instagram.

For now, scroll down to check out bars 51 to 100. Congratulations to the bars below!

The World’s 50 Best Bars 2022: 100 to 51

  1. Sin + Tax (Johannesburg)
  2. Tesouro (Goa)
  3. Zapote Bar (Playa del Carmen)
  4. Tag (Kraków)
  5. The Dead Rabbit (New York)
  6. The Bamboo Bar (Bangkok)
  7. Sweet Liberty (Miami)
  8. Mace (New York)
  9. The House of Machines (Cape Town)
  10. Antique American Bar (Bratislava)
  11. Republic (Singapore)
  12. Donovan Bar (London)
  13. Art of Duplicity (Cape Town)
  14. Re (Sydney)
  15. Freni e Frizioni (Rome)
  16. Danico (Paris)
  17. Le Syndicat (Paris)
  18. Bar Goto (New York)
  19. Indulge Experimental Bistro (Taipei)
  20. Lost & Found (Nicosia)
  21. Dead End Paradise (Beirut)
  22. Vesper (Bangkok)
  23. Röda Huset (Stockholm)
  24. The Court (Rome)
  25. Candelaria (Paris)
  26. Side Hustle (London)
  27. Nutmeg & Clove (Singapore)
  28. Camparino in Galleria (Milan)
  29. Three Sheets (London)
  30. Tjoget (Stockholm)
  31. La Sala de Laura (Bogotá)
  32. No Sleep Club (Singapore)
  33. Hero Bar (Nairobi)
  34. Atlas (Singapore)
  35. El Barón (Cartagena)
  36. Analogue (Singapore)
  37. Brujas (Mexico City)
  38. The SG Club (Tokyo)
  39. Tan Tan (São Paulo)
  40. Presidente (Buenos Aires)
  41. Caretaker’s Cottage (Melbourne)
  42. Schofield’s (Manchester)
  43. Mimi Kakushi (Dubai)
  44.  MO Bar (Singapore)
  45. Quinary (Hong Kong)
  46. 28 HongKong Street (Singapore)
  47. La Factoría (Old San Juan)
  48. Cause Effect Cocktail Kitchen (Cape Town)
  49. Barro Negro (Athens)
  50. Sago House (Singapore)

Image: Louis Hansel on Unsplash

by David Klemt David Klemt No Comments

Canada’s Restaurant Labor by the Numbers

Canada’s Restaurant Labor by the Numbers

by David Klemt

Chef inside commercial kitchen

While there are positive signs for Canada’s foodservice industry, recruiting and retaining labor continues to be a challenge.

Unfortunately, this isn’t a challenge unique to Canada. Operators throughout North America and indeed across the globe are facing labor shortages.

Restaurants Canada addresses this topic in their 2022 Foodservice Facts report. The non-profit research and advocacy group predicts sales will reach pre-pandemic levels by Q4 of this year.

However, restaurants, bars, and nightclubs may have to achieve traffic and revenue growth despite a significant labor deficit.

Please click here to access the 2022 Foodservice Facts report yourself.

Labor Shortage by Category

In their latest report, Restaurants Canada crunches the numbers for three distinct venue categories. These are quick-serve restaurants, full-service restaurants, and bars and nightclubs.

The organization finds that QSRs and FSRs are facing the greatest shortages. In fact, in response to a survey from May of this year, at least half of QSRs and FSRs aren’t operating with fulls staffs.

For QSRs, 52 percent of respondents say they perceive restaurants and bars they’ve visited to be understaffed. A bit over a third (36 percent) think staffing is “about right.” Unhelpfully, 12 percent “don’t know” if restaurants and bars have enough staff.

So, let’s switch gears to FSRs. Precisely half of survey respondends say restaurants and bars don’t have enough staff. Just like their QSR counterparts, 36 percent say that staffing seems to be at the ideal level. Fourteen percent respond that they “don’t know,” which doesn’t tell us much.

Per Canadians who responded to Restaurants Canada’s survey, bars and nightclubs are fairing better…at first. Frustratingly, a staggering 37 percent of respondents “don’t know” if bars or nightclubs have appropriate levels of staffing. Thirty-two percent think they’re understaffed, 31 percent think staffing levels are “about right.”

Industry professionals are probably already putting two and two together here. As long as guests receive the level of service they expect, from greeting to speed of service, to closing out their check, they think things are fine. If they’re made to wait longer than they want, they’ll likely say a restaurant, bar or nightclub doesn’t have enough people on shift.

Labor Shortage by Role

Okay, so the May 2022 Restaurants Canada wasn’t entirely helpful. It still provides interesting insight. That is, we know how guests perceive staffing in at least most instances.

So, let’s get down to hard numbers: shortages in specific roles throughout the industry.

Here, Restaurants Canada provides compelling information, even if it’s not what we want to see. In comparison to 2019, every role is down by thousands of people. In some cases, tens of thousands.

Below you’ll find the deficits by role:

  • Foodservice supervisors: -3,100
  • Chefs: -10,900
  • Bartenders: -17,600
  • Maîtres d’hôtel and hosts/hostesses: -21,100
  • Restaurant and foodservice managers: -22,400
  • Food counter attendants, kitchen helpers, and related support occupations: -43,200
  • Cooks: -44,400
  • F&B servers: -89,500
  • Other: -18,800

Add that up and that’s a shortage of 271,000 people throughout Canada’s foodservice industry. For further context, the industry boasted 1,265,700 workers. In 2021, the industry was down to 994,700.

Unfortunately, from 2020 to 2021, just 4,100 jobs were recovered, according to Restaurants Canada. This situation clearly shows that operators need to change their approach to staffing.

Now, more than ever, operators must focus on effective recruitment, onboarding, and retention. For tips on making improvements, click here. To learn how to implement employee surveys to boost retention and avoid costly turnover, click here.

Image: Brian Tromp on Unsplash

by David Klemt David Klemt No Comments

Addressing Substance Abuse in the Industry

Restaurant Business Articles Address Substance Abuse

by David Klemt

Two full shot glasses on a bar

Two revealing Restaurant Business articles paint a startling picture of the industry’s struggles with drug and alcohol abuse.

Unfortunately, the subject of substance abuse in restaurants and bars isn’t new. This has long been a pervasive, prevalent issue in the hospitality industry.

There are, as Restaurant Business authors point out, several reasons our industry continues to grapple with substance abuse.

Since we’re nearing Sober October, this topic’s importance seems particularly poignant. Of course, the health of hospitality industry professionals should always be a paramount operator concern every day. It shouldn’t take a specific month for us to address this issue, just to forget about it after 31 days of consideration.

Hospitality workers should feel supported by the business owners and operators for whom they work. Additionally, they should feel safe among the leadership team and their fellow team members. In part, this feeling of security and safety should manifest in being comfortable speaking about substance abuse in the workplace.

A significant element of creating a supportive, safe, and healthy culture is removing the stigma of struggling with substance abuse that persists today. How can operators, leadership, and team members help one another if they make peers feel shame for struggling with drugs or alcohol?

A crucial step toward addressing the issue of substance abuse is fostering a culture of respect, support, and safety. If anyone in any role—from ownership and leadership to front of house and back of house—feels as though they can’t speak with someone safely about their struggles, we can’t address this topic effectively. And if we can’t address it in a meaningful way, we can never effect real change that can improve and save lives.

Pervasive Struggles

A Restaurant Business article from last week addresses substance abuse and culture. “How Restaurants Feed a Culture of Substance Abuse” reveals disturbing statistics.

At the start of their article, editors Peter Romeo, Heather Lalley and Joe Guszkowski share a horrific story. In February of this year, Colorado law enforcement found six adults and a toddler in an apartment. The six adults had all overdosed on fentanyl-laced cocaine; five had died. All six adults worked in chain or independent restaurants.

Four years ago, Delaware officials investigated the state’s opioid crisis. They found 10 percent of Delaware residents who died due to opioid overdoses were foodservice workers. According to Restaurant Business, state officials concluded that foodservice experienced a higher rate of opioid deaths than any other industry.

Among the most-shocking revelations in the Restaurant Business article pertains to the US workforce as a whole. Frustratingly, the US government hasn’t researched illicit drug use in the workforce since 2015. So, for all we know, the numbers I’m about to share have either increased or decreased.

In a typical month in 2015, 8.6 percent of the US workforce was using illicit drugs. However, that number pales in comparison to the rate of illicit drug use among restaurant and hotel workers: 19.1 percent.

Examining Substance Use Disease (SUD), a term encompassing drug and alcohol abuse, the numbers expose the weight of our industry’s struggle. In 2015, 9.5 percent of the US workforce suffered from SUD. For restaurants and hotels? That number was nearly double: 16.9 percent, higher than any other industry.

Fentanyl Deaths

Restaurant Business Editor-in-Chief Jonathan Maze reveals how “restaurants are ground zero” for fentanyl overdoses.

Fentanyl is cheap to produce and transport. It doesn’t take much to be deadly. And most people who have the misfortune of consuming it do so unwittingly. As it turns out, drug dealers lace all manner of other drugs with it because it’s so powerful. So, cutting drugs with fentanyl is more “cost effective” for drug dealers.

This particular excerpt from Maze’s “As Fentanyl Deaths Soar, Restaurants Are Ground Zero” is startling: “Throughout the country, restaurants and bars are such common places for overdose deaths among customers that advocates are training bartenders and servers to administer Narcan, a medication used to treat opioid overdoses. They are also becoming sources for fentanyl test strips so customers can see if the drugs they’re taking are laced with the powerful drug.”

Further, this troubling excerpt: “The fentanyl epidemic is particularly troublesome in the restaurant industry given the generally high rate of drug use among workers. Restaurant work is notoriously intense. The hours are long and late, and employees are on their feet all day. They often get hurt on the job and can turn to painkillers, legal or otherwise.”

When I say that we need to address substance abuse in our industry to save lives, I’m not employing hyperbole. I mean it quite literally.

Please take the time to read these two Restaurant Business articles in their entirety. We need to take action today.

Image: cottonbro via Pexels

by David Klemt David Klemt No Comments

Swipe Fees Cost Over $77 Billion in 2021

Swipe Fees Cost Merchants Over $77 Billion in 2021

by David Klemt

Close up of stack of credit cards

A bill that intends to lower the credit card fees merchants pay by creating more competition within the industry is before Congress.

This bill, the Credit Card Competition Act of 2022, has bipartisan support. The two sponsors behind it are Sens. Richard Durbin (D-IL) and Richard Marshall (R-KS).

Of particular note, the bill seeks to amend the Electronic Fund Transfer Act. Specifically, the amendment targets the networks that merchants use to process electronic credit card transactions.

In short, banks that issue credit cards would have to merchants at least two processing networks. According to experts in this space, the bill prohibits banks from making those networks Visa and MasterCard.

Billions in Fees

So, why are Visa and MasterCard in the crosshairs of this bill?

According to the Merchants Payments Coalition (MPC), Visa and MasterCard control 87 percent of credit (and debit) card markets. Per the MPC, Visa and MasterCard account for about 576 million credit cards.

In the U.S. alone, transactions amounted to $3.49 trillion in 2021. Eye-wateringly, those transactions were accompanied by $77.48 billion in merchant fees for the two processing behemoths in the same year.

For additional context, Visa and MasterCard swipe fees totaled $61.6 billion in 2020. That represents an increase of 137 percent over the decade prior. Adding the merchant fees for all cards, the 2020 total was $110.3 billion, which is an increase of 70 percent from the previous ten years.

As veteran operators are well aware, swipe fees are among the highest costs for restaurants and bars.

Merchants Payments Coalition Sends Letter to Congress

Compellingly, the MPC is urging Congress to investigate the Visa-MasterCard duopoly. In their view, the two processors’ dominance is stifling competition; harming business owners and consumers; and contributing to inflation.

“The two giant card networks and their partner mega-banks routinely use their market power to stifle competition and charge merchants the highest swipe fees in the industrialized world,” reads the MPC’s letter to Congress.

Further, the letter states, “It is difficult to imagine any other market in the U.S. economy in which two entities set prices for thousands of businesses that should be competitors. That lack of competition or downward pricing pressure has resulted in out-of-control swipe fees and increases inflation throughout the economy.”

The MPC is urging Congress to act quickly and effectively: “It is crucial for Congress to act swiftly and implement real reforms to bring true competition, transparency and equity to the U.S. payments market.”

National Restaurant Association Supports the Bill

Interestingly, the National Restaurant Association says they’re working with the MPC.

The NRA is also working with other organizations to drum up support for the the Credit Card Competition Act of 2022.

You can read about their support for the bill on their website. Additionally, you can tell Congress to pass the bill here. As it stands currently, no action beyond the bill’s introduction to the Senate on July 28 has taken place.

Image: Pixabay

by David Klemt David Klemt No Comments

3 Bar Hacks Episodes for Sober October

3 Bar Hacks Episodes for Sober October

by David Klemt

Bartender straining cocktail

We’re just two weeks away from Sober October so here are three Bar Hacks podcast episodes to get you ready for this important month.

Over the course of 100-plus episodes we’ve spoken with a handful of non-alcohol brands. These, along with other alcohol-free brands, should be on your radar.

In fact, they deserve spots on your backbar and placement on your menus. The latest estimate is that around 40 percent of Americans don’t consume alcohol. In Canada that number is roughly 33 percent.

However, those numbers don’t paint a complete picture. Over the past few years there has been increasing interest in “sober curiosity.” In this movement, people abstain from drinking alcohol from time to time rather than abstaining permanently.

Now, we tend to associate the month of January with sobriety, either permanent or temporary. Clearly, however, October is also a month where people choose to not imbibe.

The Sober Guest Experience

The following should go without saying but let’s cover it anyway. Some sober people do, in fact, spend time in bars and nightclubs.

Just as that should go without saying, so should this: Your sober guests deserve every bit as great an experience as guests who are drinking alcohol.

Moreover, sober guests deserve a guest experience free of discomfort or isolation. In short, you should seamlessly provide the same level of service at the bar to sober guests as those who enjoy alcohol.

No, it’s not enough to menu water, sugary sodas, lemonade, and tea. Sober guests should be comfortable coming to your bar. Like guests who consume alcohol, sober guests should be able to order a drink that doesn’t make them feel different or singled out.

So, put quality non-alcohol beers on your menu. Create a number of signature zero-proof cocktails. Serve both with the same attention to detail as presentation as their full-alcohol counterparts.

“I’m a professional, I want to create,” says Paul Mathew, founder of alcohol-free aperitif brand Everleaf and Bar Hacks guest. “I want to do something I’m proud of.”

Approach your alcohol-free program the same way as Mathew, a bartender and operator himself. Be professional, be creative, and be mindful of your sober guests’ experience.

Episode 28 with Tim Rita

Lyre’s Spirits crafts alcohol-free spirits that masterfully mimic their full-proof counterparts. Host David Klemt sits down with Lyre’s brand ambassador, bartender, and buddy Tim Rita to chat about the brand. In this episode you’ll learn about one of the fastest-growing brands in one of the fastest-growing beverage categories. For the alcohol-free Mai Tai mentioned on the podcast, click here.

Listen now.

Episode 31 with Ted Fleming

Ted Fleming, entrepreneur and CEO and founder of Partake Brewing, stops by the Bar Hacks podcast to talk with host David Klemt. The two discuss the founding of Partake Brewing and the importance and growth of the non-alcohol beer category. Also, how operators can succeed with non-alc, advice for entrepreneurs, and more. Visit the Partake Brewing website to learn more. Connect with Partake on InstagramTwitter and Facebook.

Click here to listen.

Episode 81 with Paul Mathew

Paul Mathew, bartender, bar owner, and founder of Everleaf, sits down with Bar Hacks podcast co-host David Klemt. In this fun and informative episode, Paul shares his journey through bartending and bar ownership, and his entry into the drinks business. Non-alcoholic aperitif brand Everleaf is the culmination of Paul’s many years as a conservationist botanist, knowledge of plants, and nearly 30 years in the bar business.

The Everleaf portfolio consists of three unique expressions and a new RTD line. Shortly, Everleaf will begin distribution throughout the United States, and there are plans for Canada and Australia in the future. To learn more, vist the Everleaf website and follow Everleaf on Instagram and Facebook.

Listen to this episode here.

Image: Jia Jia Shum on Unsplash

by David Klemt David Klemt No Comments

Pumpkin Spice Season Descends Upon Us

Pumpkin Spice Season Descends Upon Us

by David Klemt

Jack o' lantern and smoke

Once again, the unstoppable march of the spooky season is upon us, bringing with it a frightening assortment of pumpkin spice items and expectations.

In the blink of an eye, hordes will descend on your restaurant or bar. “Pumpkin spiiiiiice,” they’ll croak.

Okay, so that’s overly dramatic. For the most part, pumpkin spice season is anything but scary. And really, very few people will transform into singularly focused pumpkin spice zombies.

However, fall is nearly here. So, you do need to finalize your fall/autumn menu. Beginning in September, that really does mean considering offering at least one pumpkin spice LTO item.

Interestingly, though, pumpkin spice may not deserve its perception as the flavor of fall. According to Datassential, there are ten flavors that index high enough to give pumpkin spice a challenge for the fall throne.

What are they? Well, it just so happens that Datassential has those answers, along with a bit of useful advice.

Lord of the LTO

Recently, Datassential released “Food Industry Trend Report: 2022 Pumpkin Spice Season.” As the research firm points out, pumpkin spice seems to be encroaching on summer more each year.

How far away are we, I wonder, from pumpkin spice claiming summer for itself? Will we be subjected to pumpkin spice dry rubs at summer barbecues? Is some intrepid operator going to create a pumpkin spice lemonade?

Those terrifying questons aside, pumpkin spice season coming earlier means more opportunities to benefit from LTOs. Just as it seems that pumpkin spice is descending upon us earlier and earlier, it also seems to dominate the LTO space.

In fact, per Datassential research, major chains executed 174 pumpkin spice LTOs. Now, that’s still with a five-percent drop in menuing for pumpkin space over the past 12 months. Further, that number doesn’t include small, regional chains and independents who also launched pumpkin spice LTOs.

Of course, there are also other fall flavors that deserve a place on operators’ menus. And they’re perfectly cromulent as LTO drivers.

Fall Flavor Favorites

To inspire operators to create LTOs that entice consumers this fall, Datassential has identitied ten flavors on which to focus. Helpfully, they separate them into two main categories.

Top five sweet fall flavors:

  • Vietnamese cinnamon
  • Spicy ginger
  • Allspice
  • Eggnog
  • Pumpkin pie

Top five savory flavors:

  • Coconut milk
  • “Oktoberfest”
  • Mustard cream
  • Turkey gravy
  • Cranberry sauce

Personally, I can see operators and their teams needing to get creative to leverage mustard cream and turkey gravy. Interestingly, Datassential suggests a few flavors not on either list above.

According to their report, Datassential expects apple and blood orange to be popular for LTOs this year. According to the firm, apple was popular last year. When it comes to blood orange, Datassential says 38 percent of consumers like or love the flavor.

Whichever flavors you choose, Datassential has the following advice, which we co-sign: Ensure your LTOs are fresh; make sure they’re easy and quick to make; and don’t discount them. In fact, you should create premium LTOs that come with a premium price.

Image: Colton Sturgeon on Unsplash

by David Klemt David Klemt No Comments

Discover the World’s 50 Best

Discover the World’s 50 Best with this Helpful Tool

by David Klemt

Red neon hand sign over a cocktail

You may be familiar with the World’s 50 Best Bars and the World’s 50 Best Restaurants rankings, but do you know about their Discovery tool?

On episode 82 of the Bar Hacks podcast, Mark Sansom mentions this powerful and helpful tool. Sansom, for those who have yet to listen to the episode, is the content director for the World’s 50 Best Bars.

Put plainly, the World’s 50 Best rankings are powerful and influential. As Sansom says, when the organization shouts, people listen. Making the 100 to 51 or 50 to one list can change a restaurant or bar’s business. Exposure, traffic, revenue, status, longevity… The restaurant and bar lists are game changers for those who work hard enough to earn a spot.

However, the World’s 50 Best, as the name suggests, ranks just a few hundred restaurants and bars:

So, the organization put their heads together. What if they could increase the chances that thousands of venues could find themselves on the radar of millions of people across the world? What could that do for a much larger swathe of deserving restaurants and bars?

50 Best Discovery

Enter, the 50 Best Discovery database.

“That’s the more egalitarian face of 50 Best, and that’s where we’re really excited about moving in the future,” says Sansom.

According to Sansom, there are more than 2,500 restaurants and bars just waiting for, well, discovery. It is, as he says, “the world’s most authoritative database on restaurants and bars anywhere.”

Compellingly, this is more than just a lonely input field chilling out on a webpage. Rather, there’s also a slideshow of 50 Best editor’s picks to scroll through. In using the tool for this article I discovered the following venues without even scrolling:

  • Franklin Barbecue in Austin, Texas
  • Cal Pep in Barcelona, Spain
  • Amass in Copenhagen, Denmark
  • Fyn Restaurant in Cape Town, South Africa

In other words, this tool is aptly named: The mission is discovery, and I’d say that mission is well on its way to achievement.

North America Results

Given the potential of the 50 Best Discovery database, I of course took it for a spin. You can do the same by clicking here.

Below, my results. In the interest of full transparency, it appears some cities in North America could use some work.

However, I feel confident that the 50 Best Discovery database will improve over time. After all, this is a new tool. Remember, the North America 50 Best Bars list is also brand new. As the organization recognizes more regions and venues, they’ll develop their database further.

Calgary, Alberta, Canada

  • Proof

Toronto, Ontario, Canada

  • Bar Raval
  • BarChef
  • The Shameful Tiki Room

Vancouver, British Columbia, Canada

  • Botanist
  • Boulevard Kitchen & Oyster Bar
  • The Keefer Bar

Las Vegas, Nevada, USA

  • Greene St. Kitchen
  • Herbs & Rye
  • Wing Lei

Nashville, Tennessee, USA

  • Bastion
  • The Catbird Seat
  • Pearl Diver

Philadelphia, Pennsylvania, USA

  • Vedge
  • Zahav

Image: Marcus Loke on Unsplash

by David Klemt David Klemt No Comments

Date Night Desires and Dealbreakers

Date Night Desires and Dealbreakers

by David Klemt

Reserved seats at a bar

Focusing on date night, guest experience and retention tech platform SevenRooms is sharing their latest data-driven report.

Their “Date Night Diner Report” is another successful collaboration with YouGov. Previous reports from this partnership include:

One of the reasons we at KRG Hospitality appreciate and recommend SevenRooms is their dedication to data. The platform’s commitment to sharing the data they collect to the benefit of operators is impressive.

“A resurgence of the American date night is here, and these date night diners are flipping the script on what that experience should look and feel like,” says Allison Page, co-founder and chief product officer at SevenRooms.

So, operators who want to succeed with date night should review this new report. In fact, all operators would be wise to read this report. After all, it addresses reservations, waitlists, walk-ins, and much more.

Released today, this brand-new report can be downloaded here. Read the press release here.

Date Night Details

A lot has changed over the past two-plus years. What hasn’t changed are the two most popular date nights in the US: Friday and Saturday.

Both Friday and Saturday night are preferred by 26 percent of the 763 survey respondents who go on dates. In total, SevenRooms and YouGov surveyed 1,153 individuals.

Generally speaking, these dates are return visits. People who go on dates tend to make reservations at restaurants they’ve dined at previously.

However, 46 percent of such guests are open to reserving a table at a restaurant they haven’t visited before. And speaking of those tables reservations, 53 percent are for two people.

Looking at two major populations, tables for two are the most popular reservations. In New York, they account for 50 percent of reservations. That number increases to 56 percent in Los Angeles.

Interestingly, however, is this bit of date: 53 percent of Americans don’t make reservations for date night. Rather, they’re walk-in guests, meaning they’ll likely become waitlist guests.

Date Night Desires

So, now operators know that the majority of today’s date-night reservations are for two. That doesn’t mean setting aside two-tops and side-by-side seats at the bar is enough for success.

No, there are also guest expectations to consider. SevenRooms identifies the following as the top date-night desires:

  1. A complimentary cocktail or dessert. (33 percent)
  2. Ability to earn extra rewards (24 percent), highlighting the value of loyalty programs.
  3. Incentives that encourage repeat date-night visits. (23 percent)

Furthermore, personalization continues to be a key factor in the dining decision. One-third of guests consider the ability to personalize their dining experience more important than factors such as menu variety or receiving their order quickly.

Date Night Dealbreakers

Of course, if there are desires there are also dealbreakers.

According to SevenRooms, the following are the dealbreakers operators must avoid:

  1. People on a date receiving their meals at different times. In this case, more than ten to 15 minutes apart. (45 percent)
  2. The restaurant being so loud the guests on their date can’t hold a conversation. (43 percent)
  3. A restaurant not having the menu items the guests were looking forward to ordering. (31 percent)
  4. Being sat too close to another table. (31 percent)
  5. Sitting next to a table speaking “too loudly.” (26 percent)
  6. The restaurant being so crowded that a guest can’t find their date. (24 percent)

How important is it to avoid these dealbreakers? Well, the survey respondents say they won’t return to a restaurant if they experience any of them.

To read the full report, click here. And to learn more about SevenRooms, listen to Bar Hacks episode 24, featuring SevenRooms CEO Joel Montaniel.

Image: Dmitri Nesteruk on Unsplash

by David Klemt David Klemt No Comments

Datassential’s State of the Operator 2022

Datassential’s State of the Operator 2022

by David Klemt

Guests sitting at the bar inside a restaurant

The latest addition to the Datassential FoodBytes research series shares insights into the top three challenges most—if not all—operators are facing.

Now, some of what the report reveals paints a bleak picture. Inflation, the labor shortage, and supply chain issues persist even past the midway point of 2022.

However, operators are a tenacious and innovative group of business owners. Of course, that tenacity seems to manifest in people thinking this industry can weather any storm. That perception can come at operators’ detriment. Exhibit A: The Inflation Reduction Act of 2022 not including replenishing of the RRF. But, I digress.

“The State of the Operator & the Road Ahead,” which you can download here, is helpful and informative. As you may be aware, we’re fans of Datassential and their FoodBytes reports. In fact, you can find our synopses of FoodBytes reports here and here.

Below are some key points that operators should be aware for consideration. I strongly urge you to download this free report today.

Operator Outlook

First, let’s take a look at traffic. As Datassential points out, some hospitality business segments are performing better than others currently.

In large part, this is due to two factors: People working from home, and people returning to travel. So, operators who rely heavily on commuters and in-person workers are struggling. On the other hand, operators inside or around hotels are, per Datassential, performing the strongest at the moment.

Interestingly, though, nearly half of operators (47 percent) are seeing an increase in traffic in comparison to pre-Covid levels. Fourteen percent of operators are reporting no change in traffic. Unfortunately, traffic is lower for 39 percent of operators.

Next, sales. In comparison to pre-Covid times, more than half (51 percent) of operators report an increase. Again, 14 percent of operators are experiencing no change. But 35 percent of operators are experiencing a decrease in sales.

Finally, profit margins. Half of operators may be seeing increases in traffic in sales, but profit margins are taking a hit. On average, the industry’s profit margin is now hovering at 13 percent. That’s an eight-percent drop in comparison to pre-Covid levels.

Segment Performance

The findings regarding profit margins are likely to be the most alarming to operators. Historically, our industry has operated on razor-thin margins for decades. Dropping from an average of 21 percent to 13 is concerning.

However, context is important. The segments seeing the lowest profit margins in 2022 are: Business & Industry (B&I), Healthcare, and Colleges & Universities (C&U). Again, remote work (and learning) are largely responsible for those particular segments watching their profit margins tumble.

The strongest performers are: Quick-Service Restaurants (QSR) at 17 percent; Fast Casual at 15 percent); and Midscale, Casual Dining, and Fine Dining, each at 13 percent. Lodging is just below the current average at 12 percent.

Operator Adaptation

Inflation, rising food costs, supply chain issues, labor shortages… Operators are finding ways to cope, and in some situation, thrive.

Unsurprisingly, the vast majority of operators are increasing menu prices. In the past 12 months, 77 percent of operators have raised menu prices at least once.

These increases range from one percent a staggering 30 percent. However, the majority have kept these increases to one to ten percent. Most (31 percent) have implemented increases of no more than five percent. Just one percent of operators boosted prices between 25 to 30 percent.

Of course, raising prices isn’t the only strategy operators have at their disposal. Forty percent of operators are streamlining their menu, reducing the sizes of their menus. However, it’s wise for operators to review their menus at least every three months to eliminate poor performers.

Other strategies include focusing on value for guests (27 percent); utilizing LTOs and launching new menu items (26 percent); eliminating a specific daypart or portion of the menu (25 percent); and making portion sizes small, or “shrinkflation” (18 percent).

There’s much more revealed in Datassential’s latest FoodBytes report. Download your copy today.

Image: Luca Bravo on Unsplash

by David Klemt David Klemt No Comments

Members of Congress Send Letter to SBA

Members of Congress Send Letter to SBA Regarding $180 Million

by David Klemt

United States Capitol Building and Capitol Grounds

More than 70 members of Congress are urging the Small Business Administration to act quickly to fund eligible RRF applicants.

This news comes on the heels of the findings of the Government Accountability Office’s investigation into the RRF. As you may recall, the GAO discovered $180 million in unobligated funds.

In response, 73 representatives and senators sent the SBA a letter. Sen. Catherine Cortez Masto (D-NV) and Rep. Earl Blumenauer (D-OR) are leading the effort to quickly and fairly distribute the $180 million.

At the start, members of Congress ask that the SBA take immediately action. Also, that the SBA give priority consideration to RRF applicants who didn’t receive funds even though they were awarded grants.

By the way, that’s about 7,000 applicants.

Unfortunately, the recently passed Inflation Reduction Act of 2022 doesn’t include funds to replenish the RRF. And while $180 million is nowhere near the $42-43 billion our industry needs and deserves, it’s something. In fact, it’s a reason to keep pushing Congress to do the right and responsible thing.

Interestingly, the letter sent to the SBA also urges the clawing back of funds for various reasons. One social media user, in response to the letter, suggested auditing the recipients. Presumably, this would also lead to a clawback and, in turn, the further awarding of grants.

Key Segments of the Letter

“Last month, the Government Accountability Office (GAO) released a report titled Restaurant Revitalization Fund: Opportunities Exist to Improve Oversight that stated that as of as of June 2022, $180 million of RRF funding was unobligated. As you know, about 177,000 restaurants that applied to the program did not receive awards. While we understand the remainder of the funding will not reach every business that applied, it is imperative that the SBA distribute every dollar to help as many struggling restaurants as is feasible.

“In addition to these actions, we are also urging that SBA take action to recover funds that have been awarded to ineligible applicants, were found to be accepted fraudulently, or could otherwise be returned. For example, the aforementioned GAO report states that SBA does not require recipients to report their operating status, despite the statute requiring that businesses that permanently close to return the unused funds to SBA. SBA has itself identified potentially ineligible recipients, such as clubs and hotels that failed to meet statutory eligibility criteria. Money recovered from fraudulent and ineligible businesses can subsequently be used to help
fund the many businesses who were unable to receive grants. We urge you to take action on this matter and provide us with detailed information on the amount of funding that may be recovered as well as SBA’s progress in doing so.”

Image: Francine Sreca from Pixabay

by David Klemt David Klemt No Comments

5 Self-serve Beverage Brands to Know

5 Self-serve Beverage Brands to Know

by David Klemt

Neon beer mug sign

If you’re an operator who wants to leverage the popularity of self-serve beverages, these are the brands you should consider.

There are several reasons to invest in self-serve beverage solutions:

  • Reducing costs
  • Reduction in waste
  • Guest convenience
  • Guest experience
  • System customization
  • Real-time system management and reports
  • Security

Truthfully, had I been told ten years ago that guests would want to serve themselves beer, wine, and other drinks, I would have raised an eyebrow. It’s possible, sure, but I would’ve been skeptical.

Well, it turns out that I would’ve been wrong. Indeed, today’s guest seems to enjoy pouring their own drinks from self-serve systems.

From convenience to control over their experience, these platforms are proving popular with consumers. An appealing factor appears to be the ability to sample a range of beverages to discover new favorites. And, of course, they can do so without having to purchase full drinks or asking a bartender or server for a sample.

So, below are some of the brands in the self-serve beverage world that operators need to know and consider.

Operator Benefits

In terms of P&L, your bottom line will thank you for embracing self-serve solutions.

First, the popularity of these systems increases sales. Guests can sample an array of drinks easily, choose a favorite or two, and serve themselves at their convenience. Additionally, guests tend to view self-serve systems in a positive light due to perceived value.

Second, an impressive self-serve beverage wall can be a sight to behold. There are venues with 100 self-serve taps and screens, which is an impressive sight. There are also all manner of designs not dependent on a wall. One great example is the rotating self-serve beer system at the Famous Foods Center Bar inside Resort World Las Vegas.

In other words, self-serve beverage systems help concepts stand out among competitors.

Third, self-serve systems allow operators to streamline operations and reduce costs. For example, labor costs can be reduced, as can waste.

And fourth, these solutions can lead to improvements in the guest experience. Not having to wait in line and being able to engage more with front-of-house staff aids in guest perception.

iPourIt

According to the brand itself, iPourIt installed the world’s very first beer wall. Since then, the platform has worked tirelessly to improve their solutions.

One way they’ve improved involves the security and usability of their system. As you’ll see with most self-serve brands that pour alcohol, guests are locked out of these systems without RFID access.

IPourIt offers several types of RFID solutions, from bracelets to fobs. Of course, other systems use similar tech. However, iPourIt prides themselves in offering touch-free RFID access and eschewing the need to leave cards in slots when pouring.

Another benefit is that as long as the beverage isn’t meant to be poured hot or doesn’t have pulp/sediment, iPourIt can handle it.

PourMyBeer

This company is iPourIt’s main rival. When you review how they can improve an operators’s bottom line, it’s not hard to see why.

PourMyBeer claims some impressive stats:

  • 45 percent sales increase
  • 50 percent increase in profits
  • 20 percent reduction to labor costs
  • Less than three percent waste

Like other systems, PourMyBeer can help operators leverage wall space. In addition, a single PourMyBeer screen can control four taps, so a wall doesn’t haven’t to be overloaded with screens.

Impressively, this platform also boasts the most POS integrations among the self-serve systems. Obviously, this is beneficial to the vast array of operators.

Table Tap

For operators looking for both a pioneer in the self-serve space, Table Tap may be the perfect partner. In particular, the use of “underage cards” by underage guests to access non-alcohol drinks is a nice feature. So, children up to early college-age students can get in on the fun.

Standing out from other platforms, Table Tap offers wall systems and table-mounted systems. Truly, offering a self-serve wall and a number of tables with the same tech is impressive.

In fact, if I were to install both solutions I would consider the tables a self-service take on VIP seating. And, I’d charge accordingly. Just something operators may want to consider.

Another cool feature relates to Table Tap’s software. While not the most mind-blowing functionality, guests can control an operator’s sound system via the TableTab ordering platform. Better yet, if an operator charges fees to select songs on their jukebox, TabelTab adds them to guest tabs.

To learn more about Table Tap, give episode 22 of Bar Hacks a listen.

Drink Command

“We do everything self pour, and more,” proclaims the Drink Command website.

Is an operator looking for a killer self-pour wall? Done. Table-mounted taps? Check. What about a self-serve tower, self-serve mobile kegerator, or a heavy-duty, mobile, self-serve counter? Drink Command has all three.

In other words, Drink Command makes it easy for operators to get creative and implement a range of self-pour solutions. Additionally, with mobile solutions, operators who want to expand into catering, pop-ups, and special events can do so easily.

For a list of other benefits—including foam-free beer pours, advertising interstitials, and consumption limits—click here.

Napa Technology

Makers of the TapStation, Napa Technology promises a boost to the guest experience. In part, this is because guests don’t have to wait in long lines at the bar.

Additionally, as stated prior, today’s guest enjoys using self-serve beverage systems.

Unlike other platforms, the Napa Technology TapStation doesn’t rely on wall installations. Instead, TapStation dispensers are available in two- and four-keg systems. These stations can be placed anywhere on the floor rather than a wall.

The TapStation can serve beer, wine, kombucha, and cold-brew coffee, ensuring it’s as versatile as the systems above.

Image: Brad on Unsplash

by David Klemt David Klemt No Comments

Top 10 States Attracting High Earners

Top 10 States Attracting High Earners

by David Klemt

The Florida Theater in Jacksonville, Florida

Using the inflow and outflow data of tax filers earning $200,000 or more, SmartAsset identifies the top ten states attracting high earners.

When it comes to the number-one state, “it’s not even close,” says SmartAsset Advisors. Not surprisingly, several top inflow cities (according to Redfin data) line up with SmartAsset’s top inflow state list.

So, why should this information matter to operators? Plainly, it’s important market information. Population, household income, and age information are crucial considerations when opening any business.

In fact, KRG Hospitality includes such data (and much, much more) when conducting research for our proprietary feasibility, business, and concept plans. Among many elements of opening a restaurant, bar, hotel, or entertainment venue, the income of one’s target audience is crucial.

Knowing where high-income households are leaving and moving to can inform many operator decisions. Where should one open their first concept? Which markets should one consider for expansion? What type of concept will work in a market? What are the threshold price points for menu items? How will this information help inform design choices?

Operators need to recoup their outlay. The income of a concept’s ideal guest should be as important to an operator as knowing their costs.

Top Ten Inflow States

Interestingly, the top state on this list did experience significant outflow in 2020. In fact, the state lost 11,756 high-earning households in 2020.

However, the state also added 32,019 such households, netting 20,263 high earners.

  1. Utah
  2. Idaho
  3. Nevada
  4. Colorado
  5. Tennessee
  6. South Carolina
  7. North Carolina
  8. Arizona
  9. Texas
  10. Florida

Another compelling detail of the states on this list pertains to income tax. In short, three of the states don’t levy personal income tax.

Above, they’re the states in bold: Florida, Nevada, and Texas.

Top 10 Outflow States

So, above are the ten states are seeing the greatest an inflow of high-earning households. Which means, of course, there’s an inverse.

Below, the ten states experiencing the greatest outflow of high earners. Unsurprisingly, SmartAsset deems several entries on the list high-tax states. Also, Washington, DC, is a high-tax area.

Moreover, the list below includes five of the top ten high personal income tax jurisdictions (in bold).

  1. Ohio
  2. Minnesota
  3. Washington, DC
  4. Maryland
  5. New Jersey
  6. Virigina
  7. Massachusetts
  8. Illinois
  9. California
  10. New York

However, it’s not as though these states are seeing a massive exodus of high-earning households. In fact, per SmartAsset, these states have more high-income households than the national average.

Nationally, high-earning households account for less than seven percent of all tax filers. According to SmartAsset, nearly nine percent of tax filers are high-income households in the top ten outflow states.

Image: Trevor Neely on Unsplash

by David Klemt David Klemt No Comments

So, What’s Up with that $180 Million?

So, What’s Up with that $180 Million?

by David Klemt

Fanned out hundred dollar bills

It’s not much in comparison to the $40 billion we need to replenish the Restaurant Revitalization Fund but $180 million is still significant.

According to a June 14 report, the Small Business Administration is sitting on $180 million in RRF funds. This information came to light due to a Government Accountability Office (GAO) investigation.

Unfortunately but unsurprisingly, the funds likely won’t reach operators for a while. Why is that? Well, the SBA is working with the Justice Department to “formulate a plan on how to distribute” the money.

As we know, bureaucracy tends to move at a glacial pace. Additionally, $180 million is nowhere close to the roughly $42 billion it would take to fund RRF applicants who have not received grants.

Where did this Money come From?

We know that $24 million is from funds set aside by the SBA for litigation. However, according to the National Restaurant Association, the American Rescue Plan Act of 2021 didn’t expressly include such a set aside.

Interestingly, the NRA is calling for the SBA to disperse the litigation set aside to RRF applicants. This is due to their interpretation of “the spirit of the law” and unobligated funds.

Now, on to the biggest chunk of the tens of millions of dollars in unawarded, unobligated RRF money. Where, exactly, are these funds from?

Well, it’s a little murky at the moment. Per the GAO, awards returned by either recipients or their financial instutions amount to $56 million. The rest, according to the GAO, comes from “realized or anticipated recoveries,” per their report.

However, some sources report that $156 million was clawed back by the SBA and that the $24 million set aside make up the $180 million.

So, Who gets the Money?

In short, we don’t know yet. In fact, we don’t even know if RRF applicants will have to apply again for a piece of the $180 million.

Additionally, we don’t know if applicants who received an approval for an RRF grant but didn’t receive the award will be processed first.

What we do know is that if every dollar of this “leftover” $180 million is distributed to RRF applicants, a mere 0.44 percent would receive a grant.

As Nation’s Restaurant News reports, 150,166 RRF applicants were in fact approved for a grant but never received one. It would take over $41 billion to fund all 150,000-plus applicants.

When the Justice Department and SBA finalize a plan, we’ll let you know.

Image: John Guccione on Pexels

by David Klemt David Klemt No Comments

Congress Fails Us Once More

Congress Fails Us Once More

by David Klemt

United States Capitol Building through trees

A “compromise” and “far from perfect,” the Inflation Reduction Act of 2022 is yet another bill that could include the RRF but fails to do so.

Not content to deliver just the gut punches our industry has already endured, Congress is leaving us out. Again.

A bill that targets inflation in the US should, logically, include replenishment of the Restaurant Revitalization Fund. However, RRF replenishing isn’t among Inflation Reduction Act compromises.

By the way, that isn’t my assessment. It’s President Joe Biden’s summary of the bill’s passage in the Senate: “This bill is far from perfect. It’s a compromise.”

To clarify, this compromise is a $430 billion spending bill that doesn’t include $40 billion to replenish the RRF. That’s interesting, considering Democrats claim the bill will not only generate enough revenue to pay for itself, they say it will generate another $300 billion throughout the next decade.

Restaurants in the US are projected to generate nearly $900 billion in sales this year. Apparently, however, that’s not enough for our politicians and lawmakers to consider us important to the economy.

Instead, those who enjoy near-inscrutable power and are in the position to stop another bout of restaurant and bar closures have chosen not to help. Our industry, which employs millions upon millions of hard-working Americans is once again on the outside looking in.

The Road to Nowhere

In a word, the road to RRF replenishment is exhausting. One Instagram user commented as such on the Independent Restaurant Coalition‘s post about us being left out of a massive spending bill yet again.

Three months ago, the US Senate killed RRF replenishment when they voted against even debating the Small Business COVID Relief Act of 2022.

Midway through June I reported that Sean Kennedy, executive vice president of public affairs for the National Restaurant Association, posited that the RRF could be replenished via a reconciliation bill.

Addressing the possibility, Kennedy made clear it was a longshot. He was correct.

Indeed, the Inflation Reduction Act was passed by the US Senate via reconciliation bill. A simple majority consisting of all 50 Democrat senators and Vice President Kamala Harris sends the bill to the House.

Compellingly, the nonpartisan Congressional Budget Office’s analysis of the Inflation Reduction Act indicates the bill’s name is a misnomer. According to the CBO, the bill will either have zero or nearly-zero impact on inflation this year or in 2023. A group of 230 economists warn the bill may increase inflation.

The bill is expected to pass the House in its current form and be signed by President Biden by the end of this week.

Response from the IRC

Immediately after news broke that the Inflation Reduction Act of 2022 passed the Senate but failed to include RRF replenishment, the IRC’s Erika Palomar responded.

The executive director of the IRC said:

“For nearly three years, independently owned restaurants and bars have weathered multiple COVID-19 surges, government-mandated closures, consumer hesitancy, rising prices and ongoing restrictions, while fighting to keep their doors open and staff employed. Restaurants and bars are the heartbeat of every community, and we are incredibly disappointed to not be included in the reconciliation vote this weekend. 177,300 small businesses have been patiently waiting for relief and their needs are being ignored, again.

“Thousands of restaurants and bars are at risk of closing permanently as a result of continued Congressional inaction on the replenishment of the Restaurant Revitalization Fund (RRF). The failure of Congress and the White House to act swiftly is impacting neighborhoods in every state across the country. Congress has failed these businesses, but the Independent Restaurant Coalition is not giving up the fight in any way possible to support independent restaurants.”

Further Disappointment

Over the past 15 months (longer if we really look back), our politicians and lawmakers have been consistent about one thing. They have continually failed to recognize restaurants and bars for what they are: cornerstones of their communities.

Of course, they’ll happily use our businesses for political theater and their fundraisers. But giving us more than lipservice? Not on the agenda.

Image: Paula Nardini on Pexels

by David Klemt David Klemt No Comments

Datassential Identifies Top Design Trends

Datassential Identifies Top Design Trends

by David Klemt

Maximalist interior bar or restaurant design

For their latest FoodBytes research topic, Datassential tackles some of the top restaurant design trends.

Click here to download Datassential’s “Foodbytes: Restaurant Design Trends” report. If you haven’t already, you’ll need to sign up for FoodBytes reports.

As the title states, this Datassential resource addresses the state of restaurant design. Now, we recommend reading the report for yourself but below you’ll find the points that really stand out to us.

If you’re among the 22 percent of operators that Datassential says are either considering a dining room redesign or have completed one, this report is particularly relevant to you.

Back-0f-house Design

Unsurprisingly, most people envision the interior dining area when considering restaurant design. However, as Lauren Charbonneau of Reitano Design Group says in Datassential’s latest FoodBytes, “Restaurants are living spaces that need to be agile.”

That means considering the entire space, not just the front of house. There’s also this stat from Datassential: 64 percent of operators think shrinking their footprint would be detrimental. If that’s the case, making the BoH smaller rather than the front may be the way forward.

So, let’s take a look at what Charbonneau identifies as BoH design trends to consider.

Clearly, it’s crucial operators consider their back-of-house teams. Providing a better workplace experience and improving efficiency can be done through design. Per Charbonneau, operators can use clever design and equipment choices to reduce steps, movement, labor, footprint, and costs.

Additionally, sustainability is not only crucial to responsible operation, being sustainable can reduce costs. Selecting Energy Star, Water Sense, and multi-functional equipment can make tasks easier for BoH teams, make a business more sustainable, and, again, drive down costs.

Maximalist Design

Finally, it seems, the minimalist design trend is losing its stranglehold on restaurant design. Of course, if that approach and design language works for a particular concept, it works.

However, maximalism is growing in popularity. For this type of design, think lots of color and bold patterns. Then, think about using multiple patterns and textures, including on the floors.

So, wallpaper, artwork, plush seating, loud tiles… Per Datassential, maximalism appeals to younger guests. In part, this is because these spaces can offer so many Instagrammable moments.

Monochrome Design

Okay, before we begin, “monochrome” doesn’t only mean a black-and-white palette. While that can work very well depending on the concept, monochrome also means using different tones of a single color.

Of course, there are multiple ways to approach this design trend. For example, if one does want to select a black-and-white scheme, Matte Black Coffee in Los Angeles is compelling.

Not only is the design monochrome, guests feel as though they’re inside a two-dimensional image. Per Datassential, this type of design is growing in popularity across the US specifically.

In terms of colorful monochrome, a great example is NYC’s Pietro Nolita. Not only have they chosen pink for their palette, it’s a core element of their branding: Pink AF.

Yet another way to approach this trend is for operators to use varying tones of particular colors to delineate different spaces. So, the dining room may be tones of pink while the bar is green and a private dining room is blue.

Nostalgic Design

As we’re all well aware, the pandemic derailed people’s plans. In particular, people hit the pause or cancel button on travel and vacations. Now, people appear to restarting their travel plans and getting back out there.

However, we’re also dealing with inflation. So, many people are holding off on spending money on travel. This is where restaurant design comes into play.

According to Datassential, “nostalgic escape” is a trend to watch moving forward. While very specific, this trend combines a dive into the past and capturing vacation vibes.

Per their FoodBytes report, Datassential identifies the following elements as key to this design approach:

  • Soft shades of colors. In particular, pink.
  • Tropical designs.
  • Fifties, Eighties, and Nineties design elements.

One concept that leverages this trend and did so before the pandemic is the Hampton Social. Currently, there are eight locations and two more are on the way.

Of course, it’s imperative that operators commit only to design language that’s authentic to their concepts. Pursuing a trend simply to pursue it is a clear path to disaster. That said, these design trends have massive appeal and can work for many operators and their brands.

Image: Davide Castaldo on Unsplash

by David Klemt David Klemt No Comments

8 Books to Read this Month: TOTC Edition

8 Books to Read this Month: Tales of the Cocktail Edition

by David Klemt

Flipping through an open book

This month’s engaging and informative book selections consist of the eight finalists from two of the 2022 Spirited Awards writing categories.

For your convenience, the award winner kicks off each category below. To review July’s book recommendations, click here.

Let’s jump in!

Best New Cocktail or Bartending Book

WINNER: The Japanese Art of the Cocktail

This is the first cocktail book written by Masahiro Urushido, the award-winning bartender from NYC’s Katana Kitten. After just one year with Urushido at the helm, Katana Kitten took home a 2019 Spirited Award. The Japanese Art of the Cocktail features 80 recipes and serves as a deep dive into a unique approach to cocktails and technique.

Death & Co: Welcome Home

The third book from Alex Day, Nick Fauchald, and David Kaplan, the team behind Death & Co., features more than 400 recipes. Now, while this book targets home bartenders, it’s also beneficial to bar professionals as it delves into the Death & Co. cocktail development program. Is that worth a $35 investment? Absolutely. Pick up  Death & Co. Welcome Home today.

The Cocktail Seminars

As the story goes, author Brian D. Hoefling taught his fellow Yale students about cocktails and build techniques during his senior year. The Cocktail Seminars is a collection of five of Hoefling’s education seminars and spans 30 cocktail recipes. Along with technique, readers will learn about the history of cocktails, which they and their bar teams can leverage to engage with guests.

The Way of the Cocktail: Japanese Traditions, Techniques, and Recipes

The Way of the Cocktail comes from Julia Momosé, one of the minds behind Chicago cocktail destination Kumiko. From classics to new riffs, the recipes in this book are based on 24 micro-seasons.

Best New Book on Drinks Culture, History, or Spirits

WINNER: The Oxford Companion to Spirits and Cocktails

David Wondrich and Noah Rothbaum team up for likely the deepest dive into the role alcohol plays in human history. The Oxford Companion to Spirits and Cocktails is everything you ever wanted to know about fermentation, distillation, aging, cocktails, cocktail bars, and more. In addition to global techniques and processes, readers will be treated to illustrations, a guide to making drinks, and even a timeline of distillation and spirits.

Bourbon: The Story of Kentucky Whiskey

Clay Risen is considered an authority on spirits. In particular, he’s lauded as an expert on whiskey. Bourbon lovers will appreciate the Bourbon: The Story of Kentucky Whiskey box set for what it is: a definitive history of America’s native spirit. Along with profiles of Kentucky distillers, Risen has included interviews and photographs to tell the story of bourbon.

Drunk: How We Sipped, Danced, and Stumbled Our Way to Civilization

Edward Slingerland takes a look at not just the history of imbibing but what has motivated humans to catch a buzz with alcohol. Drunk goes far beyond anecdotes, myth and lore and uses science to address why alcohol is so important to so many people. More case study than well-spun yarn, Drunk is as entertaining as it is investigative.

Girly Drinks: A World History of Women and Alcohol

Written by Mallory O’Meara, Girly Drinks takes a hard look at the gendering of bars, brewing, distillation, and drinking culture. O’Meara also delves into the history and cultural importance of women bartenders like Ada Coleman, creator of the Hanky Panky.

“Filling a crucial gap in culinary history, O’Meara dismantles the long-standing patriarchal traditions at the heart of these very drinking cultures, in the hope that readers everywhere can look to each celebrated woman in this book—and proudly have what she’s having.”

Image: Mikołaj on Unsplash

by David Klemt David Klemt No Comments

Tales Reveals 2022 Spirited Awards Winners

Tales of the Cocktail Reveals 2022 Spirited Awards Winners

2022 Spirited Award winner Lynn House

2022 Spirited Award winner Lynn House

Congratulations to the 2022 Spirited Awards winners, revealed last week during the 20th anniversary of Tales of the Cocktail.

First opening their doors in 2018, NYC’s Katana Kitten took home two awards. The dream team trio of Masahiro Urushido, Greg Boehm, and James Tune won Best US Cocktail Bar and best US Bar team.

Another American venue that won two Spirited Awards is Jewel of the South in New Orleans. Opened in 2019, Jewel of the South was crowned Best US Restaurant Bar. Additionally, the US Bartender of the Year is Chris Hannah, co-owner of the NOLA dining and drinking destination.

We also want to extend a special congratulations to Bar Hacks guest Lynn House. To learn more about House, this year’s Best US Brand Ambassador, check out episode 52 of Bar Hacks.

Internationally, two bars also took home multiple awards. 🔶🟥🔵 A Bar with Shapes for a Name and Lyaness at Sea Containers London, both in London, won two Spirited Awards. The former is this year’s Best New International Cocktail Bar. Plus, it’s the home of Remy Savage, the 2022 International Bartender of the Year.

Lyaness at Sea Containers London clinched Best International Hotel Bar andWorld’s Best Bar. So, London, New Orleans, and New York showed out at the 2022 Spirited Awards.

To view the finalists in each category, please click here.

US Award Categories

U.S. Bartender of the Year presented by Del Maguey: Chris Hannah (Jewel of the South, New Orleans, LA)

Best U.S. Bar Mentor presented by BarSmarts: Sean Kenyon

Best U.S. Brand Ambassador presented by Libbey: Lynn House (Heaven Hill)

Best U.S. Bar Team presented by William Grant & Sons: Katana Kitten (New York, NY)

Best U.S. Cocktail Bar presented by Absolut Vodka: Katana Kitten (New York, NY)

Best U.S. Hotel Bar presented by Grey Goose: Silver Lyan at the Riggs (Washington, DC)

Best U.S. Restaurant Bar presented by Maison Ferrand: Jewel of the South (New Orleans, LA)

Best New U.S. Cocktail Bar presented by Aviation Gin: Happy Accidents (Albuquerque, NM)

International Award Categories

International Bartender of the Year presented by Patrón Tequila: Remy Savage (🔶🟥🔵 A Bar with Shapes for a Name, London, UK)

Best International Bar Mentor presented by Lyre’s Non-Alcoholic: Lauren Mote

Best International Brand Ambassador presented by Lyre’s Non-Alcoholic: Martin Hudak (Mr. Black Spirits)

Best International Bar Team presented by House of Angostura: MAYBE SAMMY (Sydney, Australia)

Best International Cocktail Bar presented by Tequila Fortaleza: Tayēr + Elementary (London, UK)

Best International Hotel Bar presented by Perrier: Lyaness at Sea Containers London (London, UK)

Best International Restaurant Bar presented by Amaro Montenegro and Select Aperitivo: Sexy Fish (London, UK)

Best New International Cocktail Bar presented by Stranger & Sons: 🔶🟥🔵 A Bar with Shapes for a Name (London, UK)

Global Award Categories

Best New Spirit or Cocktail Ingredient presented by Tales of the Cocktail Foundation: Lyre’s Non-Alcoholic Italian Orange

World’s Best Cocktail Menu presented by Diageo Bar Academy: Little Red Door (Paris, France)

World’s Best Spirits Selection presented by Beam Suntory: Jack Rose Dining Saloon (Washington, DC)

Pioneer Award Presented by The Blend: Amanda Gunderson (CEO and co-founder, Another Round Another Rally)

Timeless International Award presented by Jägermeister: Harry’s New York Bar (Paris, France)

Timeless U.S. Award presented by Johnnie Walker: Bemelmans Bar at The Carlyle, A Rosewood Hotel (New York, NY)

Helen David Lifetime Achievement Award presented by William Grant & Sons: Julie Reiner (Co-founder Clover Club, Leyenda, Social Hour Cocktails, Mixtress Consulting)

World’s Best Bar presented by Tales of the Cocktail Foundation: Lyaness at Sea Containers London (London, UK)

Writing and Media Award Categories

Best Cocktail & Spirits Publication presented by Diageo Bar Academy: VinePair

Best Broadcast, Podcast, or Online Video Series presented by Diageo Bar Academy: The Cocktail Lovers

Best Cocktail & Spirits Writing presented by Diageo Bar Academy: “Get Real: The bar world looks beyond feel-good measures on sustainability and climate change” by Max Falkowitz for Imbibe Magazine

Best New Cocktail or Bartending Book presented by Lyre’s Non-Alcoholic: The Japanese Art of the Cocktail by Masahiro Urushido and Michael Anstendig

Best New Book on Drinks Culture, History, or Spirits presented by Diageo Bar Academy: The Oxford Companion to Spirits & Cocktails edited by David Wondrich with Noah Rothbaum

Image: Cory Fontenot

by David Klemt David Klemt No Comments

Is Your Business in a Top Time Out City?

Is Your Business in a Top Time Out City?

by David Klemt

The Bean aka Cloud Gate in Chicago

Hot off the presses, Time Out is now revealing the results of their Time Out Index 2022, an annual list identifying the world’s top cities.

The global publication, founded in the late 1960s, surveyed 20,000 “city dwellers.” Time Out focuses on cities’ restaurant, bar, nightlife, entertainment, and art scenes.

For 2020 and 2021, Time Out put emphasis on the pandemic and how cities maintained resiliency and kept communities together. In 2022, priority is given to flourishing nightlife, dining, and drinking, along with culture.

Additionally, Time Out gives weight to a city’s sustainability, safety, walkability, and affordability. To learn more about how Time Out analyzes data, click here.

Compelling Rankings

Below, you’ll find Time Out’s ranking of the best 53 cities in the world for 2022. I’ve broken the list into sections: 53 to 11, and ten to number one.

Interestingly, the 20,000 survey respondents note the dining, drinking, and nightlife of the top five cities. In fact, the nightlife scene of number three is “the world’s best.”

And city number two? Survey takers think it’s the most fun—”funnest,” according to Time Out—in the world.

Now, I know our audience is largely American and Canadian, so I’ll get to how both rank. Six cities—the usual suspects, basically—in the US are on the list. Only one American city is in the top ten, and it’s likely not the one you think. As for Canada, one city claims the 27 spot, another is number nine.

You’ll find the Canadian and American cities in bold below. Champing at the bit to see the results? Scroll down!

Time Out Cities 53 to 11

  1. Doha, Qatar
  2. Hong Kong
  3. Bangkok, Thailand
  4. Istanbul, Turkey
  5. Johannesburg, South Africa
  6. Rio de Janeiro, Brazil
  7. Auckland, New Zealand
  8. Sydney, Australia
  9. Abu Dhabi, United Arab Emirates
  10. Singapore
  11. Accra, Ghana
  12. Los Angeles, California, USA
  13. Rome, Italy
  14. Dubai, United Arab Emirates
  15. Barcelona, Spain
  16. Miami, Florida, USA
  17. São Paulo, Brazil
  18. Dublin, Ireland
  19. Athens, Greece
  20. Manila, Philippines
  21. Kuala Lumpur, Malaysia
  22. Paris, France
  23. Tel Aviv, Israel
  24. Mexico City, Mexico
  25. Boston, Massachusetts, USA
  26. Lisbon, Portugal
  27. Toronto, Ontario, Canada
  28. Delhi, India
  29. San Francisco, California, USA
  30. Tokyo, Japan
  31. Stockholm, Sweden
  32. Birmingham, England
  33. Buenos Aires, Argentina
  34. New York, New York, USA
  35. Lyon, France
  36. Porto, Portugal
  37. London, England
  38. Taipei, Taiwan
  39. Melbourne, Victoria, Australia
  40. Mumbai, India
  41. Manchester, England
  42. Madrid, Spain
  43. Cape Town, South Africa

The Top Ten Time Out Cities

  1. Copenhagen, Denmark
  2. Montréal, Québec, Canada
  3. Berlin, Germany
  4. Marrakech, Morocco
  5. Prague, Czech Republic
  6. Amsterdam, Netherlands
  7. Glasgow, Scotland
  8. Medellín, Colombia
  9. Chicago, Illinois, USA
  10. Edinburgh, Scotland

Congratulations to the top 53 cities in the world! We expect big things from their dining, drinking, and nightlife moving forward.

Image: Christopher Alvarenga on Unsplash

by David Klemt David Klemt No Comments

What’s Up with Meat, Poultry and Seafood?

What’s Up with Meat, Poultry and Seafood?

by David Klemt

Barbecue food plate on wooden table

We know how plant proteins are performing with consumers but what do we know about how meat, poultry, and seafood are doing?

Well, because of a recent report from Datassential, we know many consumers are “meat-limiters.” And research from the World Resources Institute shows that plant-based performance is nuanced.

Interestingly, the performance of animal proteins on-premise appears to be following a beverage trend: Moderation. According to Datassential, more consumers are reducing their consumption of meat and poultry than increasing it in comparison with 2021.

So, meat-limiters may be indicative of the future of meat consumption.

Consumer Shifts

As the name implies, meat-limiters are limiting or otherwise reducing their consumption of animal proteins. Importantly, it doesn’t appear that a significant percentage of consumers are eliminating animal proteins from their diets.

Rather, many people are simply increasing the amount of plant-based items they’re eating. However, that increase is more aspirational than real in some cases.

Per Datassential’s survey of 1,500 consumers in the US, just over 70 percent of people are meat eaters. In contrast, nearly 25 percent are “flexitarian.” Just two percent are vegan or pescatarian, and only three percent are vegetarian.

So, the vast majority of Americans are still consuming meat, poultry, and seafood. We just now have reason to believe that more consumers may be leaning toward a flexitarian diet.

A bit over a quarter of consumers consume meat every day. Still, many people aspire to eat more vegetables, fruits, and whole grains, per Datassential.

However, there are more pescatarians, vegans, and vegetarians among Gen Z than the overall population. According to Datassential, this could indicate a shift away from animal proteins in the future.

Meat Performance is Nuanced

Just like plant-based performance, meat performance is nuanced. There are many factors at play.

Shifts in what consumers value are driving changes to the performance of proteins. Health, sustainability, the climate, taste, and affordability have an effect on all proteins, animal and plant.

Undeniably, inflation and shaken consumer confidence are impacting protein performance. Everything, it seems, is more expensive at the moment. Generally speaking, animal proteins are pricier than plant-based items.

It makes sense, then, that some consumers are reducing their intake of animal proteins and filling that void with fruits, veggies, and legumes.

Of particular note are shifts in daily and weekly consumption of animal proteins in 2022. Meat consumption once or more per week—beef, lamb, pork, veal—is up three percent. However, there’s a ten-percent increase in consumers eating poultry once or more per week.

Interestingly, daily poultry consumption is down seven percent in comparison with 2021. Likewise, daily consumption of seafood is also down seven percent, and fewer people are consuming it less than once per week.

Plant-based is Down

Despite what some would think, meat-limiters don’t appear to be driving up plant proteins significantly.

In fact, according to Datassential, the daily consumption of plant-based proteins is down. Per the research firm, seitan, tempeh, and tofu are the experiencing the greatest drop in daily consumption.

The fact is that across generations, more consumers eat animal proteins on a daily basis than their plant-based counterparts. Gen Z, per Datassential, consumes more animal proteins on a daily basis than other generations.

So, how does it make sense that people are reducing their meat intake but plant-based isn’t seeing a sizable jump in consumption?

In part, the answer is the growing popularity of plant-forward dishes. These are items, like bowls, that offer a small amount of meat, poultry, seafood or dairy. The majority of these menu items consists of plants but are not free of animal proteins completely.

The path forward may indeed be a plant-forward menu. Of course, this is heavily reliant on a specific concept or brand. Still, it’s likely many restaurants can do well offering mixed dishes, those heavier on plant proteins than animal proteins.

Image: Peter Pham on Unsplash

Note: This article is based on information from Datassential’s “2022 Plant-Forward Opportunity” report. To access a number of free reports, sign up with Datassential today.

by David Klemt David Klemt No Comments

Meat-limiters Driving Change

Meat-limiters Driving Change

by David Klemt

Plant-based food bowl

You’re likely familiar with dietary terms like vegetarian, vegan, pescatarian, and even flexitarian, but what about meat-limiter?

As the name implies, a meat-limiter is a person actively choosing to reduce their meat intake. It’s also an umbrella term that includes vegan, vegetarian, pescatarian, or flexitarian diets.

Earlier this year, Datassential took a look at plant-based opportunities. Over the course of a week, 1,500 Americans ages 18 to 88 were surveyed online.

Datassential conducted their research with three partners:

  • The Culinary Institute of America
  • Food for Climate League
  • Menus of Change University Research Collaborative

The results are revealed within Datassential’s “2022 Plant-Forward Opportunity” report. To access a number of free reports, sign up with Datassential today.

Meat-limiter Guests

Just over a quarter of Americans—29 percent—are meat-limiters in some way. That number climbs to 36 percent for Gen Z, per this Datassential survey.

Of four major diets (vegetarian, vegan, pescatarian, flexitarian), vegetarian and vegan are the least common. The overall US population consists overwhelmingly of meat eaters (71 percent). Nearly a quarter, 22 percent, are flexitarian.

For Gen Z, those same numbers are 65 percent and 19 percent, respectively. Interestingly, Gen Z has more vegetarians and vegans than other generations.

But then there’s this: When it comes to the daily consumption of animal proteins, Gen Z is at the top. It’s Millennials who consume the most plant-based proteins on a daily basis.

Animal proteins are still at the top across generations. However, people are consciously reducing their meat intake and seeking plant-based alternatives.

What’s Driving Meat-limiters?

In comparison to 2021, Datassential hit on a compelling finding. A mere six percent of the US population was actively reducing meat intake last year.

That number has skyrocketed in 2022. This year, per Datassential, 21 percent of consumers can be considered meat-limiters.

Given the pandemic, it makes sense to assume this dietary change is due to personal health. However, climate change is a major driver.

Overall, 55 percent of consumers feel climate change is important. That number climbs to 71 percent for meat-limiters, 69 percent of students.

Half of consumers also feel that plant-based foods, in general, are better for the planet. Nearly half (47 percent) feel these foods are also more sustainable. Again, the number increases for meat-limiters and students (and Millennials, as well).

Interestingly, two-thirds of consumers feel traditional plant-based food items are healthier than new plant-based meat alternatives. However, a little over 60 percent of consumers find both plant-based food categories healthy.

Takeaway

Before proceeding, it’s important to recognize that a survey of just 1,500 people comes with a margin of error.

Still, the results are compelling and provide insight into today’s consumer. Among the top insights:

  • Consumers are trying more plant-based menu items.
  • Climate change and sustainability are driving consumer decisions.
  • More consumers are concerned with their health.

Per Datassential, one way to appeal to a wide range of guests is offering “mixed dishes.” These are menu items that combine animal and plant proteins. Another way forward is menuing plant-forward dishes that include a small amount of meat, poultry, fish, or dairy.

If we accept that only a tiny fraction of the US population is vegetarian or vegan, targeting flexitarians and daily meat eaters in this way makes sense.

Image: Yoav Aziz on Unsplash

by David Klemt David Klemt No Comments

Datassential IDs LTO Keys

Datassential Identifies Limited-time-offer Keys

by David Klemt

Double cheeseburger on sesame bun

Food and beverage market research firm Datassential turns their attention to limited-time offers in one of their latest reports.

Part of the FoodBytes series of resources, “A Look at Limited-time Offers” is a free Datassential trend report. If you have yet to do so, sign up for Datassential FoodBytes reports.

There are several ways for savvy operators to drive traffic. Loyalty programs and subscriptions are two popular modern-day solutions.

However, the LTO is tried, true, and can boost traffic, engagement, loyalty, sales, and revenue.

Of course, there are different ways to execute LTOs. There’s the recurring, anticipation-driving item: McDonald’s McRib. Then there’s the seasonal offering: Starbucks Peppermint Mocha. And the return of a popular item eliminated years prior: Taco Bell Mexican Pizza and Wendy’s Spicy Chicken Nuggets.

Some LTOs have been going strong for years, others are leveraging a sense of nostalgia. In fact, some appear to be a direct response to Internet chatter.

Which LTO?

Per Datassential, 63 percent of LTOs most recently purchased by consumers were impulse decisions. And when the firm dives into LTOs in general, they find that one product stands above the others.

The top-performing LTO food item in terms of order frequency is the burger.

Now, does that mean you have to menu an LTO burger to succeed with this type of promotion? Of course not.

A successful LTO is one that’s authentic to your brand. And, clearly, it needs to be one that interests your guests. If you’ve been reading KRG Hospitality articles for a while, you know what I’m going to say next.

But for those who are new around here, I’m going to tell you to review your consumer data. What items are performing best? What flavors are resonating with your guests?

Now, look at the industry. What flavors and items are trending? How can you leverage them—in an authentic way—into an LTO?

If a burger may not work, will a different type of sandwich do the job? How about nuggets, breakfast items, a dessert, or a beverage?

Know your brand, know your guest, know what’s bringing the heat.

How Long?

Once you know what you’re offering, the next question should be obvious. How long are you going to make it available?

Every concept is different. What works for one may not work for another. However, analyzing what others do in terms of LTO duration and frequency can help inform you.

And as it turns out, Datassential’s latest FoodBytes report addresses “LTO cadence.”

The majority of operators—43 percent—run an LTO once every one to three months. Considering the popularity of seasonal LTOs, this frequency makes sense.

Interestingly, a quarter of operators offer an LTO more than once per month. Just about as many execute one every three to six months.

Far, far less common is running an LTO once every six to 12 months. In fact, this is the approach of just seven percent of operators. A mere two percent of operators run an LTO less than once every 12 months.

Again, there’s no “right” answer here. Some operations can succeed with multiple LTOs each month, some find success rarely offering one at all.

Takeaway

Operators know their brands best. They should know their guests equally as well, or at least strive to do so. As such, an operator should have an idea of what to offer in terms of LTO food or beverage items.

And, of course, operators should data-obsessive. That’s the only real way to have an idea of what LTOs will work, how often they should run, and how frequently one should be available.

But there’s more to know. Datassential also reveals challenges that deserve serious consideration before executing any LTO:

  • Do you have time to train staff on the new item?
  • Is your staff strong when it comes to upselling?
  • Will your guests complain when the new product is no longer available?
  • Do you have to source one or more ingredients for this item?
  • Is/Are the ingredient(s) necessary readily available?

The LTO is a proven marketing and promotion tool when done well. Challenging, yes, but worth the effort.

Image: amirali mirhashemian on Unsplash

Top