Bar news

by David Klemt David Klemt No Comments

$23.82 Minimum Wage for Delivery Workers?

$23.82 Minimum Wage for Delivery Workers in NYC?

by David Klemt

Red "New York" sign on building

With a public hearing on the docket for December 16, the New York City Council is proposing “fairer pay for delivery workers.”

The move is a year in the making. Last year, the NYC Council approved legislation with the goal of improving delivery worker pay and working conditions.

Now, the council is moving to increase minimum wage for the 60,000-plus delivery workers in the city.

At the risk of coming across as pessimistic, the legislation is likely to be unpopular with third-party delivery services. After all, when NYC and San Francisco passed laws to cap third-party delivery commissions, the big services filed lawsuits.

So, again, increasing the minimum wage for delivery workers in NYC will probably not go down well with companies like Uber, DoorDash, and Grubhub.

It’s possible we’ll find out before the end of this year. After the public hearing, the NYC Council will consider public comments. Then, the council could move forward and enact the legislation.

What’s in the Proposal?

Should the rule go into effect after the public hearing on December 16, minimum wage would rise to $17.87 per hour for third-party delivery workers. By April 1, 2025, that rate would increase to $23.82.

“This new proposed minimum pay rate would help ensure a fairer pay for delivery workers for third-party apps, providing more stability for 60,000 workers across our city,” says New York City Mayor Eric Adams.

According to reports, Brooklyn Borough President Antonio Reynoso is in favor of the legislation as well.

“It’s absolutely unacceptable that the restaurant delivery workers who provide for so many in this city are not justly compensated for their time, reimbursed for their expenses or provided essential benefits,” says Reynoso.

So, how did the council arrive at the $23.82 per hour figure? Well, we actually have that information:

  • $19.86, which matches standards set by the New York City Taxi and Limousine Commission for ride-hail drivers;
  • $2.26 for expenses delivery workers incur; and
  • $1.70 for worker’s compensation.

Why Legislate Delivery Worker Pay?

It appears the main reason is an incredibly simple one. In short, third-party delivery workers aren’t making minimum wage in NYC.

Per the Department of Consumer and Worker Protection (DCWP), delivery workers average less than the city’s $15 minimum wage. With tips, they’re averaging $14.18. And without tips? As one can imagine, the hourly rate plummets: $7.09 per hour.

According to the DCWP, the average hourly expense a delivery worker incurs is $3.06. So, that drives their hourly pay to $11.12 with tips, $4.03 without.

In an argument likely to be cited in any lawsuit filed by DoorDash (or at least shared in a public statement), the company claims its delivery workers make almost $29 per hour.

Clearly, there’s a discrepancy somewhere. Either delivery drivers are woefully underpaid for the service they provide or multiple researchers are misinterpreting hourly pay data.

Several sources have cited a statement made by a DoorDash representative about the NYC Council’s proposal:

“Dashing allows so many across New York City to earn when, where and how often they choose,” says the rep. “Unfortunately, the proposed rule does not appropriately account for this flexibility or that Dashers are able to choose which deliveries they accept or reject.”

Their statement continues, addressing a possible rise in costs and drop in orders:

“Failing to address this could significantly increase the costs of delivery, reducing orders for local businesses and harming the very delivery workers it intends to support.”

Why Should I Care if I Don’t Operate in New York City?

We’ll see—quickly, apparently—if this proposal becomes law. Should that happen, there’s reason to assume similar proposals will pop up in other cities and states.

We’ll also see whether or not third-party delivery companies file lawsuits in response. They’ve done so for commission caps, after all.

At any rate, this is one to watch. Similar legislation could be coming to your market.

Image: Nik Shuliahin 💛💙 on Unsplash

by David Klemt David Klemt No Comments

Traffic Up but Margins Thinner

Traffic Up but Margins Thinner

by David Klemt

Chef checking tickets

The One Table 2022 report from Datassential focuses on the state of the operator and what the industry can expect moving forward.

This informative report shares survey results from 801 operators across America. While some of the findings are positive, it’s clear many operators are enduring significant challenges.

For some, traffic and sales are up. However, that’s not the situation others find themselves in.

To download and review the Datassential One Table 2022, please click here.

The Respondents

For this report, Datassential shares the survey answers from 801 respondents.

Most survey respondents are independent operators. In fact, they account for 71 percent of the participants. Making up the rest of the field are chain operators (15 percent) and franchise operators (14 percent).

As far as segment types, the majority of survey participants operate in the fast-casual space (18 percent). Unsurprisingly, fine dining is the smallest group of respondents at six percent. Thirteen percent operate midscale restaurants, and 12 percent are at the helm of casual-dining concepts. Somewhat surprisingly, just ten percent of participants operate QSRs.

Interestingly, the service format is fairly even among survey participants. Fifty-three percent of operators are full-service and 47 percent are limited-service.

Similarly, survey respondents represent the country’s regions pretty evenly:

  • South: 30 percent
  • Midwest: 29 percent
  • Northeast: 21 percent
  • West: 20 percent

In terms of market type, most respondents operate in the suburbs (49 percent). Following somewhat closely are urban-market operators, at 31 percent. Just 20 percent of survey participants operate in rural markets.

Traffic, Sales and Margins

At first glance, Datassential’s survey reveals positive news.

Now, I’m sure people find the terms “pandemic, “pre-pandemic,” and “post-pandemic” exhausting at this point. However, there’s no denying we continue to feel the aftershocks sent through the industry by the pandemic.

So, how do things look now in comparison to pre-pandemic traffic and sales levels?

First, the positives. Nearly half of survey respondents—47 percent—say their traffic is up in comparison to where it was pre-pandemic. Add to that the 14 percent who say their traffic is the same and 61 percent of operators appear to be in good shape.

In terms of sales, 51 percent of survey participants have good news. That news is that their sales are higher in comparison to pre-pandemic levels. Again, add the 14 percent who don’t see any change. So, that’s 65 percent of operators who appear to be performing well.

But with the good there’s bad. Unfortunately, 39 percent of respondents report lower traffic than pre-pandemic levels. And sales are lower than they were before the pandemic for 35 percent of survey participants.

Operator margins are lower for all respondents. Generally speaking, the profit margin for operators before the pandemic sat at 21 percent. Now, the average is 13 percent. QSRs and fast-casual restaurants are a bit higher among survey respondents: 17 percent and 15 percent, respectively.

On paper things do look up for many operators. However, the industry is still suffering, with a third struggling to rise to even pre-pandemic levels of traffic and sales.

Image: Daniel Bradley on Unsplash

by David Klemt David Klemt No Comments

Is There Demand for Non-alcohol?

As the Holidays Approach, is There Demand for Non-alcohol?

by David Klemt

Friends toasting with pink drinks

There’s no denying that non-alcohol is a growing beverage category, but does the data support the hype and operator consideration?

A report by behavioral research firm Veylinx offers compelling insight into non-alcohol and consumers.

By now, there’s really no excuse for failing to give non-alc serious consideration. When planning menus, operators should treat non-alc as much more than an afterthought.

Admitting fully that I’m repeating myself, giving alcohol-free beverages the same attention as their full-proof counterparts is crucial. Doing so is smart business; non-alc is capable of driving traffic and revenue.

And then there’s the guest experience element of the non-alc equation. Hospitality is about service, about ensuring every guest is comfortable. Giving guests who are abstaining from alcohol consumption a different experience than others isn’t hospitality—it’s alienation. Not only is that the antithesis of hospitality, it’s bad business.

Reviewing Veylinx data shows that non-alc is worthy of operators’ time and consideration. In my opinion, it’s even more important that non-alc menus and offerings be dialed in now. After all, the end-of-year holidays on our doorsteps.

The infamous Busiest Bar Night of the Year is nearly here. From November 23 through New Year’s Eve, people will be meeting up with family and friends. Many will also be seeking an escape from the stress of those gathering and the holidays.

Non-alcohol by the Numbers

One of the most important points made by Veylinx is this: Abstinence from alcohol isn’t limited to “social media” events like Dry January and Sober October.

Rather, consumers are choosing to abstain from alcohol throughout the year for myriad reasons. Specifically, Veylinx data reveals that more than 75 percent of Americans have abstained from alcohol consumption at some point for at least one moment.

Further, 46 percent of Americans plan to reduce their consumption of alcohol “right now.” As in, the holidays may be upon us but they’re actively working on a plan to drink less, not more.

Two major factors motivating this behavioral change are mental well-being and physical health. In service of those factors, more than half of LDA drinkers in America plan to replace beverage alcohol with non-alc beverages.

Interestingly, Veylinx finds that these consumers will pay more for non-alc alternatives in comparison to the general population.

Drilling down further, this shift in consumer behavior appears to be driven by a handful of consumer types:

  • 21- to 35-year-old consumers;
  • “light” drinkers; and
  • consumers who have set aside alcohol consumption for one month or more.

Speaking of the first group, demand for RTDs is 48 percent greater in comparison to those aged 35 or older. Add CBD to RTD and the demand among the 21 to 35 cohort grows by 18 percent.

However, not all non-alc growth comes from the 21-to-35 group. Non-alc beverages with mood boosters see an increase in demand from the 35-plus group of 29 percent.

In short, if an operator is ignoring the non-alc consumer, they’re harming their own business and reputation. Alcohol-free RTDs, cocktails, beer, and wine are growing.

Savvy operators will leverage that growth.

Image: Helena Yankovska via Unsplash

by David Klemt David Klemt No Comments

The Most-stressed Cities in the US

These are the Most-stressed Cities in the US

by David Klemt

Deflated smiley face balloon in street

There’s a simple argument to be made that one characteristic the happiest cities share is being among the least stressful to live.

Yesterday we took a look at the happiest cities in the US, according to WalletHub analysis. Click here in case you haven’t yet read that article.

Today, let’s check out the most- and least-stressed cities in America. As with their happiest and least-happy cities list, WalletHub ranks 182 cities based on stress levels.

Of course, “least stressed” doesn’t mean “stress-free.” Nor should it—some stress is good for us. After all, stress can push us to perform our best, bring out our problem-solving creativity, and even energize us.

The rankings below may surprise you. Like me, you may even find yourself raising an eyebrow and disagreeing with some of them.

However, it’s a compelling list worth reviewing if you’re an operator, leadership team member, hospitality professional, or in the site-selection portion of opening a restaurant or bar.

The Top 25 Cities of Stress

When determining their results, WalletHub ranked 182 cities according to four main categories. Those categories are: work stress; financial stress; family stress; and health and safety stress. The categories consist of 40 key metrics in total.

I think it’s safe to assume that no city wants to be in the top 25 of this list, or even the top 50. Neither, I’m certain, does any city want to wear the crown of “Most Stressed US City.”

Unfortunately, someone must be number one. Below, the top 25 “Cities of Stress,” per WalletHub:

  1. Cleveland, Ohio
  2. Detroit, Michigan
  3. Gulfport, Mississippi
  4. Baltimore, Maryland
  5. Philadelphia, Pennsylvania
  6. Memphis, Tennessee
  7. New Orleans, Louisiana
  8. Birmingham, Alabama
  9. Louis, Missouri
  10. Toledo, Ohio
  11. Augusta, Georgia
  12. Jackson, Mississippi
  13. North Las Vegas, Nevada
  14. San Bernadino, California
  15. Fayetteville, North Carolina
  16. Akron, Ohio
  17. Wilmington, Delaware
  18. Houston, Texas
  19. Montgomery, Alabama
  20. Shreveport, Louisiana
  21. Cincinnati, Ohio
  22. Newark, New Jersey
  23. Mobile, Alabama
  24. Columbus, Georgia
  25. Indianapolis, Indiana

Alas (I don’t get to use this word much), Ohio has four cities on this list. In fact, the Buckeye State has two cities in the top ten.

Of course, Ohio isn’t the only state with multiple cities in the top 25 stressed cities. Alabama has three cities among the top 25. Also, Mississippi and Louisiana each have two cities on this part of the list, unfortunately.

Cities 26 Through 91

As you’ll see below, Ohio shows up a couple of times in this portion of the list. However, so do a handful of other states.

For example, ten Texas cities land on this part of the list. That means Texas has 11 cities among the “top” half of the most-stressed US cities.

  1. Baton Rouge, Louisiana
  2. Las Vegas, Nevada
  3. Huntington, West Virginia
  4. Springfield, Missouri
  5. Dover, Delaware
  6. Norfolk, Virginia
  7. Milwaukee, Wisconsin
  8. Chicago, IL
  9. Newport News, Virginia
  10. Washington, DC
  11. Dallas, Texas
  12. Richmond, Virginia
  13. Tulsa, Oklahoma
  14. Chattanooga, Tennessee
  15. Bridgeport, Connecticut
  16. San Antonia, Texas
  17. Atlanta, Georgia
  18. Glendale, Arizona
  19. New York, New York
  20. Tucson, Arizona
  21. Columbia, South Carolina
  22. Columbus, Ohio
  23. Knoxville, Tennessee
  24. New Haven, Connecticut
  25. Brownsville, Texas
  26. Rochester, New York
  27. Casper, Wyoming
  28. Vancouver, Washington
  29. Oklahoma City, Oklahoma
  30. Jacksonville, Florida
  31. Corpus Christi, Texas
  32. Charleston, West Virginia
  33. Henderson, Nevada
  34. Phoenix, Arizona
  35. Modesto, California
  36. Wichita, Kansas
  37. Winston-Salem, North Carolina
  38. Little Rock, Arkansas
  39. Moreno Valley, California
  40. Louisville, Kentucky
  41. Stockton, California
  42. Spokane, Washington
  43. Fresno, California
  44. Miami, Florida
  45. Kansas City, Missouri
  46. El Paso, Texas
  47. Salem, Oregon
  48. Hialeah, Hawaii
  49. Los Angeles, California
  50. Fort Smith, Arizona
  51. Fort Worth, Texas
  52. Denver, Colorado
  53. Arlington, Texas
  54. Buffalo, New York
  55. Greensboro, North Carolina
  56. Bakersfield, California
  57. Fort Wayne, Indiana
  58. Providence, Rhode Island
  59. Tacoma, Washington
  60. Port St. Lucie, Florida
  61. Lewiston, Maine
  62. Laredo, Texas
  63. Cape Coral, Florida
  64. Grand Prairie, Texas
  65. Garland, Texas
  66. Aurora, Colorado

Cities 92 Through 137

This is where things begin to turn around, at least mathematically. This is the “bottom” half of the list.

Or, to phrase it another way, this section starts identifying the least-stressed cities in America.

  1. Portland, Oregon
  2. Ontario, California
  3. Lubbock, Texas
  4. Reno, Nevada
  5. Huntsville, Alabama
  6. Sacramento, California
  7. Amarillo, Texas
  8. Albuquerque, New Mexico
  9. Tampa, Florida
  10. Long Beach, California
  11. Colorado Springs, Colorado
  12. Fontana, California
  13. Tallahassee, Florida
  14. Las Cruces, New Mexico
  15. Worchester, Massachusetts
  16. Orlando, Florida
  17. West Valley City, Utah
  18. Fort Lauderdale, Florida
  19. Peoria, Arizona
  20. Riverside, California
  21. Mesa, Arizona
  22. Nashville, Tennessee
  23. Des Moines, Iowa
  24. Nampa, Idaho
  25. Tempe, Arizona
  26. Irving, Texas
  27. Oakland, California
  28. Grand Rapids, Michigan
  29. Charlotte, North Carolina
  30. Rancho Cucamonga, California
  31. Boston, Massachusetts
  32. Pittsburgh, Pennsylvania
  33. Honolulu, Hawaii
  34. Oceanside, California
  35. Pearl City, Hawaii
  36. Anchorage, Alaska
  37. Warwick, Rhode Island
  38. Virginia Beach, Virginia
  39. Cheyenne, Wyoming
  40. Petersburg, Florida
  41. Chesapeake, Virginia
  42. Billings, Montana
  43. Lexington-Fayette, Kentucky
  44. Durham, North Carolina
  45. Santa Ana, California
  46. Jersey City, New Jersey

Cities 138 through 182

Finally, we reach what cities, according to WalletHub analysis, experience the least amount of stress.

  1. Salt Lake City, Utah
  2. Aurora, Illinois
  3. Santa Clarita, California
  4. Glendale, California
  5. Manchester, New Hampshire
  6. Paul, Minnesota
  7. Garden Grove, California
  8. Pembroke Pines, Florida
  9. Yonkers, New York
  10. Chandler, Arizona
  11. Oxnard, California
  12. Juneau, Alaska
  13. Anaheim, California
  14. Santa Rosa, California
  15. Chula Vista, California
  16. Charleston, South Carolina
  17. Raleigh, North Carolina
  18. San Francisco, California
  19. Huntington Beach, California
  20. Omaha, Nebraska
  21. San Diego, California
  22. Gilbert, Arizona
  23. Scottsdale, Arizona
  24. Rapid City, South Dakota
  25. Austin, Texas
  26. Seattle, Washington
  27. Minneapolis, Minnesota
  28. Missoula, Montana
  29. Boise, Idaho
  30. Nashua, New Hampshire
  31. Plano, Texas
  32. Cedar Rapids, Iowa
  33. Lincoln, Nebraska
  34. Portland, Maine
  35. Irvine, California
  36. Burlington, Vermont
  37. Sioux Falls, South Dakota
  38. Bismarck, North Dakota
  39. San Jose, California
  40. Columbia, Maryland
  41. Fargo, North Dakota
  42. Overland Park, Kansas
  43. Madison, Wisconsin
  44. South Burlington, Vermont
  45. Fremont, California

Twelve of the cities on this part of the list are in California. Further, the least-stressed city in California: Fremont. If you read yesterday’s article, you know that WalletHub ranked Fremont, California, the happiest city in the US.

Image: Nathan Dumlao on Unsplash

by David Klemt David Klemt No Comments

Which Cities and States are the Happiest?

Which US Cities and States are the Happiest?

by David Klemt

Yellow smiley face ball

As an entrepreneur and operator evaluating a market for a first location or expansion, it can help to know where people are happiest.

Equally as helpful: Knowing the cities and states that are the least happy. Not, necessarily, so an operator can avoid these markets.

Rather, one’s concept may be a ray of stress-free sunshine for a given community. Providing a great workplace with a positive culture can work wonders for both the happiest and least-happy places. And as the cornerstones of the communities they serve, restaurants and bars can improve their guests’ quality of life.

We’ve looked at the US cities with the greatest inflow and outflow (which can reveal happiness levels), as identified by Redfin. And we’ve checked out the best US retirement cities, researched by Clever.

Now, we’re taking a look at which US cities and states are the happiest and least happy, according to WalletHub. In case you’re unaware, personal finance site WalletHub researches a vast array of topics. You can browse them here.

Happiest Cities

While determining which are happiest, WalletHub identified the happiest 182 cities. Obviously, that’s a far cry from how many cities are in the US.

According to one source, there 19,495 cities, towns, and villages across the country (per data from 2018). Of those, 4,727 cities have populations of 5,000 or more. A total of 310 cities have populations of at least 100,000, and only ten are home to one million people or more.

So, living in any of the 182 cities WalletHub suggests one is pretty happy. However, these are the ten happiest cities, in descending order:

  1. Fremont, California
  2. Columbia, Maryland
  3. San Francisco, California
  4. San Jose, California
  5. Irvine, California
  6. Madison, Wisconsin
  7. Seattle, Washington
  8. Overland Park, Kansas
  9. Huntington Beach, California
  10. San Diego, California

As you can see, six of the 10 cities are in California. In fact, 29 of the 182 cities on this list are located in the Golden State.

To create their list, WalletHub analyzed several metrics that make up three main categories: emotional and physical well-being; work environment; and community and environment.

Fremont, CA, is number one for emotional and physical well-being. The top spot for work environment goes to San Francisco, CA. And the number-one city for community and environment is Casper, Wyoming, which is number 79 on the list overall.

Least-happy Cities

Again, understanding that there are more than 19,400 cities, towns, and villages in the US alters the context of this list a bit.

Living and operating in one of these 182 cities indicates a person is living in a happy city. Basically, it isn’t the worst place to live if it’s on this list.

At any rate, let’s look at the 10 cities that make up the bottom of WalletHub’s list. Or, the “least-happy” cities, at least as far as these rankings are concerned.

  1. Detroit, Michigan
  2. Gulfport, Mississippi
  3. Memphis, Tennessee
  4. Huntington, West Virginia
  5. Montgomery, Alabama
  6. Cleveland, Ohio
  7. Augusta, Georgia
  8. Fort Smith, Arizona
  9. Mobile, Alabama
  10. Shreveport, Louisiana

Happiest States

WalletHub also ranked 50 states to determine the happiest and least happy. I checked, and, yep, that’s all of ’em! I will say it’s a bit disappointing they didn’t include Puerto Rico, but it isn’t the 51st state (yet).

WalletHub focused on 30 metrics to rank the states, which make up three main categories: emotional and physical well-being; work environment; and community and environment.

In descending order, the happiest states in America are:

  1. Hawaii
  2. Maryland
  3. Minnesota
  4. Utah
  5. New Jersey
  6. Idaho
  7. California
  8. Illinois
  9. Nebraska
  10. Connecticut

Hawaii doesn’t just take the top spot overall, it also claims number one for emotional and physical well-being. Utah takes first for work environment, and community and environment.

Rounding out the “happiest half” of the US are:

  1. Virginia
  2. South Dakota
  3. North Dakota
  4. Massachusetts
  5. New Hampshire
  6. Iowa
  7. Delaware
  8. Florida
  9. Georgia
  10. North Carolina
  11. Wisconsin
  12. Washington
  13. New York
  14. Maine
  15. Wyoming

Least-happy States

Conversely, the following are the least-happy states, starting with the unhappiest:

  1. West Virginia
  2. Louisiana
  3. Arkansas
  4. Kentucky
  5. Alabama
  6. Mississippi
  7. Oklahoma
  8. Tennessee
  9. New Mexico
  10. Missouri

Filling out the least-happy half of the country are:

  1. Alaska
  2. Michigan
  3. Ohio
  4. Indiana
  5. Texas
  6. Nevada
  7. Vermont
  8. South Carolina
  9. Kansas
  10. Arizona
  11. Colorado
  12. Montana
  13. Rhode Island
  14. Pennsylvania
  15. Oregon

In terms of the three metrics WalletHub analyzed, West Virginia is ranked last for emotional and physical well-being. Unfortunately, Mississippi is last for work environment. And Texas comes in last for community and environment.

Image: chaitanya pillala on Unsplash

by David Klemt David Klemt No Comments

Why is the SBA Sitting on RRF Funds?

Why is the SBA Sitting on Tens of Millions in RRF Funds?

by David Klemt

Pile of $100 bills

Three months after the revelation that the SBA is sitting on $180 million in RRF funds, we’re wondering why they still aren’t disbursing the money.

Oh, and a handful of American lawmakers have the same question. In fact, two members of the House and two senators are requesting a plan from the SBA.

The patience of Representatives Earl Blumenauer (D-OR) and Brian Fitzpatrick (R-PA) appears to be at its end. So, too, the willingness for Senators Kyrsten Sinema and Roger Wicker (R-MS) to simply wait and see.

So, the bipartisan lawmakers are playing hardball, sending a strongly-worded letter to the Small Business Administration.

$180 Million in Available Funds

As it turns out, there are are tens of millions of dollars in unallocated Restaurant Revitalization Funds. Months ago, the Government Accountability Office (GAO) investigated the RRF situation.

Back in July, the fruits of the investigation came to light: of the $28.6 billion in the RRF, $180 million have not been disbursed. Further, it was reported in August that the SBA was working the Department of Justice to “formulate a plan on how to distribute” the money.

It’s now November and…there’s no news. Well, there’s news, but it’s that four bipartisan lawmakers are demanding answers and action from the SBA.

Look, $180 million is a far cry from the $40 billion our industry needed and deserved to have approved to replenish the RRF. Indeed, if every dollar of this “found” money is distributed to RRF applicants, just 0.44 percent would receive a grant.

However, nearly $200 million in funds can still help some operators. There’s simply no excuse for the SBA failing to disburse the funds six months after the GAO made their discovery.

Clearly, several lawmakers agree with this assessment.

Lawmakers Seek Action from the SBA

Earlier this week, Reps. Blumenauer and Fitzpatrick, and Sens. Sinema and Wicker, sent a letter to the SBA. Not only are they seeking action from the SBA, they’re seeking a plan by next week.

“We request the SBA provide Congress with a detailed plan and timeline to distribute unobligated RRF funding as well as detailed information regarding the agency’s progress in retrieving misallocated funds and distributing those funds to eligible applicants no later than Monday, November 14, 2022,” reads the letter.

Further, the lawmakers make their position clear: “It is inexcusable for the Small Business Administration to not dispense every single available dollar to help as many of our nation’s still struggling main street businesses.”

According to reports, the lawmakers who penned the letter are working with the Independent Restaurant Coalition and National Restaurant Association. Reporting states that the IRC and NRA endorse the letter sent by the lawmakers this week.

As of the publication of this article, the SBA has issued no response. Unfortunately, that’s not exactly surprising. After all, they’ve been silent on this topic for months.

Image: Giorgio Trovato on Unsplash

by krghospitality krghospitality No Comments

2023: Year of the POS Systems?

2023: Year of the POS Systems?

by David Klemt

SpotOn POS system on laptop

Image from SpotOn press release

According to SpotOn, the industry could be in for a tech revolution next year as independent operators pursue more powerful POS solutions.

The results of a survey conducted by the cloud-based POS platform are rather revealing. In an effort to better understand where the industry is heading, SpotOn surveyed 300 independent and small-chain restaurant operators.

Both full-service and limited-service (LSR) concept operators participated in this SpotOn survey. Intended to identify the challenges operators face currently, the results reveal much more.

Below, the picture these survey results paint for the industry.

Legacy vs. Innovation

This isn’t the first time I’ve stated the following: Our industry hasn’t been the fastest to implement new technology.

However, we did appear to turn that around in 2021. Now, heading into 2023, our industry may be pursuing cutting-edge tech solutions even more fervently. Today’s guest expects more tech, and your team likely wants access to more modern tech that makes their jobs easier.

Per SpotOn’s survey, 81 percent of independent operators still use so-called “legacy” POS systems. These are “traditional” systems from companies that have been around for quite some time.

It’s not difficult to understand why the vast majority of independent operators continue using legacy systems:

  • Investing in a new platform requires expenditures of money and time.
  • Introducing a new POS platform requires staff training.
  • Staff need to grow adept at using the new system.
  • It can be daunting to research the available platforms and implementing change.

So, independent and small-chain operators have a choice to make: Stick with the familiar or invest in the future. Change can not only be intimidating, it can be expensive.

However, it seems that most operators are ready to throw comfort to the wayside and embrace innovation.

State-of-the-art Benefits

Should the SpotOn survey prove to be accurate snapshot of the industry, 75 percent of operators will implement new tech next year. According to SpotOn, this is largely in response to growing labor challenges, such as scheduling and retention.

The restaurant, bar, nightclub, and food truck platform found that operators are spending as much as 20 hours per week on administrative tasks. State-of-the-art POS systems can slash those hours by:

  • streamlining operations;
  • making scheduling simpler;
  • calculating tips and payout for payroll; and
  • managing overtime, an increasingly common task.

More modern POS platforms can automate labor management tasks, saving operators time, money, and frustration. Automation and streamlining give operators something invaluable: time.

In particular, innovative and helpful tech solutions provide an operator with time to focus on growing their business. When weighing whether to keep a familiar but less feature-rich POS system or invest in a modern platform that seamlessly integrates many solutions, ask yourself a couple important questions:

  • What’s my time worth?
  • What am I focusing on every day?
  • Am I growing my business or stagnating?
  • Is my current POS system helping or hindering my team?
  • Does my POS system streamline and automate any tasks?

Image: SpotOn

by David Klemt David Klemt No Comments

Are You Rewarding Voters Today?

Are You Rewarding Voters Today?

by David Klemt

"I Voted" stickers on a white background

Voting is one of the hallmarks of democracy, a right and privilege so crucial that one can’t overstate or exaggerate the value and importance.

It is, therefore, supremely unfortunate that access to this right has become so acrimoniously political. Of course voting relates to politics—that’s a given. That doesn’t mean the act itself should be disingenuously politicized for twisted means.

For example, far too many people have grown convinced that their vote means nothing. Further, it’s an outrage that voting is made so difficult for so many who know voting matters.

So important is this fundamental right, there are three amendments to the US Constitution protecting it specifically: the Fifteenth, Nineteenth, and Twenty-sixth.

Before going further, I’m not this passionate in support of only those who vote “my way.” I want every American of voting age to have easy access to cast their ballot. Equally as important to me, I want every American to feel like their vote means something.

Of course, that also means accepting results we don’t like. We don’t always get our way in a democracy, after all.

This is all to say the following: Operators can play a role in elections. A simple-yet-important role.

Encourage Voters

I’m not the first to say it: Restaurants and bars are the cornerstones of their communities.

Back in June, I expressed the role our industry plays across the country and globe: “Restaurants and bars are pillars, cornerstones of the communities they serve. These are businesses that welcome people in, treat them like family. They’re there for them as they move through their lives. People who were seemingly at odds with another routinely found common ground over a bite and a sip. More often than not, that’s still the case.”

I still believe this, and that’s why I believe operators can play a role on this Election Day, and those in the future. The role is simple but powerful: Encourage your community to get out there and vote.

Now, one clear way to motivate your community to get out there today is to reward those wearing “I Voted” stickers when they visit your restaurant or bar. It’s commonplace now for operators to offer voters food and drink discounts, free menu items, or other perks on Election Day.

Restaurants and bars around the country routinely execute this type of promotion. From free sides and snacks to discounts on entrees and drinks, operators throughout the US find ways to encourage voting.

Proceed with Caution

Just keep something in mind: Legal scholars say that when federal candidates are on the ballot, such promotions are illegal.

The interpretation of a particular federal statute makes it illegal to pay people to vote. “Paying” includes providing something of value in exchange for voting, such as food or a drink.

One workaround is to ensure anyone who enters your business can participate in your promotion. No “I Voted” sticker? No problem. A guest says they haven’t voted? Not a disqualification.

Another solution is to simply encourage your social media followers to vote and come by for a visit. No reward, necessarily, just encouragement to exercise their right.

In other words, be the supporter and motivator your community needs. And be careful about any promotions you may be offering today.

Image: Element5 Digital on Unsplash

by David Klemt David Klemt No Comments

Tipping is on the Ballot in Washington, DC

Tipping is on the Ballot in Washington, DC

by David Klemt

Folded dollar bills

Out of concern that people who work for tips aren’t making minimum wage in Washington, DC, Initiative 82 is on the ballot.

This is interesting for several reasons. One of which is the fact this isn’t the first time this issue has been voted on in DC.

Back in 2018, Initiative 77 was presented to Washington, DC, voters. The initiative took the $3.33 per hour minimum wage for tipped workers up to $15 per hour, the full minimum wage.

In June 2018, the measure was approved by voters. However, the Washington, DC, Council held a vote and repealed Initiative 77 after if had been passed.

Phil Mendelson (D-Chairman) of the Washington, DC, Council, introduced the bill that ultimately repealed Initiative 77 in October 2018.

“The Council amends laws all the time. And if a law is a bad law it should be amended or repealed,” said Mendelson at the time. “It doesn’t matter if the law was adopted by Congress, the voters, or ourselves.”

Further, Mendelson claimed that tipped workers themselves—bartenders, servers, valets, manicurists, and more—didn’t hold a favorable view of the passing of the initiative.

“77 may be well-intentioned, but the very people the Initiative is intended to help are overwhelmingly opposed. If we want to help workers – protect them from harassment and exploitation – there are better ways than Initiative 77,” Mendelson said.

One council member, Mary Cheh (D-Ward 3), opposed repealing Initiative 77 and addressed claims that it was harmful to tipped workers.

“Although I take these claims seriously, in my view they are speculative and not borne out by the experience of the other jurisdictions that have one wage,” said Cheh.

Support

Whenever increasing tipped worker wages to full minimum wage comes up, we tend to encounter the same arguments for and against.

Currently, the tipped hourly wage in DC is $5.35 per hour. In comparison, full minimum wage in DC is $16.10 per hour.

Now, as the law reads, if a tipped worker’s wages don’t equate to full minimum wage, their employer is expected to bridge the gap.

The key argument for the passing of Initiative 82 is simple: tipped workers should make at least minimum wage. These workers deserve the stability of knowing how much they’ll make each shift and earning a living wage (consistently, hopefully).

Those who support Initiative 82 also say that since the measure doesn’t outlaw tipping, tipped workers would earn more than minimum wage.

Opposition

Opponents, however, argue that the initiative will harm tipped workers. Some say that operators will cut shifts and increase prices in response to Initiative 82 passing. This will, of course, lead to servers, bartenders, and other tipped workers making much less than they did in the past.

Traffic may also decrease because it’s assumed that operators will increase costs significantly.

There’s also the argument that’s often (if not always) made when this topic comes up: Tipped workers themselves don’t support these initiatives.

“I have not met a single server who wants this,” Washington, DC, bar owner David Perruzza told the Washington Blade. Perruzza added, “The people who support this don’t know anything about the service industry.”

A Few Questions…

I’ve made no secret of my cynicism when it comes to politicians and their relationships with our industry.

My main argument was made for me: the Restaurant Revitalization Fund saga. We watched for months as Congress failed to replenish the RRF, leaving more than 177,000 operators and their staffs to fend for themselves. This, after months of dangling replenishment in front of all of us. Ultimately, they abandoned us.

Tellingly, Senator Rand Paul (R-KY) referred to RRF replenishment as a “bailout.” And apparently he doesn’t think much of the challenges operators have faced since the start of the pandemic, asking, “Where’s the emergency?” The closures of tens of thousands of restaurants and bars, often the cornerstones of communities across the country, doesn’t rank as an emergency, apparently.

So, Initiative 77, Initiative 82, and similar measures beg a few questions:

  • Do politicians actually ask their tipped-wage constituents their thoughts on this topic before introducing these ballot measures?
  • When these initiatives are being considered, do people just ask a few operator friends their opinions?
  • Do local, state, and federal politicians really have a grasp of our industry?

One thing is certain: Industry eyes across the country are on Initiative 82. If it passes, we can likely expect similar measures to be introduced in cities and states. Should it fail, it may be a while before another jurisdiction sees this type of initiative again.

Image: Annie Spratt on Unsplash

by David Klemt David Klemt No Comments

Menus in Canada: Who Wants What Items?

Menus in Canada: Who Wants What Items?

by David Klemt

Bar and restaurant food and drink menus

Nobody has a crystal ball telling them what they should put on their menus to boost traffic and revenue, but we do have data.

In this instance, we have useful data regarding Canadian consumers specifically. Not only do we have helpful information from Restaurants Canada, David Henkes from Technomic has also weighed in. For those who are unfamiliar, Technomic is one of the best foodservice research and consulting firms.

Before we dive into Restaurant Canada’s menu trend information, this is not a review of the top menu item orders in Canada. For a deep dive into that topic in particular, please read our article “F&B in Canada: Top Menu Items.”

Instead, in this article we’re reviewing broader menu categories and interest in them among Canadian consumers. For your own copy of the 2022 Foodservice Facts report, click here.

Word of Warning

Now, it’s important to bear in mind that the data below is a snapshot. It’s important, informative data but it shouldn’t influence your menu completely.

In other words, when considering revising your menu in any way, make sure you’re staying true to your brand and the community you serve. If your data differs from Restaurants Canada and Technomic data, that’s okay.

Not only are there always outliers, not all data applies to every concept. So, don’t take drastic action on your menus based solely on the data below.

For this particular topic, Restaurants Canada asked three age groups about their interest in eight menu categories.

The groups are: 18 to 34, 35 to 54, and 55-plus. The industry advocacy group then reviewed the numbers for those who indicated they’re “very interested” or “somewhat interested” for each category or item.

Who Wants What?

The menu category generating the most interest from Canadian consumers, according to Restaurants Canada data, is food sourced from local farmers. Overall, 93 percent of survey respondents very or somewhat interested. Those in the 55-plus age group are the most interested.

More than 80 percent are interested in comfort foods, or creative riffs on comfort foods. Age groups 18 to 34 and 35 to 54 have the most interest. Precisely 80 percent are interested in trying globally inspired foods and flavors, led by the 18 to 34 age group.

Foods that promote health and wellness come next, with 79 percent of Canadian consumers showing interest. The 55-plus age group is particularly interested. However, dishes that utilize ingredients that boost one’s immune system are only popular among 53 percent of survey respondents. Interestingly, it’s the 18 to 34 age group with the most interest in this category.

In what’s possibly a contrast from American consumers, the final three categories have no more than 41 percent of survey respondents’ interest. Forty-one percent have interest in meatless and vegetarian items. Next, just 38 percent show interest in alcohol-free cocktails. Finally, just 33 percent are interested in plant-based burgers and sausages.

For each of those categories, the greatest interest comes from the 18 to 34 age group, and the 55-plus group shows the least amount of interest.

Recommended Reading

We’ve been reviewing the 2022 Foodservice Facts report from Restaurants Canada in depth for several weeks. To learn more about this important report, please read the following:

Image: Samuel Regan-Asante on Unsplash

by David Klemt David Klemt No Comments

Credit Card Competition Act, Take Two

Credit Card Competition Act, Take Two

by David Klemt

American Express charge cards

As we approach Election Day on November 8, it’s important to keep in mind that the Credit Card Competition Act of 2022 is still in play.

In fact, reports predict that another attempt to pass the bipartisan bill will take place in November. If reports are accurate, Senators Dick Durbin (D-IL) and Roger Marshall (R-KS) will try to include the bill in the National Defense Authorization Act (NDAA).

Now, that sentence and strategy may have you scratching your head. What, you may be asking yourself, do credit card fees have to do with defense spending?

Well, not much, truthfully. But you’re probably well aware that politicians will try to amend bills in bids to pass legislation they want. The common term for such a provision is “rider.”

It’s not difficult to understand why the Credit Card Competition Act has gone nowhere when we view Sens. Durbin and Marshall’s rider tactic.

Earlier this month, the senators attempted to include their bill within the NDAA. The reason is simple: the bill specifies the US Department of Defense’s (DoD) budget and expenditures each year. In other words, this is a “must-pass” bill.

However, Sens. Durbin and Marshall aren’t the only senators sponsoring bills. And they’re certainly not the only senators attempting to attach riders to the NDAA.

“It’s a bold strategy, Cotton.”

I will say, at least Sen. Durbin’s effort to attach the Credit Card Competition Act rider to the NDAA is somewhat related to the DoD.

You see, he and Sen. Marshall tried to tack on two amendments to push their bill through. The first amendment theorizes that veterans are being hurt by credit card fees. According to the senators, when military veterans make purchases at a military commissary, they are sometimes subjected to surcharges related to merchant interchange fees.

The second amendment brings the US Treasury Department and US Defense Department into the mix. This effort directs the departments to research just how much veterans are paying (annually, one would assume) in surcharges, and which companies these fees benefit. Then, the departments are to issue this report to Congress.

So, hey, points for attempting to make including the Credit Card Competition Act of 2022 relate to the NDAA for FY 2022. Of course, other senators are attempting to include their own riders. Should reporting prove accurate, some 900 amendments have been proposed. Supposedly, a few dozen might just make it.

This strategy didn’t work this month because the NDAA vote isn’t taking place in October. Instead, the plan is for the vote to take place sometime mid-November, when the US Senate reconvenes.

To learn more about the Credit Card Act of 2022, click here. If it’s a bill you support, let your elected officials know. Should you oppose the bill, let that be known to lawmakers as well.

Image: CardMapr.nl on Unsplash

by David Klemt David Klemt No Comments

F&B in Canada: Top Menu Items

F&B in Canada: Top Menu Items

by David Klemt

Closeup of hands holding burger

Those wondering what food and beverage menu items are performing best among consumers throughout Canada need wonder no more.

And why is that? Well, Restaurants Canada has the answers, revealing the top ten food and top ten beverage items.

Further, the organization compares each item’s performance. In this instance, Restaurants Canada analyses the percentage of orders that contained each food or beverage item from January to April 2022 in comparison to 2019.

These insights (and many more) are available in Restaurants Canada’s 2022 Foodservice Facts report. In fact, you can find our reviews of several of the restaurant advocacy group’s report topics via the links below:

For your own copy of this year’s Foodservice Facts report, click here.

Top 10 Canadian Drink Menu Trends

As you’ll see below, coffee is outperforming nearly every other beverage category. Specifically, Hot coffee is at the top, while Iced or frozen coffee is ranked third.

Unsurprisingly, Carbonated soft drinks / Pop / Soda split the two coffee categories. According to Restaurants Canada, the Carbonated soft drink category can credit its performance in large part to QSRs.

  1. Milk: 1.8% (2019) to 1.8% (2022)
  2. Iced tea: 2.9% (2019) to 1.6% (2022)
  3. Milkshakes / Smoothies: 2.1% (2019) to 2.0% (2022)
  4. Fruit juice: 3.8% (2019) to 3.0% (2022)
  5. Hot tea: 5.5% (2019) to 4.5% (2022)
  6. Alcohol beverages: 5.1% (2019) to 5.7% (2022)
  7. Water: 6.6% (2019) to 5.0% (2022)
  8. Iced or frozen coffee: 5.3% (2019) to 7.5% (2022)
  9. Carbonated soft drinks / Pop / Soda: 19.7% (2019) to 20.2% (2022)
  10. Hot coffee: 40.9% (2019) to 41.9% (2022)

Compellingly, Alcohol beverage performance in restaurants fluctuated by age group between 2021 and 2022. Alcohol order shares in restaurants, per Restaurants Canada:

  • Legal drinking Age (LDA) to 34: 46% (2021) to 43% (2022)
  • 35 to 49: 17% (2021) to 21% (2022)
  • 50-plus: 37% (2021) to 36% (2022)

Alcohol order shares in bars, according to Restaurants Canada:

  • LDA to 34: 35% (2021) to 35% (2022)
  • 35 to 49: 17% (2021) to 19% (2022)
  • 50-plus: 49% (2021) to 47% (2022)

Overall, the 35 to 49 age group appears to be consuming less alcohol in bars and restaurants in comparison to the LDA to 34 and 50-plus cohorts.

Top 10 Canadian Food Menu Trends

As Restaurants Canada notes, the Sandwich / Sub category has grown in 2022. Interestingly, the category just below it in growth, Chicken, is partially responsible for boosting Sandwich / Sub performance.

As far as entrees or “main attractions,” the Burger category remains at the top, beating out Breakfast, Sandwich / Sub, Chicken, and Pizza menu items.

  1. Cake / Squares / Muffins: 3.7% (2019) to 3.3% (2022)
  2. Salad: 4.3% (2019) to 3.8% (2022)
  3. Donuts / Beignets: 3.0% (2019) to 3.8% (2022)
  4. Breads: 4.3% (2019) to 3.4% (2022)
  5. Pizza / Panzerotti / Calzone: 4.1% (2019) to 4.3% (2022)
  6. Chicken: 7.6% (2019) to 8.5% (2022)
  7. Sandwich / Sub: 8.0% (2019) to 8.5% (2022)
  8. Breakfast: 10.8% (2019) to 11.4% (2022)
  9. Burger: 9.0% (2019) to 10.9% (2022)
  10. French fries / Potato / Sweet potato / Onion rings: 15.0% (2019) to 16.1% (2022)

Image: Nathan Dumlao on Unsplash

by David Klemt David Klemt No Comments

Bon Appétit Reveals Best New Restaurants

Bon Appétit Reveals the Best New Restaurants in 2022

by David Klemt

Fine dining Ecuadorian dish

Condé Nast’s American food and restaurant publication Bon Appétit identifies the 50 restaurants they deem the very best in 2022.

The intriguing list highlights the consumer desire to try a wide range of global cuisines. Indeed, were one to eat their through Bon Appétit‘s 2022 list, they’d enjoy both traditional and modern:

  • African (notably, Nigerian)
  • Cantonese
  • Caribbean
  • Eastern European (Hungarian, in particular)
  • Filipino
  • French
  • Indian (including Goan and Kashmiri)
  • Italian
  • Japanese
  • Jewish
  • Korean
  • Laotian
  • Mexican
  • Palestinian
  • Portuguese
  • Vietnamese

Of course, one will also find American cuisine. Of note, Texas barbecue, elements of Memphis barbecue, Low Country, Cajun cooking, and Midwest comfort food. There are also restaurants offering creative takes on traditional steakhouse fare. One restaurant’s focus, The Nicolett in Lubbock, Texas, is High Plains cuisine. (For those wondering, Bon Appétit describes this as “West Texas terroir.”)

This is a compelling list, showing that consumers crave a balance between comfort food and stepping outside of their comfort zones to discover cuisines that are new to them. I encourage everyone to look into these restaurants for inspiration and motivation.

Regional Performance

For simplicity, Bon Appétit arranges their list by dividing the US into four large regions: Midwest, Northeast & Mid-Atlantic, South, and West.

Interestingly, the South claims the most restaurants on this list of the 50 best, earning 17 spots. Northeast & Mid-Atlantic restaurants grab 15 spots, the West takes 12, and the Midwest claims just six.

When it comes to the South, Texas performs the best in terms of number of restaurants on the list. There are two in Austin, and one each in Fort Worth, Garland, Houston, Lubbock, and San Antonio.

However, Florida, Georgia and Louisiana also do well for the South, earning three spots each in the following cities:

  • Miami (2) and North Miami (1)
  • Atlanta (2) and Savannah (1)
  • New Orleans (3)

Unsurprisingly, New York leads the way for the Northeast & Mid-Atlantic region. Drilling down, Brooklyn boasts four of Bon Appétit‘s 50 Best New Restaurants 2022; New York City is the home of three; and one is in Hudson.

Pennsylvania, however, claims three spots, all in Philadelphia.

Equally as foreseeable, California boasts the most restaurants among this list of fifty. Predictably, most are in Los Angeles, which claims three in total. Oakland, San Diego, and San Francisco round out California’s spots with one each. Coming in second in terms of Western states with multiple restaurants on the list is Oregon, with two in Portland.

Unfortunately, the Midwest simply doesn’t perform nearly as well on this year’s list as its counterparts. In fact, it has just half the number of restaurants as the third-place region with six. Cincinnati, Ohio, takes a third of those spots. Surprisingly, Chicago is home to just one restaurant on this list.

The 50 Best New Restaurants

Below you’ll find Bon Appétit‘s list in alphabetical order.

  • Agi’s Counter (Brooklyn, NY)
  • Baba’s Pantry (Kansas City, MO)
  • Bacanora (Phoenix, AZ)
  • Bata (Tucson, AZ)
  • Birdie’s (Austin, TX)
  • Bocadillo Market (Chicago, IL)
  • Bonnie’s (Brooklyn, NY)
  • Cafe Mochiko (Cincinnati, OH)
  • Cafe Mutton (Hudson, NY)
  • Canje (Austin, TX)
  • Common Thread (Savannah, GA)
  • Daru (Washington, DC)
  • Daytrip (Oakland, CA)
  • Dear Annie (Cambridge, MA)
  • Dept. of Culture (Brooklyn, NY)
  • El Rincon del Maiz (Garland, TX)
  • Gage & Tollner (Brooklyn, NY)
  • Good Good Culture Club (San Francisco, CA)
  • Her Place (Philadelphia, PA)
  • Irwin’s (Philadelphia, PA)
  • Juniper Cafe (Atlanta, GA)
  • Kingfisher (San Diego, CA)
  • Korshak Bagels (Philadelphia, PA)
  • La Diabla Pozole y Mezcal (Denver, CO)
  • La Onda (Forth Worth, TX)
  • Lasita (Los Angeles, CA)
  • Lengua Madre (New Orleans, LA)
  • Los Félix (Miami, FL)
  • Lucian Books and Wine (Atlanta, GA)
  • Ma Der Lao Kitchen (Oklahoma City, OK)
  • March (Houston, TX)
  • Mid-City Restaurant (Cincinnati, OH)
  • Mister Mao (New Orleans, LA)
  • Morchella (Portland, OR)
  • The Nicolett (Lubbock, TX)
  • One White Street (New York, NY)
  • Paradis Books & Bread (North Miami, FL)
  • Phởcific Standard Time (Seattle, WA)
  • Quarter Sheets (Los Angeles, CA)
  • Reese Bros Barbecue (San Antonio, TX)
  • Regards (Portland, ME)
  • República (Portland, OR)
  • Seafood Sally’s (New Orleans, LA)
  • Semma (New York, NY)
  • Sozai (Clawson, MI)
  • Sunny’s Steakhouse (Miami, FL)
  • Supperland (Charlotte, NC)
  • Uncle Lou, New York, NY)
  • Yangban Society (Los Angeles, CA)
  • Z&Z Manoushe Bakery (Rockville, MD)

Image: Kiyoshi on Unsplash

by David Klemt David Klemt No Comments

Learn to Homebrew Day Returns on Nov. 5

Learn to Homebrew Day Returns on November 5

by David Klemt

Snifter of beer on driftwood at beach

On Saturday, November 5, the American Homebrewers Association and brewing and fermenting fans will celebrate the 24th annual Learn to Homebrew Day.

If you’re not familiar with this holiday, it’s not difficult to understand or participate. As the name implies, Learn to Homebrew Day is about learning how to brew beer at home. More accurately, it’s about learning the science and process of brewing beer yourself.

Participation is simple: All participants follow the same recipe, which the American Homebrewers Association (AHA) provides. This year, the recipe will (perhaps “should” is more apt, depending on your ability to follow instructions) produce one gallon of Hoppy Amber Ale.

According to Northwest Beer Guide, this ale sends Amber into the IPA space and is a great brew for experts and neophytes alike.

Learn to Brew

Established in 1999, Learn to Homebrew Day isn’t difficult in terms of taking part. In fact, pledging to participate also gets you $5 off an annual AHA membership.

One perk that caught my eye is access to a database of myriad homebrew recipes, including ciders and meads.

For this year’s holiday, the AHA provides the recipe. Additionally, the association provides several resources to help homebrewers, inluding:

  • tutorials, such as “All-Grain (Batch Sparge) Homebrewing” and “All-Grain (Brew in a Bag) Homebrewing.”
  • lists of must-have and nice-to-have brewing equipment;
  • a search engine to help participants find necessary equipment in their area; and
  • a link to the Facebook page for Grainfather, a manufacturer of top-quality, technologically enhanced smart homebrew equipment.

Speaking of social media, make sure to follow the AHA on Instagram ahead of November 5.

Interestingly, while the AHA has “American” in its name, there are international participants. According to the AHA website:

  • there are, as of October 23, 147 people pledging to participate;
  • the 147 participants are from nine countries;
  • participants span 36 states and territories;
  • and participants have pledge to brew 925 gallons.

Why Participate

So, let’s say you’ve never brewed your own beer at home. “Why,” you may be asking yourself, “should I take part in Learn to Homebrew Day this year?”

One good reason is that if you’re reading this, you likely play a role in the food and beverage. Beer, of course, is a huge part of the F&B world. And there’s no arguing that craft beer and microbrews are very important to many restaurants and bars.

Gaining the ability to understand and speak intelligently about the products you sell is of great benefit to all F&B and hospitality professionals. Today’s guest knows much more than they ever have before. Many want to engage the front-of-house team members who serve them about what they’re consuming.

If you’re an operator or leader of the membership team—particularly of a venue with a serious focus on beer—encourage your teams to take part. There’s no downside to gaining knowledge of and experience with the products they serve to guests.

Another great reason to participate? It’s going to be fun. That may seem like a shallow or flippant reason. But think about this: How many stories of craft brewers, craft breweries, brewpubs, and taprooms start with trying out homebrewing?

Learn to Homebrew Day may just spark your next great idea. That idea may be kicking off your microbrewery or brewpub ownership adventure.

If you love (or even just like) beer, follow this link to learn more about Learn to Homebrew Day. Happy brewing!

Image: by George Cox on Unsplash

by David Klemt David Klemt No Comments

Cali Chains Move Quickly to Kill FAST

California Chains Move Quickly to Kill FAST

by David Klemt

Huge pile of cash

If recent reporting is accurate, fast food chains with locations in California are fighting the Fast Food Accountability and Standards Recovery Act.

Several well-known restaurant chains have reportedly already dumped well over $10 million into a ballot drive effort. Among the chains lobbying to kill the bill are In N Out, McDonald’s, Wendy’s, and Chipotle.

In other words, the group of chains aiming to defeat AB-257 in California have very deep pockets. These heavy hitters are reaching deep to contribute millions of dollars to Save Local Restaurants, the coalition responsible for starting the ballot initiative.

And who are the Save Local Restaurants coalition members? The National Restaurant Association (NRA), US Chamber of Commerce (USCC), and International Franchise Association (IFA).

What is AB-257?

The Fast Food Accountability and Standards Recovery Act, also known as the FAST Act, is a California bill. Enacted on September 5 of this year, FAST amends a section of the state’s labor code that relates to food facilities and employment.

Click here to review the bill’s text in its entirety.

To summarize, FAST does the following:

  • Establishes the Fast Food Council, ten members appointed by the Governor, the Speaker of the Assembly, and the Senate Rules Committee. The council will operate until January 1, 2029.
  • Defines “the characteristics of a fast food restaurant.”
  • Gives the Fast Food Council the authority to set “minimum fast food restaurant employment standards, including standards on wages, working conditions, and training.”
  • Provides the council the power to “issue, amend, and repeal any other rules and regulations, as necessary.”
  • Allows the formation of a Local Fast Food Council by a county, or a city that has a population of more than 200,000.

It’s that third bullet point that likely stands out the most to chain operators. On January 1, 2023, California’s minimum wage increases to $15.50 an hour. If the Save Local Restaurants ballot initiative fails, the Fast Food Council could boost the minimum wage to $22 per hour right after we all yell, “Happy New Year!”

Proponents say the bill protects the health, safety, and welfare of fast-food workers. Opponents call it radical.

Fighting FAST

According to Save Local Restaurants, it’s not just chains that want to kill FAST:

“The FAST Act is opposed by small and family-owned businesses, minority-rights groups, workers, consumers, your favorite restaurants, taxpayers and community-based organizations,” reads their website.

Among their reasons for attempting to kill the bill are:

  • a resulting increase in the price of food;
  • the elimination of thousands of jobs in California;
  • an increase in the cost of living in the state; and
  • the millions of dollars the coalition claims the bill will cost California taxpayers annually.

Reportedly, full-service restaurant operators also oppose FAST. The reason is simple: If the Fast Food Council hikes fast-food worker minimum hourly wages significantly, FSRs will struggle to compete. FSR operators will have to hike menu item prices further, a situation that’s growing untenable as consumers balk at paying more at restaurants.

Then, there’s the fact that bills similar to FAST could pass in other states. So, chains are contributing millions to see that the Save Local Restaurants ballot initiative succeeds.

Should the effort be successful, FAST will be included on California’s 2024 ballot. That means it will be suspended until 2024 and be in the hands of the voters.

Image: Tima Miroshnichenko via Pexels

by David Klemt David Klemt No Comments

Go Clean this International G&T Day

Go Clean this International G&T Day

by David Klemt

CleanCo Clean G bottle

Today we raise a glass to a centuries-old spirit and a classic cocktail that historians can trace back to at least the mid-1800s.

In other words, happy International Gin & Tonic Day!

Now, I’m willing to go out on a limb and say that you and your bar team probably have your G&T builds down. It’s one of—if not the—most well-known highballs in existence.

So, no, I’m not going to write an article about how to make a G&T. It’s elegant, it’s simple, and bar professionals shouldn’t be behind the stick if they can’t make at least a decent one.

Instead, I want to introduce you to a non-alcohol spirits brand you should know: CleanCo. As an alcohol-free brand, CleanCo is ideal for Sober October and beyond.

If you already know CleanCo, cheers! But if this is you’re first time getting to know the brand, here’s what you need to know.

About CleanCo

Spencer Matthews founded CleanCo in 2018. At just a few years old, this isn’t a brand-new company.

However, anyone who knows the beverage industry knows it takes time for young brands to fight through the noise and be heard. Suffice to say, CleanCo is making themselves known in 2022.

Before starting the alcohol alternative brand, Matthews “lived in a cycle of drinking excessively for most” of his twenties. In fact, under the About section on the CleanCo website, Matthews states he sought out jobs that encouraged his hard-drinking lifestyle. That changed before the arrival of his first child. Matthews decided to “go clean” and says it changed his life.

However, Matthews doesn’t expect others to abstain from alcohol consumption completely. That is, of course, a personal choice. Rather, Matthews seeks to provide an alternative that people will actually want to drink.

Whether a guest is choosing to not consume alcohol for a round, an evening, a week, a month, or for the foreseeable future, CleanCo’s mission is to help deliver a seamless drinking experience without the alcohol.

Along with Clean G, CleanCo’s gin alternative, the brand offers rum, vodka, and tequila expressions that are 0.5-percent ABV or lower.

Clean G&T

Just like the original classic this non-alcohol-cocktail mimics, the Clean G&T is simple to make.

In fact, the ratio of Clean G gin alternative to tonic is same as its full-alcohol counterpart.

  • 2 oz. Clean G
  • 4 oz. Tonic
  • Two lime slices or wheels to garnish

To build, add Clean G and tonic to a tall glass. Next, add ice along with one lime slice or wheel to layer the garnish throughout the length of the drink. Finally, place the other lime slice or wheel on top, and serve.

Image: CleanCo

by David Klemt David Klemt No Comments

Your Guests are Likely Ready for More Tech

Your Guests are Likely Ready for More Tech

by David Klemt


Raspberry Pi motherboard

After the past few years of innovation and implementation in our industry, guests are probably ready to use even more technology.

Driven in large part by operator adaptation to ever-changing restrictions in 2020 and 2021, guest-facing tech is far more prevalent than ever. This is particularly true in the quick-service restaurant space.

Of course, tech has certainly become a crucial operational component in the full-service space as well. However, operators many FSR operators find themselves walking a fine between tech innovation and providing personalized service.

Restaurants Canada addresses QSR and FSR tech implementation in their 2022 Foodservice Facts report. Click here for your own copy of the report.

QSR vs FSR Implementation

One benefit of updating a given operation’s tech stack is automation. After all, more tasks handled automatically via tech solutions means a reduction in labor costs.

In theory, removing mundane tasks from front-of-house team members should equate to guests receiving more personalized service. Equally as impactful: Many guests would rather have more control over their visit in the names of convenience and speed.

A couple of examples are placing orders and paying via tablet or other table-side device. For some guests, this is more convenient than the traditional method.

As stated above, QSRs have been quick to embrace and implement tech innovations. And according to a Restaurants Canada survey, nearly three-quarters of QSR operators will wade deeper into tech waters within the next two years. Almost half—49 percent—of QSR survey respondents “probably will” increase their usage of technology by April 2024; a quarter “definitely will.”

On the FSR side, operators are a bit more cautious in their approach to their tech stacks. Of these survey respondents, 37 percent will probably adopt more tech within the next two years, while 15 percent say they “definitely will” do so.

Per Restaurants Canada, the three main concerns of operators relating to implementing more tech are:

  • cost;
  • guest acceptance; and
  • people being able to relate to the equipment (which to me seems directly tied to guest acceptance).

However, FSR operators have also indicated another concern: the perception from guests that tech innovations are leading to a loss of personalized service. So, individual operators must decide not just what tech solutions to embrace but how they may impact the guest experience in negative ways.

Guest Expectations

When Restaurants Canada looked into tech in the restaurant space, they didn’t just focus on operators. The restaurant industry advocacy organization also surveyed consumers.

Perhaps unsurprisingly, the 18 to 34 age group appears to be the most eager to embrace new tech in restaurants. However, they’re not that far ahead of the 35 to 54 group. Interestingly, the 55-plus demographic is less tech-resistant in at least one area than one may assume.

Let’s take a look at Restaurant Canada’s survey results, broken down by tech solution.

  • Order and pay via tablet at FSR: 18 to 34 (55%), 35 to 54 (54%), 55+ (41%)
  • Place an order for food that’s prepared by automated method, either robots or other systems: 18 to 34 (27%), 35 to 54 (17%), 55+ (11%)
  • Order food that’s delivered on-premises by an automated system or a robot: 18 to 34 (32%), 35 to 54 (28%), 55+ (18%)
  • Place an order through a ghost or virtual kitchen: 18 to 34 (34%), 35 to 54 (26%), 55+ (13%)
  • Order food that’s then delivered off-premises via robot or self-driving car: 18 to 34 (36%), 35 to 54 (29%), 55+ (19%)

Considerations

Looking at the above data, most guests are already comfortable placing orders and paying through a tablet. Interestingly, the age group people think of as most tech-averse seem to be open to the idea of robots preparing and delivering their orders.

The keys to implementing tech solutions are deceptively simple: initial costs, subscription costs, maintenance fees, ease of use by staff, and ease of use by guests.

With inflation driving costs up, operators are likely most concerned with what it will cost to add to or upgrade their tech stacks. However, there may be a significant reduction in labor costs that justifies the initial costs. Additionally, some solutions can be leased rather than purchased up front.

But the comfort levels of guests must also receive careful consideration. If a solution is going to alienate or drive away a significant portion of guests, it’s likely not worth the time and cost of implementing it.

Your guests likely want more tech in your restaurant, but it has to be the right tech. Solutions need to deliver convenience and speed without failing to deliver on hospitality.

Image: Harrison Broadbent on Unsplash

by David Klemt David Klemt No Comments

The Delicious ‘Mistake’ Causing an Uproar

The Delicious ‘Mistake’ Causing an Uproar

by David Klemt

Overhead shot of hand holding cocktail

Are you hearing your bar team or fellow bartenders debating Negroni specs or catching them rolling their eyes when a guest orders a particular variant?

Well, there’s a good reason. For some reason, the Negroni Sbagliato is getting roasted across social media.


View this post on Instagram


A post shared by Mover & Shaker (@moverandshakerco)

Perhaps it’s for the way it’s apparently being ordered. If the memes are anything to go by—a portion of a sentence I can’t believe I just typed—guests are asking for, “A Negroni Sbagliato, with Prosecco.”

It’s possible that some bartenders are bristling at the “with Prosecco” portion of the order. A Sbagliato, which translates to “mistake,” “bungled,” or “incorrect” from Italian, is a gin-less Negroni. As you may already know or are putting together by now, sparkling wine stands in for the gin.

There’s also another possibility as well: some bartenders can’t stand when a cocktail suddenly explodes in popularity and it’s all they seem to make for weeks on end.

Of course, it could just be that some bartenders don’t feel that the drink is worthy of the hive-mind ordering frenzy. I’ve seen more than one comment on social media posts (again, I can’t believe that’s a relevant method of providing context, but here we are) pointing out that there’s nothing groundbreaking about the Sbagliato.

“All that’s happening is gin being swapped out for sparkling wine,” is a common refrain. It’s a good point.

If the phrase, “No Negroni without Campari,’ holds true, how can a Negroni be a Negroni without gin?

Guest Experience

So, that’s the gist of this “scandal” or “outrage.” Really, it just seems like a bit of fun from the bartender and cocktail communities. Why not vent a little spleen at something innocuous if nobody gets hurt?

Unless, of course, the guest experience is being affected negatively. There was a time not long ago during which a number of “serious” cocktail bar teams belittled guests for any number of reasons, and seemed to get away with it.

Didn’t know something about a particular element of ingredient of a drink? Ridicule. Asked for a drink “beneath” the bar team? Outward contempt.

Not great, as you can imagine, for the guest experience, growing a loyal base, and earning repeat visits.

Personally, I have no issue with front-of-house team members rolling their eyes at someone causing problems. Being rude or creepy to team members and/or guests? Difficult guests get what they deserve if they’re mocked, set straight, and kicked out.

But for ordering what they want to drink, well within reason? Sorry, but I don’t feel like that’s worthy of outward scorn. It’s not the spirit of hospitality, and it’s certainly not good for business.

However, I don’t think anyone has addressed the Negroni Sbagliato (non)issue as well as bartender Giuseppe González via Instagram:


If you don’t want to check out the post, even though you should, here’s a relevant snippet:

So I say this with love: Unless they are ordering a Pumpkin Spice Negroni Sbagliato, let it go and look at this human knowing one thing: it’s actually a really cool drink and I’m not mad at it.

Negroni Sbagliato

Remember, one of the keys to the balance that defines the original Negroni is the 1:1:1 ratio. For this riff on the classic, that ratio remains the same—it’s an ingredient change that makes the difference.

As you’ll see below, the Sbagliato recipe calls for Prosecco rather than gin. While the substitution is simple, the change to the cocktail is significant in terms for flavor and mouthfeel.

I’d also say this an fun fall or winter cocktail, so why not put one on your menu?

  • 1 oz. Campari
  • 1 oz. Sweet vermouth
  • 1 oz. Prosecco
  • Orange slice or peel to garnish

First, prepare an Old Fashioned glass with a large ice cube or sphere. Next, add ice, Campari and sweet vermouth to a mixing glass. Stir until well chilled, then strain into the prepared glass. Now, add the Prosecco to the glass and stir once more. Finally, garnish with orange slice or peel.

If you so choose, you can build this drink entirely with Campari portfolio elements. There’s Campari itself, of course. Then there’s Cinzano Vermouth Rosso and Cinzano Prosecco.

Image: Matheus Frade on Unsplash

by David Klemt David Klemt No Comments

Restaurant Rewards Making Headlines

Restaurant Rewards Making Headlines

by David Klemt

People toasting with Dunkin' Donuts cups

Loyalty programs are making waves and grabbing headlines but not all of the news is good, according to consumers.

Dunkin’, Chipotle, Taco Bell, and Starbucks are among the restaurants whose programs are receiving attention.

Now, there are still those who cling to the idea that all publicity is good. Personally, I’ve found that idiom to be outdated. In fact, I’ve believed that phrase to be false for several years.

Instead, when it comes to publicity, I find this quote from Warren Buffet to be far more accurate: “It takes 20 years to build a reputation and five minutes to ruin it.”

It’s important for operators—for all entrepreneurs, really—to protect their brand’s reputation. At the end of the day, long-term success depends on the reputation one builds. And make no mistake, that reputation is made—or broken—every day, with every interaction.

So, what does all of that have to do with loyalty or rewards programs? It’s simple—such programs aren’t just about revenue. A loyalty program, when executed well, is a branding tool that boosts engagement, recognition, and perception.

When a loyalty or rewards program is executed poorly it doesn’t just mean low membership numbers. A brand’s reputation can take a severe hit if loyal consumers cry foul.

Let’s take a look at some brands that have made headlines the past couple of weeks.

Taco Bell

This rewards program, the Taco Lover’s Pass, is a bit of an anomaly in the loyalty space.

It was first launched in Arizona in September 2021. Depending on the location, the pass cost either $5 or $10. In exchange, people could get a free taco a day for 30 consecutive days, and they could choose from seven tacos.

Back in January of this year, Taco Bell brought back the Taco Lover’s Pass. This time, the program was available throughout the US, and it cost $10. Again, those who snagged a pass through the chain’s app could get a free taco each day for 30 consecutive days.

And just two weeks ago, Taco Bell made the Taco Lover’s Pass available again. This time, people had one day to download the app (if they didn’t have it already) and grab the pass.

Time will tell if Taco Bell will eventually make this wildly popular program permanent. For now, this occasional reward program seems to be serving the chain just fine, and their loyal guests don’t seem to be angry that the Taco Lover’s Pass, thus far, appears fleetingly.

Starbucks

Another interesting approach to loyalty sees Starbucks partnering with Delta Airlines.

As of yesterday, members of Starbucks Rewards and Delta SkyMiles can link the programs together. Members of the former can receive double stars on days on which they’re flying Delta (at participating locations). For the latter, members will earn one mile for every dollar they spend at Starbucks.

Essentially, linking the two accounts ensures that members earn points across both programs for a single purchase. Not a bad move—it should be an effective way to boost loyalty for both companies.

Chipotle

Ah, Chipotle. It’s safe to say this brand has experienced plenty of ups and downs over the past several years.

But credit where credit is due: It seems that the chain manages to come back from each scandal or mistake. And that’s what’s so frustrating—they wouldn’t have to correct missteps if they took care to avoid making them in the first place.

So, why are people upset with Chipotle now? The backlash concerns the restaurant chain’s Chipotle Rewards program.

When someone signs up the program, they can redeem a nice perk immediately: free chips and guacamole. On their birthday, they have access to another perk. In general, the biggest benefit is earning up to 10 points for every dollar spent at Chipotle.

The points a member earns are redeemable in multiple ways: free menu items, a charitable donation, or merchandise. Seems very straightforward, right?

Well, Chipotle updated their rewards program, and it’s not an upgrade. In response to inflation, Chipotle has increased prices, just as innumerable restaurants have also done.

However, the chain updated Chipotle Rewards so that members must spend more to get their free entree reward. Members must now spend an additional $20-plus to get their reward, and they’re understandably unhappy.

It should go without saying but a rewards program is for increasing visits or orders per member. With people declaring they’re “done” with Chipotle, the brand’s update is driving down visits and potentially harming their reputation.
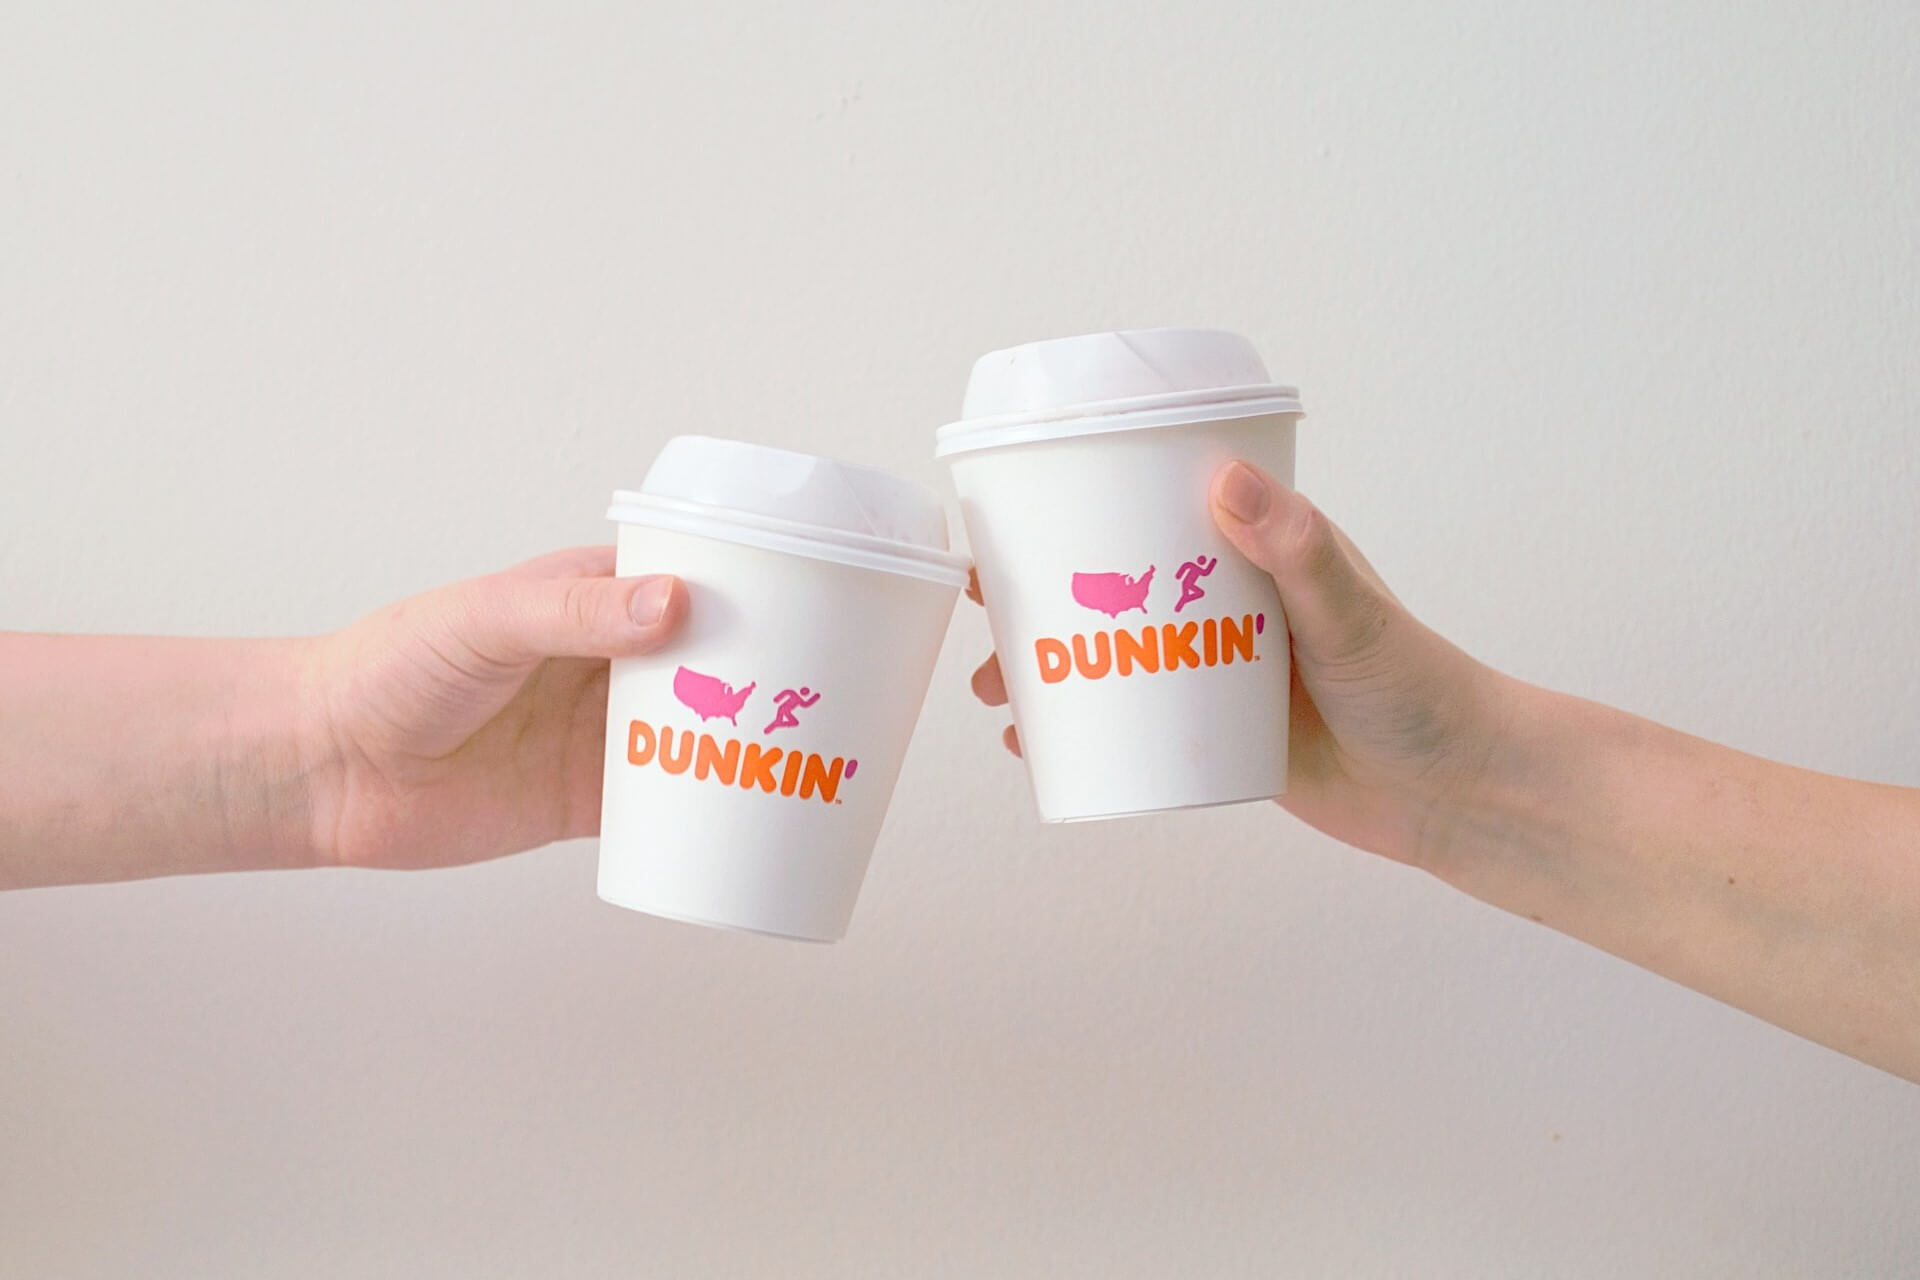
Dunkin’

Things in the reward and reputation space may be worse for Dunkin’ than any other restaurant brand at the moment.

The chain first launched its DD Perks loyalty program eight years ago. Last week, Dunkin’ “reworked” loyalty, launching Dunkin’ Rewards.

Unfortunately, according to several reports, social media, and Reddit, the new program deflated the value of members’ points. From what I’ve seen members must now earn more than double the points they needed to prior to the Dunkin’ Rewards rollout for a gratis beverage.

Oh, and free drinks on a member’s birthday? The new program eliminates that perk. As is often the case on social media, some people are seething.

However, a statement from Scott Murphy, the president of Dunkin’, suggests that people are perhaps misunderstanding or misrepresenting the new program.

“Dunkin’ loyalists told us they wanted the ability to redeem for more than just beverages and we listened,” Murphy said to The Washington Post. “They also wanted to bundle points for larger orders, which we accomplished. And they told us they wanted to be recognized for their loyalty, which they can now achieve through Boosted Status and earn points even faster when they come to Dunkin’ more often.”

In short, Dunkin’ Rewards is built to allow members to redeem points for a wider array of menu items, including meals. For now, however, it seems the knee-jerk reaction is that many members feel the points they earned prior to the new program’s launch are devalued. And they’re furious, with some calling for a boycott.

Obviously, a boycott is the opposite effect one wants from their loyalty program.

Loyalty is a Tightrope Act

If there’s one takeaway here, it’s that rewarding guests for their loyalty isn’t as simple as offering points for dollars.

Perhaps it should be simple, and maybe it was was that simple a while back. But now, operators must be far more cautious when designing a loyalty program.

I’ll continue to dislike offering discounts for most brands. In my opinion, once a guest becomes accustomed to receiving a discount regularly, that discount becomes the standard price. That’s not good for most operators.

It may seem counterintuitive, but I’d rather see loyalty program members receive a free item than discounts. At least they’ve paid full price to earn that perk.

Another issue, however, is making changes to loyalty programs. Operators are facing incredible strain when it comes to costs, and this industry’s margins are already razor thin. It appears that some brands aren’t just increasing costs, they’re also increasing the points it takes to earn loyalty perks.

That may make sense on paper but program members are showing that they don’t take kindly to this type of change.

Slow Down

Look at loyalty programs through the eyes of consumers, not just the eyes of an accountant.

When the costs of living rise and a person’s dollars don’t go as far as they did before, they tend to cut back or eliminate expenditures. Commonly, restaurant visits are among the first things suffer. Loyalty programs can offer guests a way to stretch their dollars—there’s an attractive perk around the bend that allows them to justify continual visits.

If a brand devalues a loyalty program member’s points or requires them to spend more to earn the same benefits, why would they be happy? Why would they remain loyalty? As far as they’re concerned, their incentive to do so no longer exists. The perceived value is no longer there.

Before an operator launches or “revisits” a loyalty program, they need to slow down and analyze it from every angle. These programs are a delicate balancing act, demanding they make sense for both the bottom line and the guests.

If an operator hasn’t yet implemented a loyalty program, perhaps they should hold off until costs become more reasonable. With inflation affecting costs and therefore prices, the wisest move may be to take the time to really dial in the program, prepare the necessary assets, and implement when it won’t impact revenue negatively.

On the flip side, operators considering making significant changes to their loyalty programs need to take the time to strategize before implementation. A misstep, even if it’s a misunderstanding from the member side, can do irreparable harm.

Image: Isabella and Zsa Fischer on Unsplash

by David Klemt David Klemt No Comments

The Numbers on Food Delivery in Canada

The Numbers on Food Delivery in Canada

by David Klemt

Burger in container inside car

For most restaurants, delivery is now a crucial service element rather than a “nice-to-have” option a small percentage of guests expect.

This is true whether your restaurant is in the US or Canada. But who’s placing orders? How are they ordering? And will they continue to order for the foreseeable future?

Well, Restaurants Canada has answers to all those questions and more. So, we let’s take a look at what their 2022 Foodservice Facts report says about delivery.

To download your own copy of this informative report, click here.

Who’s Placing Orders?

In their 2022 Foodservice Facts report, Restaurants Canada looks at three age groups:

  • 18 to 34
  • 35 to 54
  • 55-plus

Perhaps unsurprisingly, the 18- to 34-year-old cohort leads the charge when it comes to ordering delivery. It’s also not surprising that 35 to 54 comes in second, and 55 and older is third.

However, the first two groups are closer than some may assume. Eighty-three percent of the the 18 to 34 cohort placed orders at quick-service or full-service restaurants between December 2021 and May 2022.

That number does drop for the same time period among the 35 to 54 group, but not by a significant amount. Of that cohort, 77 percent ordered delivery. Just over half of the 55-plus group placed delivery orders: 52 percent.

Now, those numbers are down a bit from 2021, which makes sense. Things were much more restrictive in 2021 and people were just getting back to a sense of normalcy at the start of this year.

In 2021, the delivery order percentages were:

  • 18 to 34: 89 percent
  • 35 to 54: 81 percent
  • 55-plus: 67 percent

Looking at these numbers, it appears the 55-plus cohort is more comfortable dining out in person. Conversely, the 18 to 34 age group is clearly comfortable making delivery a part of their everyday lives.

How do People Want to Order?

Believe it or not, your website still matters. I’ve been saying this for years but the pervasiveness of delivery and takeout ordering is really driving this point home.

The fact is, a notable percentage of your guests want to support your restaurant and staff directly. Over the past couple of years, consumers have become well aware that third-party delivery services are incredibly costly for operators.

Consumers are also aware of third-party delivery debacles, such as the abysmal Grubhub “Free Lunch” mess from May of this year.

So, direct delivery is something that operators need to at least consider. Implementation is often less difficult than most business owners believe. And many platforms, SevenRooms, for example, make implementing direct delivery simple and affordable.

Interestingly, Restaurants Canada data supports the need for direct delivery. Back in May, the industry advocacy organization asked survey respondents how they prefer to place delivery orders from restaurants.

Preferences for QSR customers:

  • No preference: 10 percent
  • Over the phone: 19 percent
  • Third party: 35 percent
  • Restaurant website or app: 36 percent

Full-service customer preferences:

  • No preference: 8 percent
  • Over the phone: 28 percent
  • Third party: 29 percent
  • Restaurant website or app: 35 percent

Honestly, I find it surprising anyone calls a QSR to place an order. However, I suppose that makes sense for an office or catering.

At any rate, make sure your website is up-to-date, you offer direct or “last-mile” delivery, and make it easy to navigate your menu and the ordering process.

Is Ordering Here to Stay?

Now, we all know why restaurant delivery has been supercharged the past two years. However, consumer trend data show that delivery was on the rise before the Covid-19 pandemic.

But now that people are eager to return to normal and the industry is on its way to returning to pre-pandemic levels, is delivery really here to stay?

According to another question asked of survey respondents by Restaurants Canada, more than half of QSR and full-service restaurant customers plan to stick with delivery.

For their 2022 Foodservice Facts report, Restaurants Canada asked back in May how often consumers planned to place delivery orders in the next six months.

Order frequency for QSR customers:

  • Never placed a delivery order and don’t plan to now: 29 percent
  • Order less often: 20 percent
  • Will order with the same frequency: 45 percent
  • Will order more often: 7 percent

Frequency of orders for full-service customers:

  • Never placed a delivery order: 24 percent
  • Order less often: 23 percent
  • Will order with the same frequency: 44 percent
  • Will order more often: 9 percent

Here to Stay?

Of course, there are multiple factors feeding the numbers above. Some people simply don’t like ordering and waiting for delivery. For these consumers, the practice doesn’t just seem convenient.

There’s also the consumer demand to return to in-person dining, socializing with family and friends. And, of course, meeting new people while dining out.

We must also consider inflation and rising costs. Often, restaurant spending is among the first to be reduced when consumers need to be more frugal. Rising menu costs are sure to curtail some delivery spending.

That said, it’s clear delivery is here to stay and must be considered a crucial element for most restaurant operations. QSR and full-service operators need to bear in mind is placing orders; how often they’re placing orders; and get them in the habit of placing orders directly.

Image: Oliur on Unsplash

by David Klemt David Klemt No Comments

Possess this Scary Spirit for Halloween

Possess this Scary Spirit for Halloween

by David Klemt

Harridan Vodka Paranormal Reserve hero

If you truly want to imbue your cocktails and the guest experience with the otherworldly this Halloween, you need this spirit.

In fact, this bottle likely contains the most “spirit” forward spirit one can possess. It’s also one of the rarest. Oh, and it took a rest for 30 days inside the Occult Museum.

On October 13, Harridan Vodka will launch their Paranormal Reserve officially. And if you’re after a true small-batch vodka, you’ll want to keep an eye the Paranormal Reserve countdown timer.

This is your opportunity to create and host a frighteningly unique Halloween LTO promotion.

Conjuring the Halloween Spirit

Does the Occult Museum sound familiar to you? If so, you’re likely a horror film fan or into the supernatural.

For those who don’t know, the Occult Museum was started in 1952 by Ed and Lorraine Warren. The two paranormal investigators collected a vast array of artifacts that they claimed came into contact with evil.

One of these objects is Annabelle, a cursed Raggedy Ann doll. According to lore, the doll is so dangerous it’s kept inside its own glass case. A sign attached to the case reads, “Warning, Positively Do Not Open.”

So, what could possibly be frightening about a Raggedy Ann doll? Well, this one is said to have an interesting “attachment.” That is, a demon in search of a human host that has attached itself to the doll.

To keep the demon from achieving its goal—which it reportedly began pursuing in 1970—Annabelle’s case has been blessed. The case has inscriptions of the Lord’s Prayer and Saint Michael’s Prayer. Also, it’s said that Ed Warren would recite a binding prayer over the case from time to time to ensure the demon couldn’t escape.

Supposedly, Annabelle nearly killed a priest who mocked it when he visited the Occult Museum to scrutinize the Warren’s claims of its demonic possession.

This story and more are told in The Conjuring movie series. In particular, Annabelle, Annabelle: Creation, and Annabelle Comes Home. Given that it’s October, it’s the perfect time to watch the first installment and doll-focused movies of The Conjuring universe.

In fact, this would be the month to design a promotion around The Conjuring watch parties with themed LTO cocktails.

A Frightful Rest

Okay, so I can already hear some of you asking what this has to do with Harridan Vodka. Well, calm down—I’m getting to it.

The Warren Occult Museum, located in Monroe, Connecticut, closed to the public in 2019. In other words, if you didn’t get to visit prior to its closure, you’ll most likely never have the chance to see Annabelle or the other occult artifacts contained within.

But you can purchase a bottle of 44-percent ABV vodka that rested for 30 days inside the Occult Museum: Harridan Vodka Paranormal Reserve.

Just 666 bottles are available, and 665 took their 30-day slumber right next to Annabelle. These bottles will retail for $199 on Thursday, October 13.


View this post on Instagram


A post shared by Harridan Vodka (@harridanvodka)

Obviously, that leaves one bottle we need to address. Bottle number 666 was rested inside Annabelle’s case. And while the other 665 bottles are housed inside black Ouija-themed boxes, number 666 is contained within a glass case similar to Annabelle’s.

Of course, this unique bottle comes with an appropriately otherworldly price tag: $13,000. And, hey, the person who makes this bank-balance-slashing purchase might just be in possession of the world’s only vodka infused with evil.

If you’re one of the few who manage to get their hands on these Occult Museum-rested Harridan Vodka bottles, it’s fair to say you can name your price for the opportunity for guests to buy an ounce.

Happy Halloween, ya filthy animals!

Images: Harridan Vodka

by David Klemt David Klemt No Comments

7 Days Until Old Fashioned Week!

7 Days Until Elijah Craig Old Fashioned Week!

by David Klemt

Old Fashioned cocktail on table

In just seven days operators, their front-of-house teams and guests will have the opportunity to participate in Elijah Craig Old Fashioned Week.

Those who choose to join in on the fun will help generate funds for crucial cause. Further, participation means joining forces with some revered heavy hitters in the industry.

For example, Broken Shaker’s Chicago and Miami locations are taking part, as is Cure in New Orleans. Birdie G’s in Los Angeles, the Denver outpost of Death & Co., and Houston’s Julep are also participating. And then there’s LA Jackson from Nashville, the legendary Leyenda in Brooklyn, DC’s Silver Lyan, and Philly’s R&D all joining the cause.

A Great Cause

As stated, this is more than a cocktail promotion. Elijah Craig Old Fashioned Week supports an important cause and fantastic organization.

The cause is providing F&B professionals who are struggling with financial assistance, and the aide comes from the Southern Smoke Foundation.

Since 2015, Southern Smoke has been dedicated to raising funds to help individuals in the F&B space. The non-profit organization strives to help our industry peers in need persevere through crises.

From raising funds for the MS Society, establishing the Emergency Relief Fund, and providing free mental healthcare, Southern Smoke consistently proves themselves a trustworthy industry partner. By 2021, Southern Smoke had donated more than $5 million in financial aid to industry workers affected by Covid-19.

Take Part

Elijah Craig, the storied small-batch bourbon and rye producer in the Heaven Hill Distillery portfolio, makes participating simple and fun.

Unsurprisingly, we at KRG Hospitality love an activation and promotion that’s easy to execute and fun for everyone in the building. This year, Elijah Craig Old Fashioned Week takes place from October 14 through October 23.

To help raise money for Southern Smoke’s crisis management mission, encourage your bar team and guests to post pictures of their Old Fashioneds to social media. All one has to do is include tag @ElijahCraig and the hashtag #OldFashioned Week. Elijah Craig will take it from there, donating $5 for every post up to $100,000.

I’m confident that over the course of ten days we can all come together and flood social media with 20,000 images of delicious, well-crafted Old Fashioneds.

To learn more about last year’s Old Fashioned week, listen to Bar Hacks episode 52. Our very special guest on this episode is Lynn House, the 2022 Best US Brand Ambassador Spirited Award winner.

Get Creative

Now, I’d normally include the particular drink recipe here but I think—I believe—we all know how to make an Old Fashioned by now. So, I’m going to encourage all participating operators and their bar teams to create a small, signature Old Fashioned LTO menu or Elijah Craig Old Fashioned Week.

Also, to get those creative juices flowing, here’s the recipe for the Elijah Craig Rosemary Old Fashioned:

  • Craft rosemary cinnamon syrup by combining 1 cup of water with 2 cinnamon sticks, 2 rosemary sprigs, and 1 medium navel orange in a saucepan over medium heat. Bring to a simmer, add one cup of Demerara sugar and stir until it dissolves. Strain into a clean, sanitized bottle.
  • Combine 2.5 oz. of Elijah Craig Small Batch Bourbon, a half-ounce of housemade rosemary cinnamon syrup, and three dashes of orange bitters in a mixing glass with ice.
  • Stir and strain into rocks glass over a large ice cube, then garnish with a Maraschino cherry on a rosemary-sprig skewer. If you so choose, light the sprig on fire for a moment to generate some rosemary smoke.

Image: CHUTTERSNAP on Unsplash

by David Klemt David Klemt No Comments

5 Books to Read this Month: October 2022

5 Books to Read this Month: October 2022

by David Klemt

Flipping through an open book

This month’s engaging and informative book selections will help you develop next-level leadership skills and dial in your F&B menus.

To review September’s book recommendations, click here.

Let’s jump in!

Down and Out in Paradise: The Life of Anthony Bourdain

First things first: This biography by author Charles Leerhsen about chef and modern philosopher Anthony Bourdain isn’t authorized. However, this book purports to offer a deep dive into the late, revered chef’s life, from childhood to his final days.

Just be forewarned that this book is already and for good reason considered controversial.

Down and Out in Paradise will be available on October 11. Click here to pre-order this book today.

The Ethical Leader: Why Doing the Right Thing Can Be the Key to Competitive Advantage

Written by Morgen Witzel, The Ethical Leader addressed ethical behavior in business. Far too often, for far too many business owners and leadership team members, behaving ethically isn’t a non-negotiable. Rather, doing the right thing in business is “nice,” not “necessary.”

For this leadership book, Witzel explains why gaining and maintaining the trust and respect of team members and customers is crucial to the success of any business. “Trust engenders loyalty and good reputation, which in turn builds brand value… Ethical behavior is the key to trust-building, but it needs to go deeper than something managers do out of a sense of moral duty.”

Pour Me Another: 250 Ways to Find Your Favorite Drink

It may not happen every shift but bar team members and servers do encounter the restless guest from time to time. Their go-to drink, for whatever reason, just isn’t cutting it during a particular visit. Of course, this is an excellent time to improve their visit and the guest experience. And it’s the perfect time to introduce a guest to their new favorite drink.

JM Hirsch’s Pour Me Another helps people find that new favorite. Bar professionals and servers will find it useful for guiding guests through a cocktail discovery process. Click here to pre-order this book for its October 4 release.

Twist: Your Guide to Creating Inspired Craft Cocktails

The classics are a litmus test for any bar professional. It’s all well and good to invent and craft signature drinks, but if you can’t nail the classics there’s something wrong. Author Jordan Hughes, over the course of 75 recipes, combines the classics with creation in Twist.

This new book, set for release on December 13, teaches the classics. However, Hughes also helps the reader develop the skills to riff on these timeless recipes to put their stamp on the industry. Pre-order today!

Boards and Spreads: Shareable, Simple Arrangements for Every Meal

So, you’re familiar with how much people on Instagram love a good cheese and charcuterie board. In fact, you have some artisanal, eye-catching boards just waiting to be photographed and posted to social media by your guests. But do they really just sit around until someone orders either cheese, charcuterie, or a combination thereof?

It doesn’t have to be that way. Yasmin Fahr’s book Boards and Spreads provides plenty of other uses for your fancy Instagrammable boards. Oh, and there just happen to be several dip and spread recipes to refresh your menu.

Image: Mikołaj on Unsplash

by krghospitality krghospitality No Comments

These are the World’s 50 Best Bars in 2022

These are the World’s 50 Best Bars in 2022

by David Klemt

Map of France and Spain

The long wait is over and we finally know which venues across the world are numbers one through 50 on the 2022 World’s 50 Best Bars list.

Congratulations to the World’s 50 Best Bars, class of 2022!

Regardless of people’s opinions of industry awards, these bars deserve recognition. Moreover, they’re successful examples from which other operators can learn. Iron, as they say, sharpens iron.

To review the World’s Best Bars, numbers 51 through 100, click here. As you’ll see, Singapore dominates that particular list.

If you want to learn more about the World’s 50 Best Bars, listen to episode 82 of the Bar Hacks podcast.

The 50 Best

As you’ll see when you scroll down, history was made today. For the first time since the inception of the World’s 50 Best Bars, neither a bar from London nor New York takes the number one spot.

However, New York did just fine this year. The city claims six of eight American bars on this year’s top 50 list. In fact, two bars in New York are among the top ten.

Bars in Chicago and Miami claim two spots as well. Las Vegas, sadly, doesn’t find itself with a bar in the top 50 or the expanded 51 to 100 list.

Unfortunately, the same holds true for the entirety of Canada.

However, Mexico City crushes it for North America with not only four winners but one bar representing the Best Bar in North America and taking the Rémy Martin Legend of the List award.

Athens, Dubai, Buenos Aires, and Barcelona each claim three spots, with the latter city’s winners all in the top ten. London boasts five bars on the top 50 list.

And as I predicted, two bars in Singapore earned placement this year. The Southeast Asian city-state didn’t crack this year’s top ten. However, when combined with bars 51 through 100, ten percent of the bars are in Singapore.

Individual Awards

Of course, the World’s 50 Best Bars does more than simply judge and rank bars.

Now in his fourteenth year at the helm of the Connaught Bar in London, England, Agostino Perrone scores the Roku Industry Icon Award. Jean Trinh of Alquímico in Cartagena, Colombia, is the 2022 Altos Bartender’s Bartender.

Röda Huset, number 78 on the World’s 50 Best Bars, numbers 51 to 100, is the Campari One to Watch. This particular award means this bar has been judged as the one most likely to find itself ranked somewhere among the top fifty. Further, Hanky Panky in Mexico City takes the Michter’s Art of Hospitality Award this year.

Regional and other individual awards are listed next to the bars below.

Congratulations to the bars and their dedicated teams!

The World’s 50 Best Bars 2022: 50 to 1

  1. Bulgari Bar (Dubai)
  2. Lucy’s Flower Shop (Stockholm)
  3. Bar Benfiddich (Tokyo)
  4. Employees Only (New York)
  5. L’Antiquario (Naples)
  6. Galaxy Bar (Dubai)
  7. Carnaval (Lima)
  8. Himkok (Oslo)
  9. CoChinChina (Buenos Aires)
  10. Cantina OK! (Sydney)
  11. Red Frog (Lisbon)
  12. Locale Firenze (Florence)
  13. Zuma (Dubai)(The Best Bar in the Middle East and Africa sponsored by Paragon Cordials)
  14. 🔶🟥🔵 A Bar with Shapes for a Name (London)
  15. Dante (New York)
  16. 1930 (Milan)
  17. Overstory (New York)
  18. Manhattan (Singapore)
  19. Baltra Bar (Mexico City)
  20. Line (Athens)
  21. Swift (London)
  22. Maybe Sammy (Sydney)(The Best Bar in Australia sponsored by Torres Brandy)
  23. Argo (Hong Kong)
  24. Tres Monos (Buenos Aires)
  25. Sidecar (New Delhi)
  26. Kumiko (Chicago)
  27. Tropic City (Bangkok)
  28. Satan’s Whiskers (London)
  29. Attaboy (New York)
  30. Café La Trova (Miami)
  31. Baba au Rum (Athens)
  32. The Clumsies (Athens)
  33. Florería Atlántico (Buenos Aires)
  34. Coa (Hong Kong)
  35. Drink Kong (Rome)
  36. Salmon Guru (Madrid)
  37. BKK Social Club (Bangkok)(London Essence Best New Opening Award)
  38. Hanky Panky (Mexico City)(Michter’s Art of Hospitality Award)
  39. Jigger & Pony (Singapore)(The Best Bar in Asia sponsored by Naked Pony)
  40. Handshake Speakeasy (Mexico City)
  41. Alquímico (Cartagena)(The Best Bar in South America sponsored by Tia Maria)
  42. Katana Kitten (New York)
  43. Connaught Bar (London)
  44. Two Schmucks (Barcelona)
  45. Double Chicken Please (New York)(Disaronno Highest New Entry Award)
  46. Little Red Door (Paris)(Ketel One Sustainable Bar Award)
  47. Licorería Limantour (Mexico City)(The Best Bar in North America sponsored by Rémy Martin)(Rémy Martin Legend of the List)
  48. Sips (Barcelona)(Nikka Highest Climber sponsored by Nikka Whisky)
  49. Tayēr + Elementary (London)
  50. Paradiso (Barcelona)(The Best Bar in Europe sponsored by Perrier)

Image: Ian on Unsplash

Top