#Datassential

by David Klemt David Klemt No Comments

Datassential: The Flavors of 2023

Datassential: The Flavors and Menu Items of 2023

by David Klemt

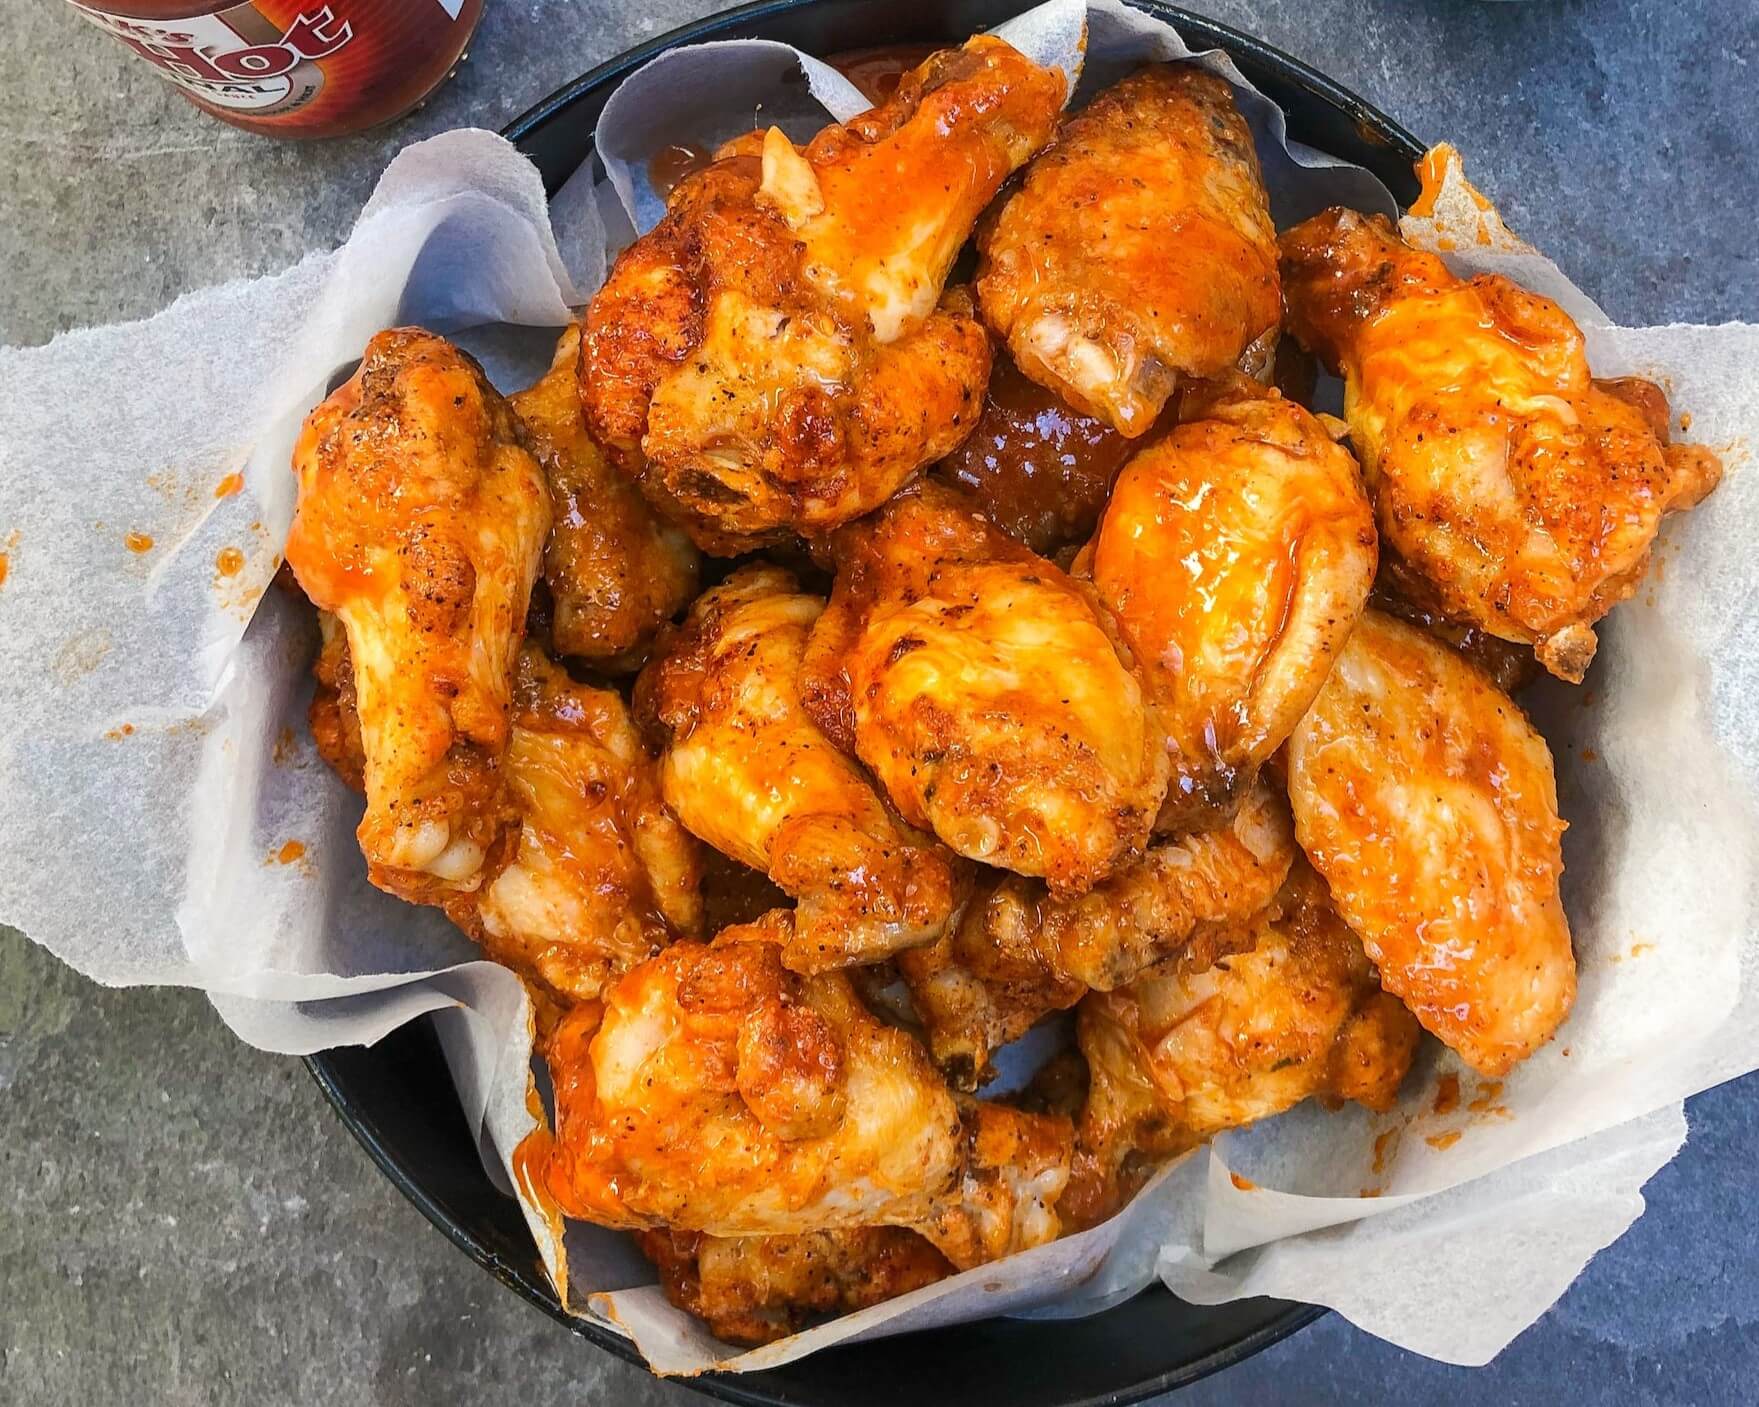
Basket of hot chicken wings

Food and beverage market research agency Datassential has some data-driven thoughts on the flavors and menu items that will define 2023.

Featured in their latest Foodbytes report are 20 items for operators to consider this year. There are ten food items, drinks, and ingredients Datassential predicts will be on basically every menu.

And there are another ten food items, drinks, and ingredients the agency feels could suddenly hit in 2023.

For you own copy of Datassential’s 2023 Food Trends, click here.

Prolific Performers

As Datassential refers to them in their report, these are the items “that will be everywhere” this year.

Food

  • Birria. This one makes sense as birria only appears to be capable of continually growing in popularity.
  • Mushroom. In Datassential’s opinion, we should expect more menus to feature mushroom snacks. Also, expect to see (or add yourself) lesser-known, rare, and exotic mushrooms on menus.
  • Salsa macha. Over the past four years, according to Datassential, salsa macha as grown a staggering 339 percent on menus.

Drink

  • London Fog. A compelling earl grey tea latte.
  • Mangonada. Salty, tart, fruity, and bold, the Mangonada is a flavorful frozen drink.
  • Ranch Water. Simple, timeless, and refreshing. In 2022, per Datassential, Ranch Water was the fastest-growing cocktail.
  • Soju. According to Datassential, soju is the third fastest-growing spirit on restaurant and bar menus.

Ingredient

  • Spicy maple. As the image atop this article suggests, expect spicy maple to replace or at least give hot honey a run for its money.
  • Ube. A striking purple yam from the Philippines.
  • Yuzu. Datassential predicts this citrus fruit will start showing up on many chain restaurant menus.

Promising Performers

In Datassential’s data-driven opinion, the following items need to be on every operator’s radar.

These are the items that have the potential to “hit it big” in 2023.

Food

  • Pickled strawberries. Interestingly, this matches up with Technomic’s trend prediction for the US, Canadaworldwide, really.
  • Savory granola. Not only on its own but as an element of savory, healthy bowl.
  • Sisig. A Filipino delicacy with pork belly, pig’s face, and chicken liver as key elements.

Drink

  • White coffee. As Datassential states, “there’s always room for coffee innovation on menus.”

Ingredient

  • Black tahini. The appearance of black tahini is quite striking, making for dramatic presentations. And as we know, striking presentations are perfect for social media marketing and engagement.
  • Cannabis. The legalization of recreational cannabis use in almost half of US states is leading to innovation in this space. And as more markets legalize public consumption in the form of F&B items on-premise, restaurants and bars will add cannabis-infused items to their menus.
  • Cherry blossom, or sakura. It seems that cherry blossoms are poised to take off in the US market.
  • Chestnut flower. Per Datassential, this ingredient is gaining popularity for use in winter baked goods.
  • MSG. For decades, restaurants proudly proclaimed “no MSG” or “MSG-free” on menus due to misconceptions. Now that consumers are better educated about ingredients, restaurants are proudly proclaiming their use of MSG.
  • Verjus. An ancient juice made by crushing unripened wine grapes. It can be an ingredient in a sauce, as a condiment, or to deglaze a pan.

There you have it—20 items to consider adding in your next menu update, featuring in your next LTO, or at least keeping an eye on in 2023.

Image: Scott Eckersley on Unsplash

by David Klemt David Klemt No Comments

Traffic Up but Margins Thinner

Traffic Up but Margins Thinner

by David Klemt

Chef checking tickets

The One Table 2022 report from Datassential focuses on the state of the operator and what the industry can expect moving forward.

This informative report shares survey results from 801 operators across America. While some of the findings are positive, it’s clear many operators are enduring significant challenges.

For some, traffic and sales are up. However, that’s not the situation others find themselves in.

To download and review the Datassential One Table 2022, please click here.

The Respondents

For this report, Datassential shares the survey answers from 801 respondents.

Most survey respondents are independent operators. In fact, they account for 71 percent of the participants. Making up the rest of the field are chain operators (15 percent) and franchise operators (14 percent).

As far as segment types, the majority of survey participants operate in the fast-casual space (18 percent). Unsurprisingly, fine dining is the smallest group of respondents at six percent. Thirteen percent operate midscale restaurants, and 12 percent are at the helm of casual-dining concepts. Somewhat surprisingly, just ten percent of participants operate QSRs.

Interestingly, the service format is fairly even among survey participants. Fifty-three percent of operators are full-service and 47 percent are limited-service.

Similarly, survey respondents represent the country’s regions pretty evenly:

  • South: 30 percent
  • Midwest: 29 percent
  • Northeast: 21 percent
  • West: 20 percent

In terms of market type, most respondents operate in the suburbs (49 percent). Following somewhat closely are urban-market operators, at 31 percent. Just 20 percent of survey participants operate in rural markets.

Traffic, Sales and Margins

At first glance, Datassential’s survey reveals positive news.

Now, I’m sure people find the terms “pandemic, “pre-pandemic,” and “post-pandemic” exhausting at this point. However, there’s no denying we continue to feel the aftershocks sent through the industry by the pandemic.

So, how do things look now in comparison to pre-pandemic traffic and sales levels?

First, the positives. Nearly half of survey respondents—47 percent—say their traffic is up in comparison to where it was pre-pandemic. Add to that the 14 percent who say their traffic is the same and 61 percent of operators appear to be in good shape.

In terms of sales, 51 percent of survey participants have good news. That news is that their sales are higher in comparison to pre-pandemic levels. Again, add the 14 percent who don’t see any change. So, that’s 65 percent of operators who appear to be performing well.

But with the good there’s bad. Unfortunately, 39 percent of respondents report lower traffic than pre-pandemic levels. And sales are lower than they were before the pandemic for 35 percent of survey participants.

Operator margins are lower for all respondents. Generally speaking, the profit margin for operators before the pandemic sat at 21 percent. Now, the average is 13 percent. QSRs and fast-casual restaurants are a bit higher among survey respondents: 17 percent and 15 percent, respectively.

On paper things do look up for many operators. However, the industry is still suffering, with a third struggling to rise to even pre-pandemic levels of traffic and sales.

Image: Daniel Bradley on Unsplash

by David Klemt David Klemt No Comments

Datassential’s State of the Operator 2022

Datassential’s State of the Operator 2022

by David Klemt

Guests sitting at the bar inside a restaurant

The latest addition to the Datassential FoodBytes research series shares insights into the top three challenges most—if not all—operators are facing.

Now, some of what the report reveals paints a bleak picture. Inflation, the labor shortage, and supply chain issues persist even past the midway point of 2022.

However, operators are a tenacious and innovative group of business owners. Of course, that tenacity seems to manifest in people thinking this industry can weather any storm. That perception can come at operators’ detriment. Exhibit A: The Inflation Reduction Act of 2022 not including replenishing of the RRF. But, I digress.

“The State of the Operator & the Road Ahead,” which you can download here, is helpful and informative. As you may be aware, we’re fans of Datassential and their FoodBytes reports. In fact, you can find our synopses of FoodBytes reports here and here.

Below are some key points that operators should be aware for consideration. I strongly urge you to download this free report today.

Operator Outlook

First, let’s take a look at traffic. As Datassential points out, some hospitality business segments are performing better than others currently.

In large part, this is due to two factors: People working from home, and people returning to travel. So, operators who rely heavily on commuters and in-person workers are struggling. On the other hand, operators inside or around hotels are, per Datassential, performing the strongest at the moment.

Interestingly, though, nearly half of operators (47 percent) are seeing an increase in traffic in comparison to pre-Covid levels. Fourteen percent of operators are reporting no change in traffic. Unfortunately, traffic is lower for 39 percent of operators.

Next, sales. In comparison to pre-Covid times, more than half (51 percent) of operators report an increase. Again, 14 percent of operators are experiencing no change. But 35 percent of operators are experiencing a decrease in sales.

Finally, profit margins. Half of operators may be seeing increases in traffic in sales, but profit margins are taking a hit. On average, the industry’s profit margin is now hovering at 13 percent. That’s an eight-percent drop in comparison to pre-Covid levels.

Segment Performance

The findings regarding profit margins are likely to be the most alarming to operators. Historically, our industry has operated on razor-thin margins for decades. Dropping from an average of 21 percent to 13 is concerning.

However, context is important. The segments seeing the lowest profit margins in 2022 are: Business & Industry (B&I), Healthcare, and Colleges & Universities (C&U). Again, remote work (and learning) are largely responsible for those particular segments watching their profit margins tumble.

The strongest performers are: Quick-Service Restaurants (QSR) at 17 percent; Fast Casual at 15 percent); and Midscale, Casual Dining, and Fine Dining, each at 13 percent. Lodging is just below the current average at 12 percent.

Operator Adaptation

Inflation, rising food costs, supply chain issues, labor shortages… Operators are finding ways to cope, and in some situation, thrive.

Unsurprisingly, the vast majority of operators are increasing menu prices. In the past 12 months, 77 percent of operators have raised menu prices at least once.

These increases range from one percent a staggering 30 percent. However, the majority have kept these increases to one to ten percent. Most (31 percent) have implemented increases of no more than five percent. Just one percent of operators boosted prices between 25 to 30 percent.

Of course, raising prices isn’t the only strategy operators have at their disposal. Forty percent of operators are streamlining their menu, reducing the sizes of their menus. However, it’s wise for operators to review their menus at least every three months to eliminate poor performers.

Other strategies include focusing on value for guests (27 percent); utilizing LTOs and launching new menu items (26 percent); eliminating a specific daypart or portion of the menu (25 percent); and making portion sizes small, or “shrinkflation” (18 percent).

There’s much more revealed in Datassential’s latest FoodBytes report. Download your copy today.

Image: Luca Bravo on Unsplash

by David Klemt David Klemt No Comments

Datassential Identifies Top Design Trends

Datassential Identifies Top Design Trends

by David Klemt

Maximalist interior bar or restaurant design

For their latest FoodBytes research topic, Datassential tackles some of the top restaurant design trends.

Click here to download Datassential’s “Foodbytes: Restaurant Design Trends” report. If you haven’t already, you’ll need to sign up for FoodBytes reports.

As the title states, this Datassential resource addresses the state of restaurant design. Now, we recommend reading the report for yourself but below you’ll find the points that really stand out to us.

If you’re among the 22 percent of operators that Datassential says are either considering a dining room redesign or have completed one, this report is particularly relevant to you.

Back-0f-house Design

Unsurprisingly, most people envision the interior dining area when considering restaurant design. However, as Lauren Charbonneau of Reitano Design Group says in Datassential’s latest FoodBytes, “Restaurants are living spaces that need to be agile.”

That means considering the entire space, not just the front of house. There’s also this stat from Datassential: 64 percent of operators think shrinking their footprint would be detrimental. If that’s the case, making the BoH smaller rather than the front may be the way forward.

So, let’s take a look at what Charbonneau identifies as BoH design trends to consider.

Clearly, it’s crucial operators consider their back-of-house teams. Providing a better workplace experience and improving efficiency can be done through design. Per Charbonneau, operators can use clever design and equipment choices to reduce steps, movement, labor, footprint, and costs.

Additionally, sustainability is not only crucial to responsible operation, being sustainable can reduce costs. Selecting Energy Star, Water Sense, and multi-functional equipment can make tasks easier for BoH teams, make a business more sustainable, and, again, drive down costs.

Maximalist Design

Finally, it seems, the minimalist design trend is losing its stranglehold on restaurant design. Of course, if that approach and design language works for a particular concept, it works.

However, maximalism is growing in popularity. For this type of design, think lots of color and bold patterns. Then, think about using multiple patterns and textures, including on the floors.

So, wallpaper, artwork, plush seating, loud tiles… Per Datassential, maximalism appeals to younger guests. In part, this is because these spaces can offer so many Instagrammable moments.

Monochrome Design

Okay, before we begin, “monochrome” doesn’t only mean a black-and-white palette. While that can work very well depending on the concept, monochrome also means using different tones of a single color.

Of course, there are multiple ways to approach this design trend. For example, if one does want to select a black-and-white scheme, Matte Black Coffee in Los Angeles is compelling.

Not only is the design monochrome, guests feel as though they’re inside a two-dimensional image. Per Datassential, this type of design is growing in popularity across the US specifically.

In terms of colorful monochrome, a great example is NYC’s Pietro Nolita. Not only have they chosen pink for their palette, it’s a core element of their branding: Pink AF.

Yet another way to approach this trend is for operators to use varying tones of particular colors to delineate different spaces. So, the dining room may be tones of pink while the bar is green and a private dining room is blue.

Nostalgic Design

As we’re all well aware, the pandemic derailed people’s plans. In particular, people hit the pause or cancel button on travel and vacations. Now, people appear to restarting their travel plans and getting back out there.

However, we’re also dealing with inflation. So, many people are holding off on spending money on travel. This is where restaurant design comes into play.

According to Datassential, “nostalgic escape” is a trend to watch moving forward. While very specific, this trend combines a dive into the past and capturing vacation vibes.

Per their FoodBytes report, Datassential identifies the following elements as key to this design approach:

  • Soft shades of colors. In particular, pink.
  • Tropical designs.
  • Fifties, Eighties, and Nineties design elements.

One concept that leverages this trend and did so before the pandemic is the Hampton Social. Currently, there are eight locations and two more are on the way.

Of course, it’s imperative that operators commit only to design language that’s authentic to their concepts. Pursuing a trend simply to pursue it is a clear path to disaster. That said, these design trends have massive appeal and can work for many operators and their brands.

Image: Davide Castaldo on Unsplash

by David Klemt David Klemt No Comments

Hard Numbers for the Holidays

Hard Numbers for the Holidays

by David Klemt

Classic vintage Dodge pickup truck with winter wreath on grille

From comfort foods and specific seasonal flavors to LTOs and traditional tastes, data reveal what consumers want this holiday season.

As we reported last week, there’s reason to be optimistic about this year’s holiday season.

According to Datassential, consumers are eager to visit sit-down restaurants this month. One of their key findings was that the average group size will likely be smaller than normal.

Specifically, most groups will probably consist of seven to 12 guests. Crucially, Datassential sees potential from people eager to gather with family and friends for the holidays. Even better, of all options, sit-down restaurants are the top choice for gatherings outside of homes.

But drilling down deeper, what do guests want from restaurants during the holidays?

The Numbers

So, when it comes to the holidays, Datassential wants operators to remember that December includes more than Christmas and New Year’s Eve.

To that end, the first numbers I’m presenting are dates:

  • Hanukkah: November 28 to December 6 (ends this evening!)
  • Soyal: December 21
  • Christmas: December 25
  • Boxing Day: December 26
  • Kwanzaa: December 26 to January 1
  • New Year’s Eve: December 31
  • New Year’s Day: January 1

Those dates reveal something compelling: Plenty of opportunity to get creative and ramp up limited-time offers. Per Datassential, nearly half (44 percent) of consumers look forward to seasonal, holiday-themed LTOs.

In fact, roughly two out of five consumers find seasonality to be an important factor in their decisions to order LTOS and new menu items.

However, it’s important to know your audience and brand when coming up with special menu items. That’s because according to Datassential, 62 percent of consumers, at least for 2021, want classics and comfort food this season.

So, Datassential cautions operators against veering “too far” from traditional seasonal menu items and comfort foods. That said, you should know how far outside the box you can push your guests.

The Flavors

We’re not technically out of the fall just yet. The start of winter is December 21.

It can be smart to begin transitioning from fall to winter flavors over the next week or so. However, it may not be wise to toss fall flavors out entirely.

Datassential identifies the following as key fall flavors:

  • Apple cranberry
  • Butternut squash
  • Chestnut
  • Duck
  • Pumpkin pie
  • Stuffing

And these are important winter flavors, per Datassential:

  • Chocolate almond
  • Candy cane
  • Lobster cream
  • Lox
  • Red velvet
  • Toasted coconut

Those are by no means the only fall and winter flavors that will appeal to your guests. However, Datassential identifies them as top fall and winter flavors.

Something to think about when finalizing your winter LTO food and beverage menus.

Another thing to think about? Updating your listings to include holiday hours, LTOs, and other menu changes.

Image: Ryan Wallace on Unsplash

by David Klemt David Klemt No Comments

Global Cuisine Performance

Global Cuisine Performance

by David Klemt

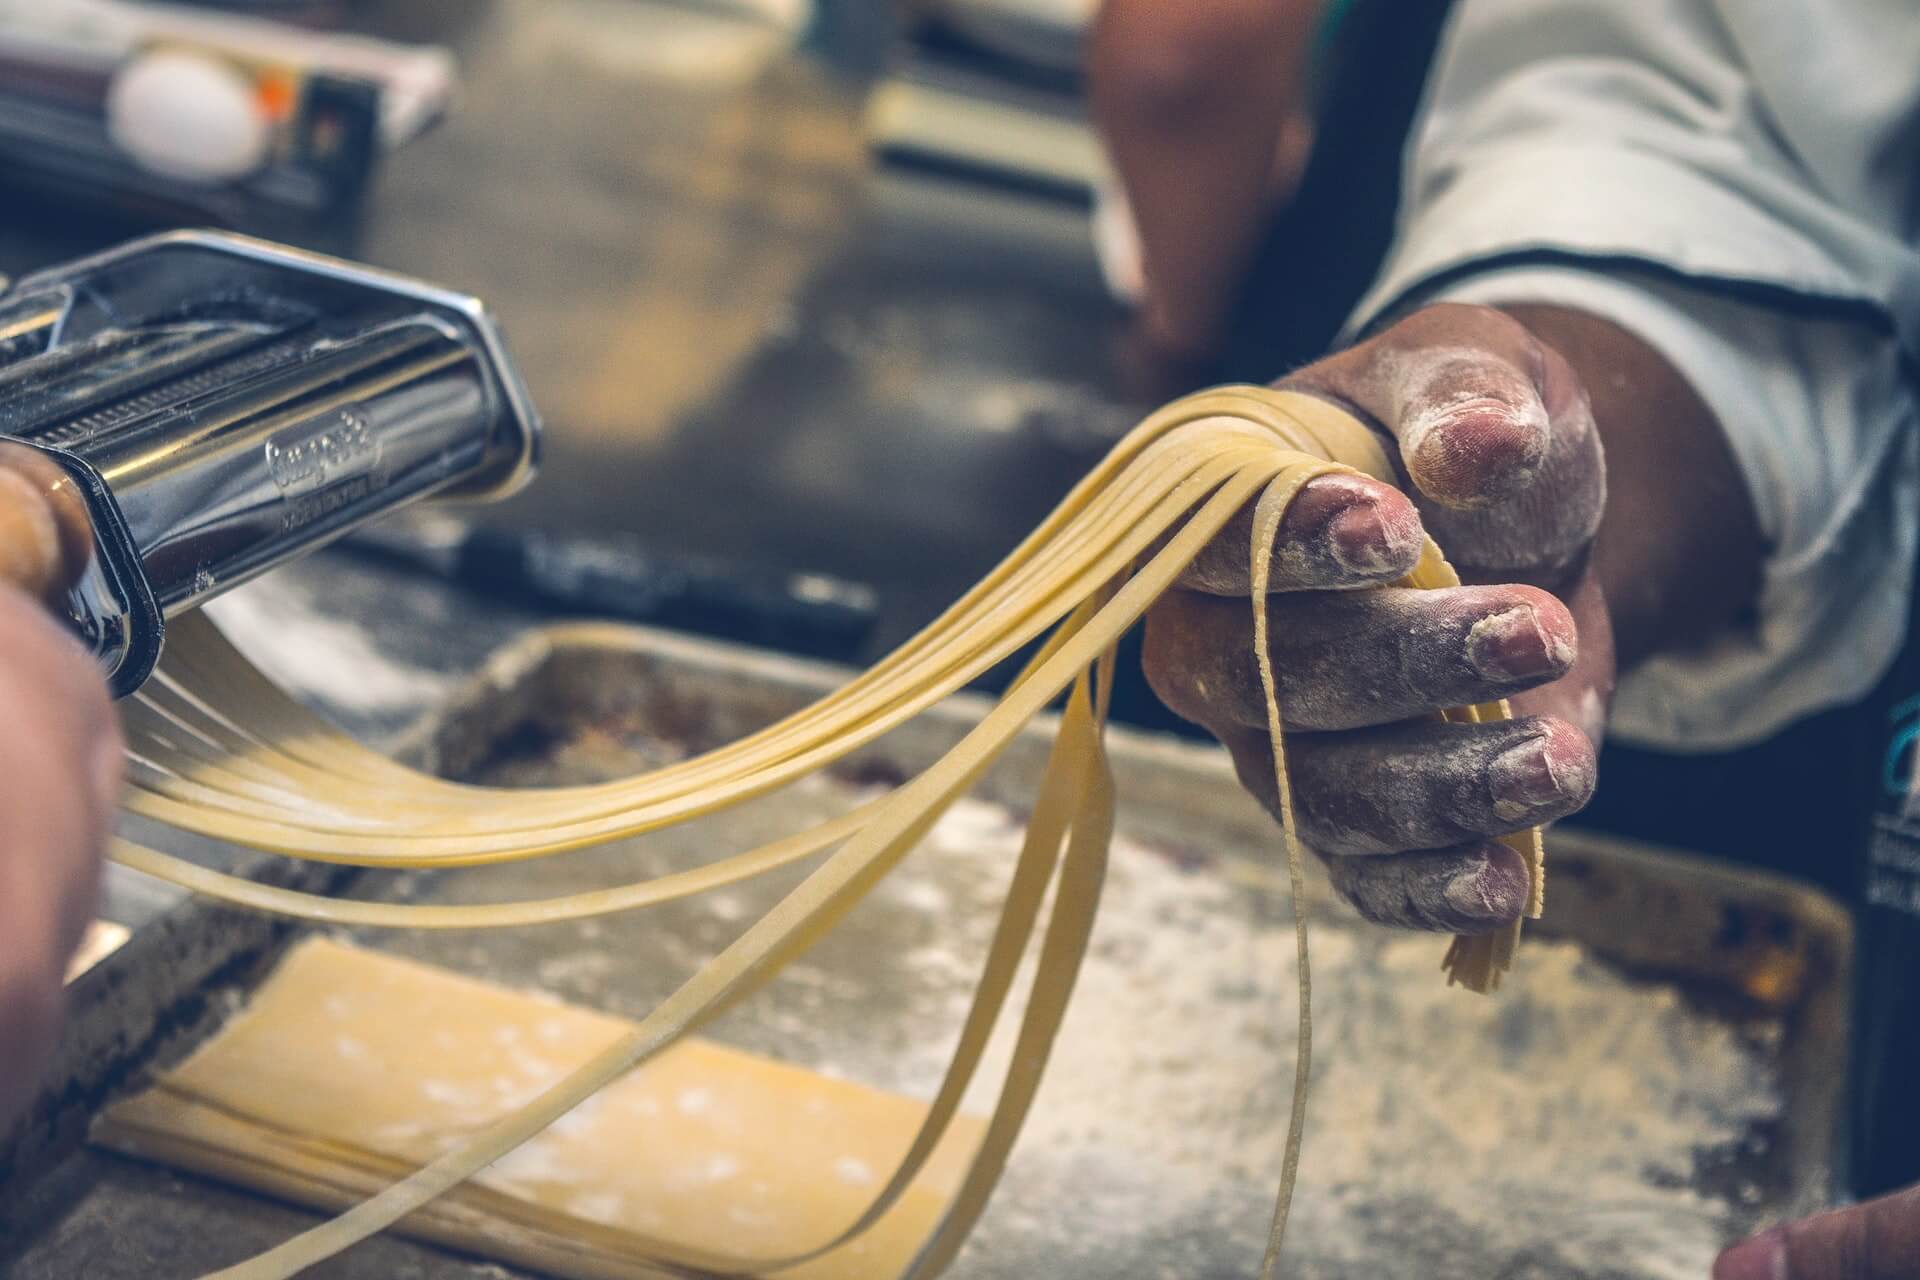
Cook making handmade pasta noodles

We don’t have a crystal ball to help us see which cuisines will be most popular. Obviously, the same holds true for knowing which are just now getting recognition.

However, we do have the next-best thing: data from Datassential.

Recently, the food and beverage analytics firm ranked dozens of global cuisines according to their current state of popularity among diners.

Then, they shared that information in October during their “Around the World in 80 Trends” webinar.

“Ubiquity”

When analyzing food and beverage trends, Datassential funnels them into four distinct designations: Inception, Adoption, Proliferation, and Ubiquity.

Arguably, once a trend reaches Proliferation and Ubiquity it becomes a mainstay. So, we can more than likely stop referring to it as a trend.

Now, the two most precarious stages for a trend are Inception and Adoption. Plenty of trends die on the Inception vine. Several won’t make it out of Adoption.

When you see Datassential’s list of global cuisines that fly under the Ubiquity banner, I doubt there will be much surprise:

  • Italian
  • Southern
  • Mexican
  • Creole/Cajun
  • Tex Mex
  • Chinese

So, any shocks to your system there? Most likely not.

“Proliferation”

Another to label this Datassential designation is “second most popular.” Each of these cuisines has a clear shot at reaching Ubiquity.

In fact, I find one of the global cuisines in this category surprising. It’s the first one in this list:

  • Japanese
  • Regional Italian
  • Regional Mexican
  • Greek
  • Mediterranean
  • Regional US
  • Southwestern
  • Cuban

As you’ll see, the lists grow longer steadily as we move down from Ubiquity.

“Adoption”

For me, it’ll be interesting to review follow-up data from Datassential regarding global cuisines.

As such, I’m eager to learn which cuisine from the list below reaches Proliferation in 2022:

  • Caribbean
  • Indian
  • French
  • Regional Chinese
  • Oaxacan
  • German
  • Middle Eastern
  • Korean
  • Ashkenazi
  • Hawaiian
  • Vietnamese
  • Venezuelan
  • Spanish
  • Sicilian
  • Jamaican
  • Israeli
  • Thai
  • British

To be honest, my first reaction to seeing French cuisine under the Adoption banner was surprise. Of course, I then thought back to how many French restaurants we have here in Las Vegas.

Sure, this little city in the desert is a foodie destination. However, French restaurants don’t dot the landscape like those that focus on other cuisines.

“Inception”

That brings us to the first stage of any trend: Inception.

Now, the first thing you’ll notice is that this category contains the most global cuisines. Whereas Adoption features 18, Proliferation lists eight, and a mere six have reached Ubiquity, Inception identifies two dozen.

They are as follows:

  • Brazilian
  • Mizrahi
  • Russian
  • Malaysian
  • Croatian
  • Moroccan
  • Lebanese
  • South African
  • Native American
  • Central American
  • Argentinian
  • Peruvian
  • Filipino
  • Appalachian
  • Sephardic
  • Ethiopian
  • Senegalese
  • Scandinavian
  • Sonoran
  • Nigerian
  • Iranian
  • Persian
  • Turkish
  • Polish

Again, there are some surprises here, at least for me. For example, I expected Ethiopian cuisine to have reached Adoption by now.

Takeaways

Of course, there are multiple ways to interpret this data.

First, you can embrace Ubiquity, leveraging their incredible popularity. However, standing out and building traffic will be challenging.

Second, you can feature Proliferation cuisine. Sure, these have yet to reach the Ubiquity stage. But they’re close to doing so, and you’ll also face stiff competition.

Third, focusing on cuisine from the Adoption designation involves taking a risk but mitigating it somewhat. These cuisines are developing a following and guest demand.

Finally, the riskiest move, depending on location: featuring Inception cuisines. But with risk comes reward. Identify a gap in a certain area—something we can do with our signature feasibility studies—and you may realize staggering success.

So, what do you think? Did you find any of Datassential’s designations surprising for certain cuisines? Let us know on our Instagram, Facebook, Twitter or LinkedIn pages!

Image: Jorge Zapata on Unsplash

by David Klemt David Klemt No Comments

Things Looking Up For December

Things Looking Up For December

by David Klemt

Friends toasting with Champagne outside during the winter

Food and beverage research and analytics firm Datassential’s end-of-year insights point to a positive outlook for restaurants in December.

While many consumers still have reservations about spending time in public, others are eager to return to “normal.”

Restaurants and bars are expected to play an important role in reaching normalcy this holiday season.

Let’s take a look at Datassential’s 2021 Holiday Issue statistics.

Hesitancy Waning?

Let’s get the less-promising data out of the way first. Some consumers still find the idea of in-person restaurant visits uncomfortable.

Nearly half of Boomers surveyed by Datassential (46 percent) said they’re “significantly less likely” to visit a fast-casual or fast-food restaurant in December.

And, interestingly, 42 percent of men gave the same answer for visiting traditional sit-down restaurants.

However, of all the in-person options presented to participants by Datassential, restaurants performed the best.

More than half of all respondents—men, women, Gen Z, Millennials, Gen X, Boomers—plan to visit fast-casual, fast-food, and sit-down restaurants more in December than they have in recent months.

It’s most likely that anticipation for restaurant visits is driven by the desire to gather and celebrate the holidays.

Overall, 57 percent of respondents plan to visit fast-casual and fast-food restaurants more. And 47 percent expect to visit sit-down restaurants more.

That makes those two options the top answers.

Only 16 percent of respondents indicated they don’t plan on visiting any on-site foodservice venues.

Regarding bars, sports bars, lounges, and nightclubs, men are “significantly more likely” (23 percent) to visit those types of venues in December.

Holiday Opportunity

According to Datassential’s report, the opportunity for holiday bookings is out there.

More than likely, gatherings will simply be smaller than they were prior to the pandemic.

Asked about plans to gather at restaurants in December, get-togethers are expected to be “moderately sized.”

Almost half of survey respondents (44 percent) plan on gathering at restaurants in parties of seven to twelve.

Just over a quarter (29 percent) plan on get-togethers of six or fewer of people. Only 18 percent of respondents are planning large (13 to 18 people) gatherings at restaurants in December.

As far as parties of 19 or more, just nine percent of respondents plan “very large” gatherings.

Of course, individual operations’ results will vary. However, this information gives us an idea of what traffic may look like for many operators.

2021 Spending

This is where the news looks even better for restaurants, bars and nightclubs in December.

When asked about spending money on going out to eat and for drinks, just 18 percent of respondents said they planned to spend less this year than in 2020.

Very nearly half (49 percent) plan to spend the same as they did last year. However, 32 percent said they think they’ll increase their spending.

When it comes to New Year’s Eve, the numbers shift a bit. However, 50 percent of respondents plan to spend the same on NYE in 2021 as they did in 2020.

Twenty-six percent plan to spend more on NYE in 2021. Just 24 percent plan to spend less this year on NYE.

Per Datassential, Millennials are most likely to splash out for NYE this year.

So, things won’t be returning to pre-pandemic normalcy by 2021’s end. However, if Datassentials findings prove accurate, things are looking healthier for December.

Image: Christine Jou on Unsplash

by David Klemt David Klemt No Comments

How is Plant-based Performing?

How is Plant-based Performing On-premise?

by David Klemt

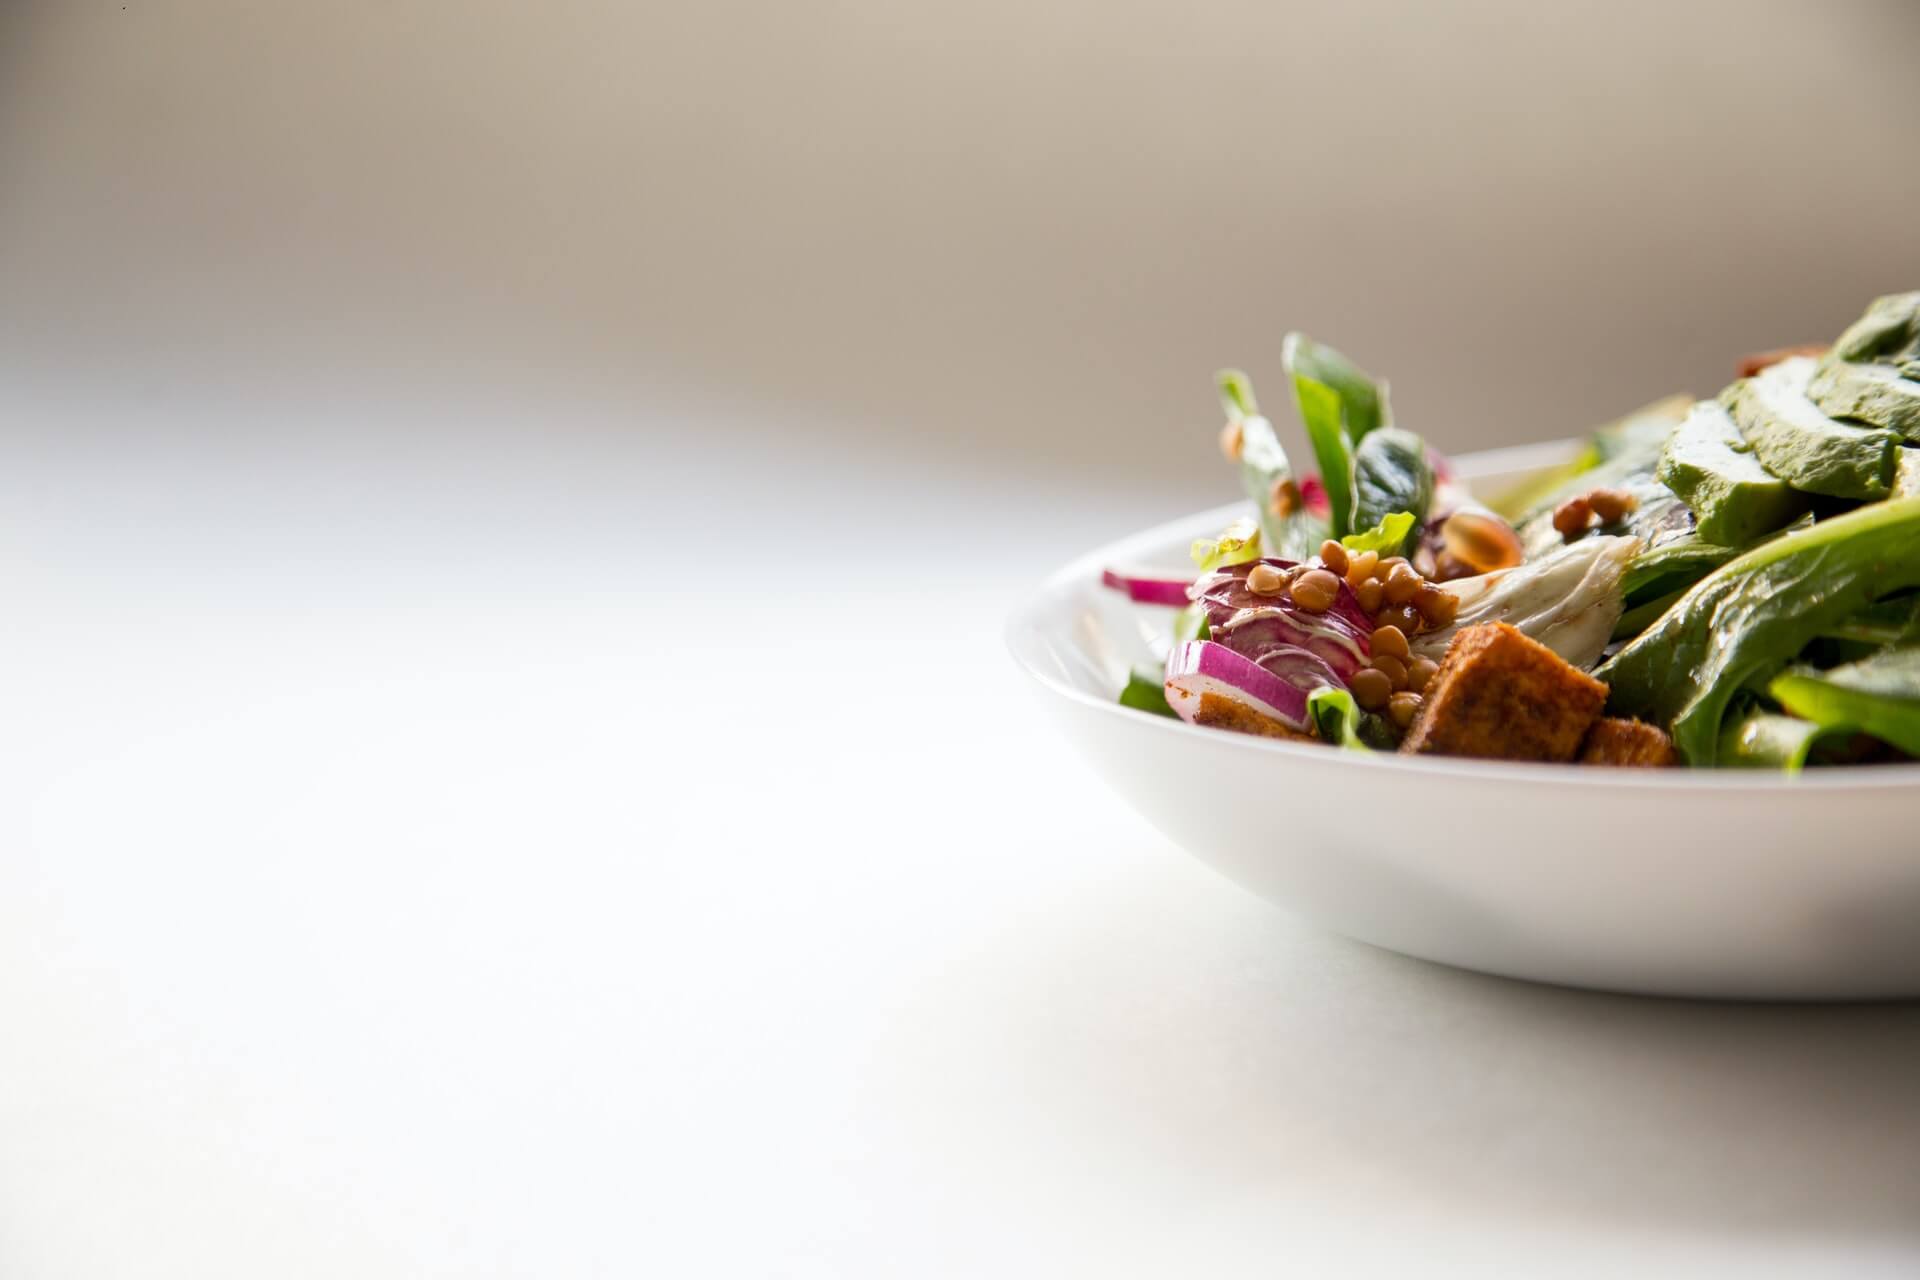
Plant-based food bowl

With plant-based food options making their way to global fast food chains, it’s clear the category is continuing to heat up.

In fact, it’s likely time to stop referring to plant-based menu items as a trend. Obviously, they’re here to stay.

But how are these items actually performing on-premise? Is the category experiencing real growth or barely noticeable?

“Proliferation”

We’re full throttle into the holiday season. People are focusing on spending time with family and friends.

And what does that mean? Gathering for meals.

So, if restaurant traffic is going to tick up, it makes sense to see if plant-based should be more prevalent on menus.

To that end, Datassential revealed data on this category two weeks ago during their “Holidays Ahead!” webinar. Of four trend-tracking designations—Inception, Adoption, Proliferation, Ubiquity—Datassential notes plant-based menu items are in the Proliferation stage on-premise.

Analyzing data from 2011 to 2021, Datassential showed that the category started growing in terms of menu placement in 2018. As of this year, plant-based items are on nearly five percent of restaurant menus.

That may not seem like impressive growth. However, there was zero-point-zero-percent growth between 2011 and 2014. In 2015 and 2016, Datassential shows that only 0.1 percent of restaurants offered plant-based menu items. That growth doubled in 2017 (0.2 percent), then doubled again in 2018 (0.4 percent).

In 2019, the category quadrupled to inclusion on 1.6 percent of restaurant menus. Last year, that growth more than doubled to 3.5 percent.

According to Datassential, 28 percent of consumers like or love plant-based menu items. Interestingly, the research agency finds that all types of consumers like plant-based items, not just vegetarians or vegans.

The Datassential breakdown of plant-based menu proliferation by restaurant category is as follows:

  • Fast Casual: 11.5%
  • Casual Dining: 5.4%
  • Midscale: 3.9%
  • Quick Service: 3.4%
  • Fine Dining: 1.8%

Chains are more likely, at this time, to feature plant-based menu items.

Upscale Options

Wanting to include plant-based options and knowing where to start are two different things.

As it happens, Datassential featured a timely real-world menu to that should inspire operators this season.

Watercourse Foods in Denver, Colorado, offers mains and sides that will resonate with holiday diners:

  • Seitan Roast (wheat, soy, blend of herbs) which stands in for roast turkey.
  • Pot Pie consisting of carrots, celery, onions and mushroom.
  • Root Vegetable Stuffing made with root veggies (obviously), savory herbs, and housemade bread.
  • Mac and Cheese featuring shells tossed in cheese fondue and topped with shiitake “bacon” bits and breadcrumbs.

As you’ll notice, you don’t need to limit your menu to products from Beyond or Impossible. Obviously, you can leverage their brand recognition but you can also utilize your current plant-based inventory to create housemade menu items.

If you’re ready to embrace plants at your restaurant or bar, activate your kitchen team. With a bit of creativity you can take advantage on the rise in popularity of everything plant-based.

Image: Hermes Rivera on Unsplash

Top