Notice: Function _load_textdomain_just_in_time was called incorrectly. Translation loading for the smart-post-show-pro domain was triggered too early. This is usually an indicator for some code in the plugin or theme running too early. Translations should be loaded at the init action or later. Please see Debugging in WordPress for more information. (This message was added in version 6.7.0.) in /var/www/wp-includes/functions.php on line 6114
Labor | KRG Hospitality

Labor

by David Klemt David Klemt No Comments

The Batching Superpower of Sūpāsawā

The Batching Superpower of Sūpāsawā

by David Klemt

A bunch of limes and lemons

One of our favorite products from WSWA’s Access LIVE 2024 event in Las Vegas can save operators and bar teams time and money.

Access LIVE, the annual Wine & Spirit Wholesalers of America (WSWA) event is always chock full of notable items. However, this one in particular stood out to me and my colleagues.

Coming out of Deluxe Distillery in Belgium, Sūpāsawā Seriously Sour Cocktail Mixer is here to make lives easier.

Of course, it’s not surprising that this mixer is so impressive. Sūpāsawā is produced alongside high-quality stablemates, after all: Blind Tiger Handcrafted Gin, Mary White Premium Vodka, and Yusibi Honey Based Aperitif.


View this post on Instagram


A post shared by Supasawa (@supasawaco)

In short, this innovative mixer can replace citrus. Importantly, it’s also widely available around the world. Speaking to the core of our audience and clients, it’s available in Canada and the US. When I asked about availability in the US, I was told it’s in 30 states currently.

Operators in the UK, Europe, Australia, and many more regions should also be able to get their hands on Sūpāsawā.

So, what is this magical mixer, exactly? It’s a simple and clean stand-in for expensive and time-consuming citrus.

Deluxe’s super sour mixer is distilled water, citric acid, malic acid, tartaric acid, phosphoric acid, and succinic acid. The liquid is crystal clear, aroma-free, and an incredibly convenient substitute for lemons and limes.

Real-life Scenario

Consider the following real-life hypothetical that shines a light on Sūpāsawā’s real-life benefits.

Let’s say someone hires an operator for a catered event. Included in this event is bar service, and involves more than pouring wine and beer.

Along with a handful of calls, the client and their guests expect a signature cocktail. Well, batching a cocktail or two ahead of the event would be a smart move.

However, we all know what that means: purchasing and juicing citrus. And we also all know what else that means: labor costs for all that prep.

What if one bartender or bar back could batch a cocktail in less than five minutes? Yes, I’m talking under five minutes for the entire batching process.

That scenario is nearly identical to Deluxe Distillery’s Access LIVE 2024 situation.

Deluxe showed the convenience and superpower of Sūpāsawā at their booth via batching. According to the bartender and ambassador who prepared the standout cocktail, he added all the ingredients—including the super sour mixer—to a jug, shook it, and it was ready to go in less than five minutes.

Real-life Benefits

Does this mean you’ll never have to buy lemons and/or limes again? For the vast majority of bars, no. However, the more drinks you can make with Sūpāsawā, the more you can plan for and control the cost of citrus.

Per Deluxe, operators can expect to save 15 minutes per liter of citrus juiced. The distillery also says each bottle of Sūpāsawā represents 35 pieces of fruit an operator won’t have to purchase. On average, a single cocktail requires just 20 ml of Sūpāsawā, or 2/3 of an ounce. With each bottle coming in at 700 ml, that’s 35 individual cocktails per.

When I asked about unit cost at their Access Live 2024 booth, Deluxe said operators can expect a price of $9 per unit. People who do the math can see the benefit of getting their hands on Sūpāsawā for individual, kegged, and batched cocktails.

In terms of storage, the slim bottle can last for about two years unopened. After it’s opened, Sūpāsawā should last for up to a year. Compare that to the two- to three-day shelf life of lemon or lime juice.

Notably, using Sūpāsawā leads to consistency. Because it always tastes the same, drink consistency is improved. And, of course, using this super sour mixer leads to producing less food waste.

Click here to learn more about Sūpāsawā and what it can do for an operator’s bar program, catering, and bottom line. Oh, and click here for recipes. Cheers!

Disclaimer: Neither the author nor KRG Hospitality received compensation, monetary or otherwise, from Deluxe Distillery, WSWA, or any other entity in exchange for this post.

Image: Irina on Unsplash

KRG Hospitality Start-Up Restaurant Bar Hotel Consulting Consultant Solutions Plans Services

by David Klemt David Klemt No Comments

Ontario Updates Employment Standards Act

Ontario Updates Employment Standards Act

by David Klemt

Daytime photo of the Toronto, Ontario, Canada, skyline

Yesterday, Ontario, Canada’s government tabled updates to the province’s Employment Standards Act meant largely to protect restaurant and hospitality workers.

These explicit protections are known as Bill 79, Working for Workers Four Act, 2023.

Interestingly and timely, the updates seem to be, at least in part, a direct response to technological developments.

For example, Bill 79 addresses digital payment apps and artificial intelligence. I’ll expand on that below.

These updates certainly appear to have been drawn up to protect restaurant workers specifically, and hospitality professionals overall.

An End to Unpaid Trial Shifts

One of the most significant updates addresses hours and pay.

It likely shouldn’t have to be said but, according to Ontario law, an employee must be paid for all the hours they work. This includes trial shifts.

Specifically, the new legislation expressly prohibits unpaid trial shifts.

Pooling Tips

Employers in Ontario are well within their rights to share in pooled tips. That is, if the employer is performing the same tasks as staff.

However, there’s now an update to this practice within the Employment Standards Act.

If any employer intends to share in a tip pool, they must make this clear and inform staff.

Speaking of Tips…

For the most part, digital payment platforms bring with them transaction fees. This includes fees for restaurant workers to get their tips.

“We’re seeing apps that are taking a cut every time…a worker accesses their tips, and that’s not acceptable,” says Piccini.

So, moving forward, employees who are paid tips via direct deposit will have more control. The updates to the Employment Standards Act now state that employees paid this way can choose where their tips will be deposited.

Deducting Wages

Per multiple studies, one in 20 diners has dined and dashed. Apparently, it has been common practice for some employers to deduct wages in response.

Personally, I think it’s ridiculous for any employers to pass a business loss on to their workers. That’s neither good leadership, ethical, or a healthy work culture. I’m not saying I’m surprised it happens; I’m disgusted that it still happens.

Now, the practice of penalizing employees monetarily for guests dining and dashing is prohibited specifically. Will that stop it from happening? Probably not, although perhaps it will happen much less moving forward.

This also includes language that makes it illegal to deduct pay from employees due to customer “gassing and dashing.” For anyone wondering, gas theft affected Ontario businesses to the tune of $3 million CAD in 2022.

Artificial Intelligence

Some employers, as many job hunters are aware, use artificial intelligence during the hiring process.

Now, these employers will have to disclose their use of AI in job listings. In theory, this update addresses privacy and data collection concerns.

Further, job listings will now have to include salary ranges. Also, employers are now prohibited from requiring work Canadian work experience in their job listings or on their application forms.

To review Bill 79 in its entirety, click here.

Image: mkdrone_ on Unsplash

Bar Nightclub Pub Brewery Operations Standard Operating Procedures SOP

by David Klemt David Klemt No Comments

US Restaurant Employment Still Short

US Restaurant Employment Creeping Toward February 2020 Levels

by David Klemt

Restaurant door handle that says "push"

Keep pushing. We have work to do to reach February 2020 employment levels.

After what appeared to be a strong September 2023, restaurants and bars saw a decline of 7,500 jobs in the month of October.

In fact, the strong numbers from September were notably weaker once revised. After revisions, eating and drinking businesses added 48,300 jobs, not the nearly 61,000 from preliminary reports.

Importantly, a correction in employment numbers for August 2023 has revealed further declines. Initially, reports stated that restaurants had added 14,400 jobs. Unfortunately, the corrected number showed that restaurants shed 9,300 positions.

However, context is important. Notably, the unemployment rate in the US has remained under four percent for nearly 24 months. As of the latest reporting by the US Bureau of Labor Statistics, unemployment is at 3.9 percent.

Numbers by Restaurant Category

The data in this subsection comes from the National Restaurant Association. As the NRA notes, this information is based on data from September 2023.

These numbers should provide further context for restaurant and bar’s current situation. Some restaurant categories are struggling more than others to reach or surpass pre-pandemic levels of employment.

Below, employments numbers for September 2023 in comparison to February 2020.

  • Full-service: -214,000 jobs
  • Quick-service and Fast Casual: +128,000 jobs
  • Bars and Taverns: +50,000 jobs
  • Cafeterias and Buffets: -36,600 jobs
  • Catering and Mobile Food Service: +14,900
  • Snack and Non-alcohol Beverage Bars: +107,000 jobs
  • Foodservice Contractors: +15,100 jobs

As you can see, full-service restaurants are struggling the most to reach pre-pandemic employment numbers. However, QSRs and bars have surpassed that milestone.

By the Numbers

Below, the change in employment in each state and Washington, DC. The time period the data span runs from September 2019 to September 2023*.

  • Alabama: -5,700 (-3.4%)
  • Alaska: +100 (+0.4%)
  • Arizona: +18,200 (+7.6%)
  • Arkansas: +7,900 (+8.1%)
  • California: +32,700 (+2.2%)
  • Colorado: +9,100 (+3.8%)
  • Connecticut: -1,200 (-1.0%)
  • Delaware: +2,500 (+6.4%)
  • District of Columbia: -2,500 (-4.5%)
  • Florida: +35,200 (+4.4%)
  • Georgia: +21,800 (+5.5%)
  • Hawaii: -4,900 (-6.9%)
  • Idaho: +7,000 (+11.5%)
  • Illinois: -11,000 (-2.3%)
  • Indiana: +7,900 (+3.2%)
  • Iowa: -200 (-0.2%)
  • Kansas: +4,800 (+4.7%)
  • Kentucky: -400 (-0.2%)
  • Louisiana: -9,000 (-5.2%)
  • Maine: -4,000 (-7.9%)
  • Maryland: -16,700 (-8.0%)
  • Massachusetts: -15,600 (-5.6%)
  • Michigan: -21,400 (-6.3%)
  • Minnesota: -9,000 (-5.2%)
  • Mississippi: -1,700 (-1.7%)
  • Missouri: -3,500 (-1.5%)
  • Montana: +4,500 (+10.7%)
  • Nebraska: +600 (+0.8%)
  • Nevada: +22,300 (+16.7%)
  • New Hampshire: -1,500 (-2.9%)
  • New Jersey: +7,400 (+2.7%)
  • New Mexico: +3,100 (+4.2%)
  • New York: -10,000 (-1.4%)
  • North Carolina: +12,900 (+3.3%)
  • North Dakota: -100 (-0.3%)
  • Ohio: -6,300 (-1.4%)
  • Oklahoma: +3,600 (+2.5%)
  • Oregon: -2,000 (-1.2%)
  • Pennsylvania: -5,600 (-1.3%)
  • Rhode Island: -2,000 (-4.3%)
  • South Carolina: +1,000 (+0.5%)
  • South Dakota: +3,100 (+9.4%)
  • Tennessee: +8,000 (+3.0%)
  • Texas: +74,200 (+6.6%)
  • Utah: +12,900 (+12.0%)
  • Vermont: -1,000 (-4.7%)
  • Virginia: -100 (-0.0%)
  • Washington: +3,900 (+1.5%)
  • West Virginia: -2,600 (-4.6%)
  • Wisconsin: -8,100 (-3.8%)
  • Wyoming: -100 (-0.5%)

Ups and Downs

First, the less-positive news: restaurant employment is below pre-pandemic levels in more than half of the country. Including Washington, DC, 27 states are still lagging behind September 2019.

However, in some cases the change is negligible.

For example, Wyoming is down just 0.5 percent, and Virginia is down just 100 jobs or 0.00033 percent. Of the 27 states seeing declines, 20 are down less than five percent in comparison to September 2019.

Of course, it’s important to note that Hawaii, Michigan, and Massachusetts are down more than five percent.

So, to the good news. Two dozen states are enjoying restaurant and bar employment above September 2019 levels.

Four states are up more than ten percent. Nevada is leading the way, up 16.7 percent. Next is Utah, up 12 percent. Following in third is Idaho, up 11.5 percent.

Takeaways

Restaurant employment’s pre-pandemic peak was in February 2020. As of the most-current data, we’re down 14,000 jobs.

According to the most recent data, restaurants and bars employ 12.32 million people in the US. While we have yet to reach the 12.34 million that were employed in February 2020, we’re not far off. We still have reason to be positive about recovery.

The larger threat looming over operators is rising costs. Additionally, depending on the source, a recession is either a possible or current threat.

Of course, there’s still increasing demand from consumers to gather at restaurants and bars. So, again, there’s reason to remain positive.

This is all to say that numbers without deeper understanding and nuance only provide surface context. They can make us panic or breathe a sigh of relief, seemingly at the drop of a hat. We can either worry that we haven’t reached the pre-pandemic milestone, be positive that we’ll reach that number in the near future, or decide that perhaps that metric shouldn’t be the primary one by which we measure recovery.

In short, operators positioning themselves for long-term success understand their market, their teams, and their guests; focus on staff and guest retention; develop community engagement and support; and have strategic clarity.

*Sources: US Bureau of Labor Statistics, National Restaurant Association

Image: Tim Mossholder on Unsplash

Bar Nightclub Pub Brewery Winery Staff Talent Consulting

by David Klemt David Klemt No Comments

Do You Need a Restaurant Chatbot?

Do You Need a Restaurant Chatbot?

by David Klemt

Robot hand reaching for human hand

The labor shortage, increasing demand for convenience, and artificial intelligence are converging to make a strong case for restaurant chatbots.

Specifically, bots that can take orders accurately. As consumers increasingly live their lives on demand, any perception of even minor inconvenience can turn someone against a brand or venue.

In addition to convenience, today’s consumer, generally speaking, also expects to find more technology when engaging with a business. Likewise, workers expect employers to implement more tech, whether it’s welcome or not.

When it comes to our industry, that means everything from streamlined POS systems and powerful CRM platforms to predictive ordering software and cobots.

Looking at generative AI and guest-facing tech, it won’t be long before guests expect to place their orders via chatbot.

In fact, some consumers are placing orders with restaurant bots now. There are already text- and voice-based restaurant bots out in the world. So far, it appears that many QSRs are implementing generative AI bots to handle orders.

As some of the companies developing restaurant bots point out, they never tire. The bots never feel overwhelmed. They can field a limitless amount of calls, working around the clock without breaks, every day of the year. Obviously, restaurant bots don’t get sick, ask for time off, or no-call, no-show.

So, for high-volume restaurants, particularly those with drive-thrus, restaurant bots are probably incredibly attractive. Clearly, labor is still an issue. And these restaurant bots promise to take the ordering process out of workers’ hands, allowing them to focus on “more important” tasks.

Now, couple that with guests seeming less patient, less forgiving, and more obsessive about convenience. On-demand solutions certainly appear great on paper.

Text Bots

We know that guests are already interacting with restaurant bots. When they visit a restaurant’s website or download its app if they have one, they’re encountering bots.

Some provide information, some can make reservations, and an increasing number can take orders. There are bots that imitate a text exchange, and those that streamline the ordering process by using canned replies.

One of the better known of these is Dom, Domino’s chatbot. Whether via app or website, Dom walks people through the ordering process easily and, in my experience playing with this tool, quite simply.

Further, Dom can “remember” previous orders (when a customer is logged into their account) and reorder them. The bot can make recommendations, and it will search for and apply coupons or promotions.

These functions are, of course, the pros of restaurant bots. As their ability to handle more complex tasks increases, the promise is that they’ll do more than offer convenience or solve some labor issues.

Rather, they’ll also generate more revenue by making personalized recommendations, upselling customers, and reaching out to customers to prompt them to place an order.

Voice Bots

As operators whose phone lines light up from open to close can attest, there are people who prefer to talk to someone to place an order.

Well, there are now restaurant bots that can field those calls.

One provider of this tech is ConverseNow. The company uses voice AI, which they explain is also known as conversational AI on their website. Their tech handles phone and drive-thru orders, and the experience is close to, if not exactly like, speaking with their human counterparts.

According to ConverseNow, operators no longer have to worry about unanswered calls. Customers won’t call in only to hear a busy signal. Drive-thru times are reduced. Workers can focus solely on service, prep, and fulfilling orders.

Additionally, the company is focusing on accuracy. There’s an agent-assisted solution, for example. If a complex order comes in, an agent can take over before things go sideways. Agents can also help ConverseNow’s AI to learn from new situations, ensuring the customer experience is painless and even more accuracy.

The tech is so good that Domino’s uses it along with Dom. Per the ConverseNow website, the tech integrates with leading POS systems like Toast; is live in more than 1,200 restaurants in over 40 states; and has taken 8.5 million orders and freed up one million labor hours for their clients.

Along with ConverseNow, operators can look into HungerRush, Yellow.ai, and other solutions.

Takeaway

Restaurant bots certainly make sense for high-volume, limited-service, and QSR operators. They can reduce labor costs and capture more (if not every) order with ease.

However, we need to consider the impact of reducing or eliminating human interactions in hospitality. Whether in the front or back of house, we appear to be heading toward an industry putting less emphasis on the human element.

Yes, team members still interact with guests to take in-person orders and for in-person dining. That is, for now.

In the QSR space in particular, ordering kiosks are becoming more common. At some point, AI-powered kiosks, along with other AI tools, will replace the need to interact with humans in fast-casual and casual-dining restaurants.

It seems at odds with the spirit of hospitality for guests to not have to interact with a team member until their food needs to be dropped. And with cobots, that’s also a task an operator can automate.

I’m all for progress and innovation. And I’m all for delivering on the guest expectation of convenience. However, it’s a balancing act. An operator opting to automate tasks so team members can better engage with guests needs to ensure that’s actually happening.

I don’t think we need less human interaction. And I, for one, have a growing concern that some operators are journeying further down the path of barely seeing the people they employ as people. Rather, too many are increasingly seeing team members as liabilities and nothing more.

I point that out to say this: When considering implementing any new tech, consider the impact on more than just P&Ls. This is a people business, and dedicating yourself to slashing costs and boosting revenue ruthlessly runs the risk of making a restaurant less hospitable for guests and staff.

Image: Cash Macanaya on Unsplash

Bar Nightclub Pub Brewery Technology Consulting Project Management

by David Klemt David Klemt No Comments

Leisure and Hospitality Adds 96,000 Jobs

Leisure and Hospitality Adds 96,000 Jobs

by David Klemt

"Optimist" graffiti

Update: The figure of 61,000 restaurant and bar jobs was adjusted to 48,300 after revisions.

The latest report from the US Bureau of Labor Statistics reveals that the outlook looks promising for hospitality.

Put together, leisure and hospitality added 96,000 jobs in September. However, hospitality certainly leads the way according to the most recent report.

In particular, the news is wonderful for the restaurant and bar sector. Adding 61,000 jobs in September, “food services and drinking places” are back to February 2020 levels.

Put more simply, restaurants and bars are back to pre-pandemic employment numbers. It has taken more than three years, but we can finally breathe a collective (but cautious) sign of relief.

In fact, one in five jobs created in September was in a restaurant or bar. That’s incredible growth and welcome news.

But reaching this point hasn’t been easy. Operators, along with restaurant and bar workers, have clawed their way through the past several years.

The industry has changed, and operators need to avoid the temptation of regressing. Yes, employment levels are back to where they were before the pandemic. Worker and guest expectations will not return to where they were before February 2020. The changes are here to stay.

Lodging/Accommodation

Unfortunately, not every sector of hospitality is back to pre-pandemic employment levels.

First, the positive news. Lodging (or accommodation, if you prefer) did add jobs in September. Whereas restaurants and bars rose 61,000 jobs, lodging is up 16,000.

That’s good growth and reason to be optimistic regarding that sector. That’s where the good news ends when it comes to hard employment numbers.

On the negative side, lodging hasn’t yet returned to pre-pandemic employment levels. In fact, the sector is remains down by 217,000 jobs when compared to February 2020.

Should lodging/accommodation continue to add jobs at this pace, we could see a full recovery in Q4 2024.

However, the past few years have been an eyeopener for many lodging and accommodation operators. Many hotels, for example, have reduced the sizes of their teams.

It’s possible that as long as guest feedback remains positive, hotels and resorts will continue to operate with smaller teams. Indeed, technological innovations have made it simpler for mid- and large-scale properties to pare back labor.

Takeaway

While returning to pre-pandemic employment levels in restaurants and bars is great news, we must still be cautious.

This is a delicate situation, and one month of growth isn’t enough to shout, “We’re back!” There’s reason to be optimistic, to be sure, but adding jobs is just one part of an equation that features many variables.

For example, the unemployment level in the US remains unchanged at 3.8 percent.

So, be optimistic. Allow yourself to feel some hope. But be cautious. Continue to work toward empowering your teams, increasing traffic and revenue, mastering the guest experience, and achieving short- and long-term goals.

Image: George Pagan III on Unsplash

KRG Hospitality Start-Up Restaurant Bar Hotel Consulting Consultant Solutions Plans Services

by David Klemt David Klemt No Comments

FAST Act Fight Appears to be Over

FAST Act Fight Appears to be Over

by David Klemt

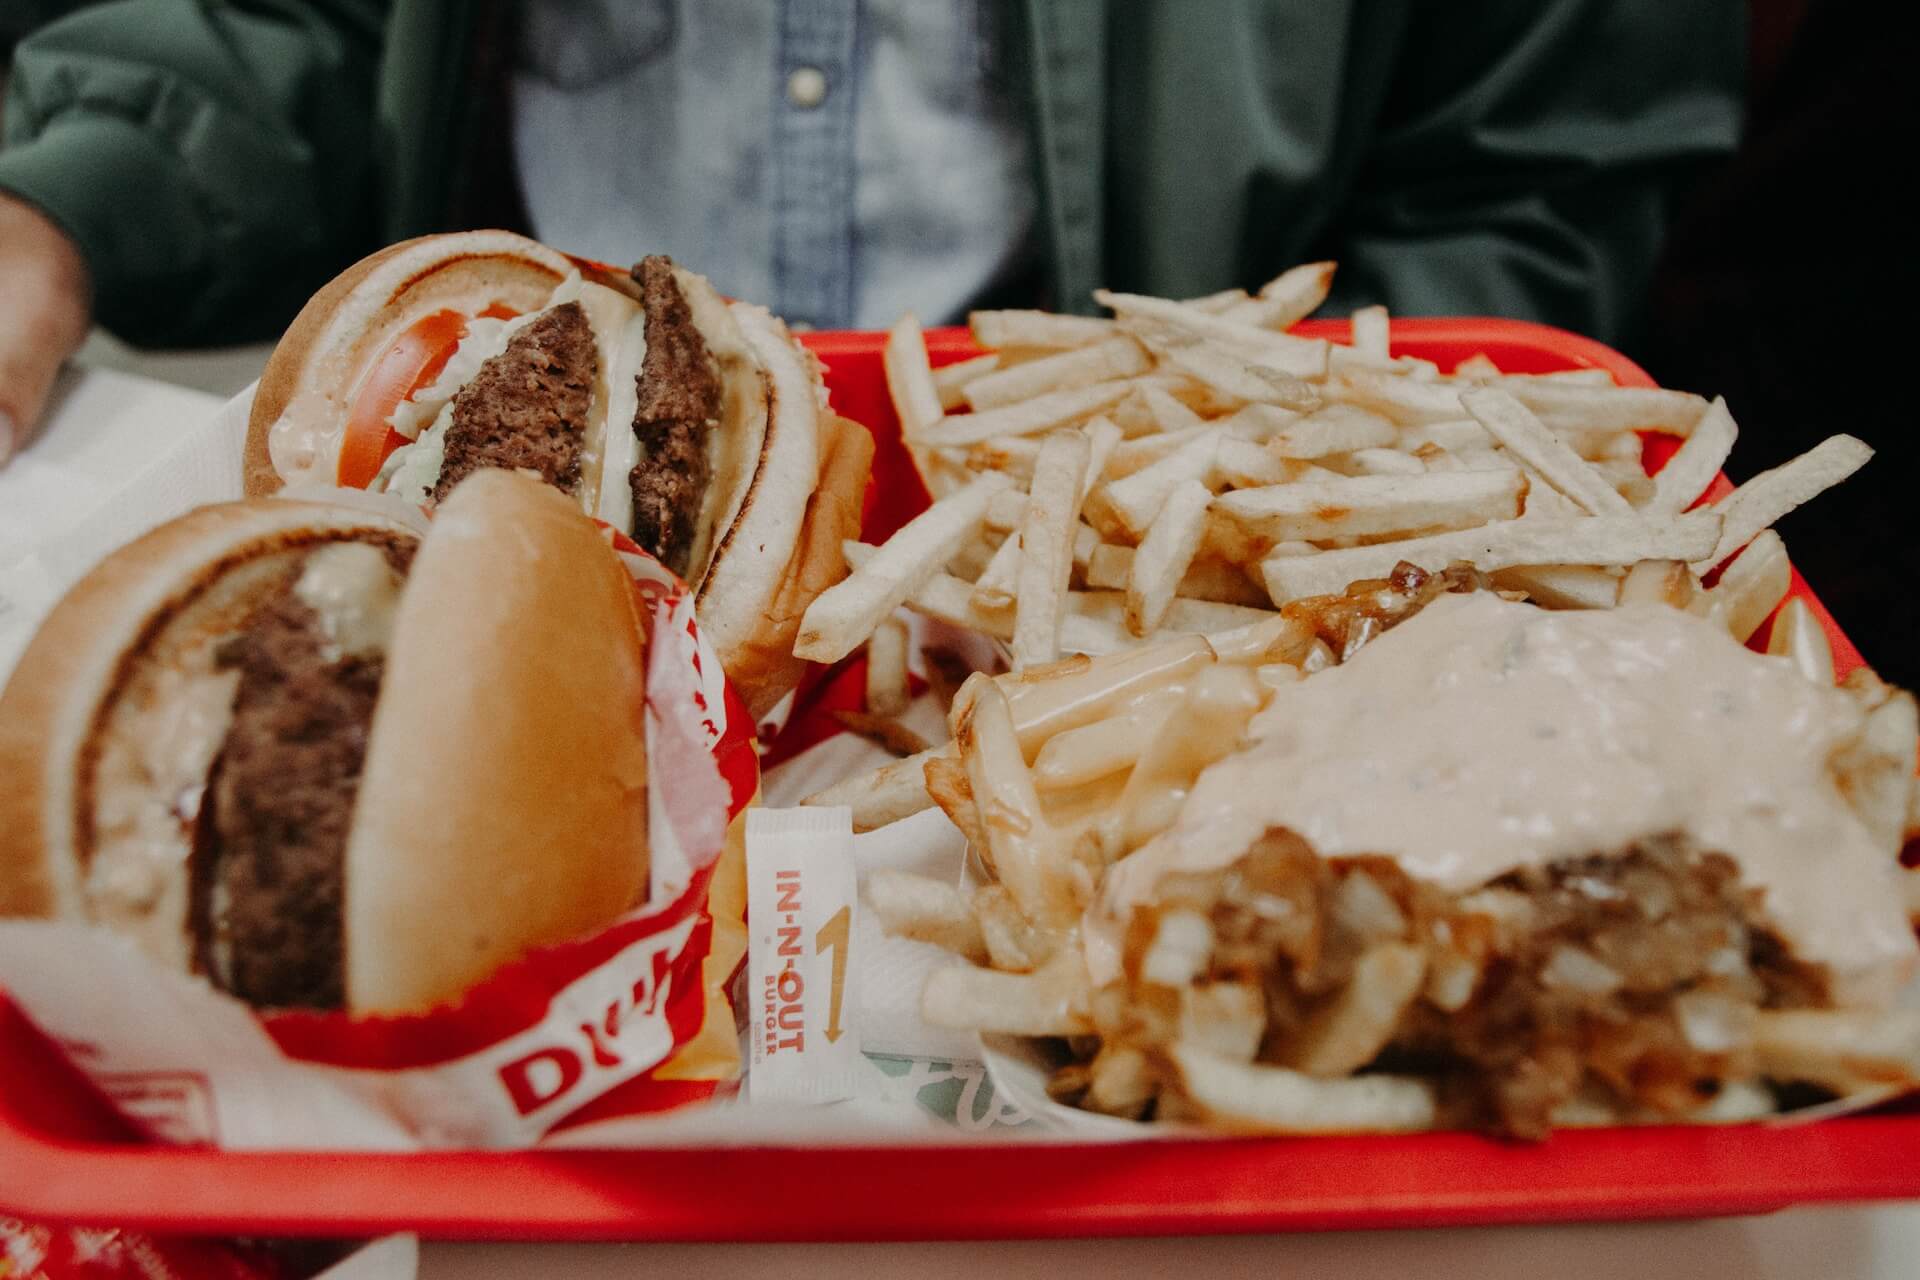
Tray with In N Out burgers and French fries

Well, that was fast: If recent reports are accurate—and it appears they are—the battle over the FAST Act has come to a close.

Rather than fight on the ballot, fast-food chain operators and labor groups have struck a deal. Per some reports, this puts a halt to a referendum battle that could have cost more than $100 million in campaign funds.

On its face, the deal is quite simple. AB 257, known as the Fast Food Accountability and Standards Recovery—or FAST Act—is dead. That is, dead save for one provision: the creation of the Fast Food Council will move forward.

The council will have a total of eleven members. Nine will have the power to vote, two will be non-voting members. The breakdown will be as follows:

  • two representatives of the fast-food restaurant industry (2);
  • two franchisees or restaurant owners (2);
  • two restaurant employees (2);
  • two advocates for fast-food restaurant employees (2);
  • member of the public who is not affiliated with either side (1, will serve as chair); and
  • members from the Department of Industrial Relations and the Governor’s Office of Business and Economic Development (2, non-voting)

Their first meeting is on the schedule for March 15.

In exchange, fast-food workers will see the minimum wage bump up to $20 per hour should they be in the employ of a fast-food chain with more than 60 locations throughout the US. That pay rise will come in April 2024.

When it comes to further pay rises, the council has two options:

  • An annual wage increase of 3.5 percent; or
  • An increase based on average changes to the consumer price index each year.

As one might expect, the rise will be whichever number is lower.

What was AB 257?

To summarize, FAST would’ve done the following:

  • Establishes the Fast Food Council, ten members appointed by the Governor, the Speaker of the Assembly, and the Senate Rules Committee. The council will operate until January 1, 2029.
  • Defines “the characteristics of a fast food restaurant.”
  • Gives the Fast Food Council the authority to set “minimum fast food restaurant employment standards, including standards on wages, working conditions, and training.”
  • Provides the council the power to “issue, amend, and repeal any other rules and regulations, as necessary.”
  • Allows the formation of a Local Fast Food Council by a county, or a city that has a population of more than 200,000.

Click here to review the bill’s text in its entirety.

Why is this Important?

It’s entirely possible that similar bills will pop up in other states in the coming years.

If this result is anything go by, such bills may be used by QSR operators and labor groups as negotiating tactics. The most recent news regarding the FAST Act should have the attention of both operators and hospitality workers. In California alone, the pay rise is expected to affect at least 500,000 workers.

However, there is one provision of the FAST Act that workers may find less than encouraging. The deal that has been struck kills a notable provision: fast-food operators, at least in California, won’t be held legally responsible for labor violations that occur in franchise locations.

Operators in other states should keep an eye out for similar bills, as should all hospitality professionals.

Image: Kenny Eliason on Unsplash

by David Klemt David Klemt No Comments

SevenRooms Introduces New Tool: Pre-Shift

SevenRooms Introduces New Tool: Pre-Shift

Front of house staff member using SevenRooms

A new tool from SevenRooms will help operators and their teams make the most of pre-shift meetings to deliver exceptional service.

Aptly named, Pre-Shift provides a real-time, data-driven picture of a given shift’s reservations. Operators and their leadership team members will no longer need to hit the office, navigate to the day’s reservations, and print out guest data—assuming they have such valuable information.

Further, this new feature is accessible via the venue’s devices (tablets, phones, etc.). Pre-Shift, then, offers a real-time view of reservations and robust guest data. Well ahead of arrivals, staff will know a guest’s seating preference, relationship with the venue, reviews they’ve left, allergies, and much more.

Intriguingly, Spago has been testing Pre-Shift ahead of SevenRooms’ announcement and launch. Per Steve Scott Springer, the GM of Spago of Beverly Hills, this new tool is a game-changer for restaurants.

Less than two months ago, SevenRooms launched Email Marketing. It’s likely we can expect more new features to roll out throughout 2023.

To learn more, please review the Pre-Shift press release below.

SEVENROOMS’ PRE-SHIFT FEATURE EMPOWERS TEAMS TO STREAMLINE PRE-SERVICE OPERATIONS

New data-driven tool serves as a one-stop-shop for restaurant teams to enhance the guest experience and build guest loyalty

NEW YORK (May 3, 2023) – SevenRooms, a global guest experience and retention platform for the hospitality industry, today announced a new product feature, Pre-Shift, which provides operators with key shift details they can leverage to inform and lead pre-service meetings. Pre-Shift is built to power and simplify pre-service meetings for restaurant operators and their staff around the world.

The new feature provides operators a real-time, unified view of everything they need ahead of each shift and saves employees’ time with an out-of-the-box informational report. Instead of paper print-outs and laborious briefing forms, Pre-Shift allows teams to harness rich customer data with up-to-the-minute information on every guest joining during that shift.

With ongoing labor shortages, Pre-Shift is a crucial tool in helping operators save time on administrative tasks like pulling guest and reservation data to optimize a team’s pre-shift meeting ahead of service with all stakeholders. This allows operators and staff to instead focus on delivering exceptional, personalized experiences the moment that guest walks through the door. Operators have the ability to embrace new consumer expectations to provide an incredible guest journey from start to finish.

By incorporating this tool, staff can utilize SevenRooms’ rich guest data and Auto-Tags to educate themselves on incoming guests. The tool highlights valuable insights such as allergy information, dining preferences, previous experiences with the restaurant, and positive/negative reviews. It also provides a quick snapshot of that day’s notes on menu specials, private events or special requests, making it easy for staff to reference back to quickly throughout the course of service. Whether it’s the maître d, host, server or back of house employees, Pre-Shift enables all staff with the information they need to deliver exceptional service, build guest loyalty, and keep up with diner expectations as they continue to evolve.

Pre-Shift helps restaurants deliver personalized hospitality at scale with invisible technology. Guest and reservation data can be accessed on the fly without double clicks or additional navigation via iPhone and iPads for the utmost convenience. No other reservation management product on the market today offers such a robust overview with automated guest data incorporated into its dashboard, saving operators time as they set up for service.

“The magic of SevenRooms is in the way that we’re able to serve up relevant guest information to restaurants at key points of service. Our new Pre-shift view takes that magic one step further by strategically aggregating the most important guest insights before service even begins,” said Allison Page, Co-Founder & Chief Product Officer at SevenRooms. “We seamlessly take the data available for a shift and serve up key insights that the front of house should be aware of heading into service – for instance, guests with a high propensity to spend, guests who have previously left negative reviews, guests with allergies and more. Pre-Shift provides operators a real-time, unified view that takes pre-service preparation to a whole new level, ultimately providing guests with exceptional, frictionless experiences.”

“Pre-Shift is a great addition to Spago’s pre-service meeting,” said Steve Scott Springer, General Manager at Spago Beverly Hills. “When we began using the group-by server feature, it really was an ‘a-ha’ moment. This is exactly the way every restaurant wants to prep their employees ahead of a shift. We put the entire view up on a screen so our team can see and follow along. This is so much easier than what we used to do – it’s a no-brainer.”

For more information about SevenRooms and its services, please visit www.sevenrooms.com.

About SevenRooms

SevenRooms is a guest experience and retention platform that helps hospitality operators create exceptional experiences that drive revenue and repeat business. Trusted by thousands of hospitality operators around the world, SevenRooms powers tens of millions of guest experiences each month across both on- and off-premises. From neighborhood restaurants and bars to international, multi-concept hospitality groups, SevenRooms is transforming the industry by empowering operators to take back control of their businesses to build direct guest relationships, deliver exceptional experiences and drive more visits and orders, more often. The full suite of products includes reservation, waitlist and table management, online ordering, mobile order & pay, review aggregation, email marketing and marketing automation. Founded in 2011 and venture-backed by Amazon, Comcast Ventures, PSG and Highgate Ventures, SevenRooms has dining, hotel F&B, nightlife and entertainment clients globally, including: MGM Resorts International, Mandarin Oriental Hotel Group, The Cosmopolitan of Las Vegas, Wynn Resorts, Jumeirah Group, Wolfgang Puck, Michael Mina, Bloomin’ Brands, Giordano’s, LDV Hospitality, Zuma, Australian Venue Company, Altamarea Group, AELTC, The Wolseley Hospitality Group, Dishoom, Live Nation and Topgolf.  www.sevenrooms.com

Image: SevenRooms

by David Klemt David Klemt No Comments

Minimum Wage Rises for Most of USA

Minimum Wage Rises for Most of USA

by David Klemt

Closeup of Ben Franklin on $100 bill

More than half of the states across America are either now seeing a boost to minimum wage or plan to increase the hourly minimum by the middle of this year.

In total, minimum wage is up in 27 states. However, the rise isn’t yet in place in a handful of states, including Nevada.

Now, the federal minimum wage still has yet to go up. That rate remains at $7.25 per hour, where it has been since 2009. For the curious, if a person works 40 hours per week and is compensated at the federal minimum rate, that’s just over $15,000 per year—before taxes.

Per Motley Fool: “If we factor in inflation, [federal minimum wage] would have had to grow to $10.20 to let people buy the same amount of goods and services today [as in 2009]. In real terms, the current minimum wage has shrunk by almost 30% since it was set.”

You’ll see below that I didn’t list the increases for tipped workers. As an operator, you should already be well aware of the minimum rate your tipped workers must be paid. In all likelihood, your suite of software is already updated to the current requirements (but check yourself to be certain).

The list will provide an idea of what you’re up against. It’s difficult to recruit rock stars if you’re unable to offer wages above minimum wage, never mind at minimum wage.

Today, for most workers, the minimum isn’t going to cut it. So, when you’re looking at what you can offer, keep in mind the minimum wage for both tipped and un-tipped workers in your area.

Also, know what other operators are paying. To remain competitive, consider what else you can offer, including your values and culture.

States Increasing Minimum Wage

Below, the states with an increase to the minimum wage. Rather than organize the list by hourly rate or rate of increase, I set it up alphabetically.

  1. Alaska: $10.85 per hour
  2. Arizona: $13.85 per hour
  3. California: $15.50 per hour
  4. Colorado: $13.65 per hour
  5. Connecticut: $15 per hour (June 1)
  6. Delaware: $11.75 per hour
  7. Florida: $11 per hour (September 30)
  8. Hawaii: $12 per hour
  9. Illinois: $13 per hour
  10. Maine: $13.80 per hour
  11. Maryland: $13.25 per hour
  12. Massachusetts: $15 per hour
  13. Michigan: $10.10 per hour (could rise further; lawsuit pending)
  14. Minnesota: $8.63 per hour (small employer); $10.59 per hour (large employer)
  15. Missouri: $12 per hour
  16. Montana: $9.95 per hour
  17. Nebraska: $10.50 per hour
  18. Nevada: $11.25 per hour (July 1)
  19. New Jersey: $14.13 per hour
  20. New Mexico: $12 per hour
  21. New York: $14.20 per hour (excluding some areas); $15 per hour for fast food workers
  22. Ohio: $10.10 per hour
  23. Rhode Island: $13 per hour
  24. South Dakota: $10.80 per hour
  25. Vermont: $13.18 per hour
  26. Virginia: $12 per hour
  27. Washington: $15.74 per hour

Among the states on the list above, four are lifting minimum wage to at least $15. Those states are Connecticut, Massachusetts, California, and Washington. Additionally, the minimum wage is $15 per hour in parts of New York.

Interestingly, employers in Nevada can reduce the minimum wage by one dollar if they pay qualifying health insurance. In such a case, the hourly minimum will be $10.25.

Only one of these states, Montana, will remain under $10.

Cities, Counties, Districts

As stated above, some parts of New York have a minimum wage higher than $14.20.

There are also cities, counties, and districts boosting the minimum wage.

  • Denver, Colorado: $17.29 per hour
  • Long Island, New York: $15 per hour
  • New York City, New York: $15 per hour
  • Washington, DC: $16.50 per hour
  • Westchester County, New York: $15 per hour

Overall, more than half the country either already increased the minimum wage or will do so later this year.

Image: Adam Nir on Unsplash

by David Klemt David Klemt No Comments

Top 10 US Metro Areas by Inflow, Q3 2022

US Metro Areas with Greatest Outflow and Inflow, Q3 2022

by David Klemt

Tower Bridge in Sacramento, California

Real estate brokerage Redfin identifies the top ten American cities in terms of inflow and outflow, according to Q3 data.

Interestingly, a quarter of people appear to be searching for homes in cities different from where they currently live. Also compelling: one state, per the brokerage’s data ending in the month of October, is a clear favorite.

Obviously, this is important data for operators to have. When it comes to labor and guest pool changes, inflow and outflow information can be quite useful.

Top Inflow Cities: August to October 2022

Review the list below to see the metro areas experiencing the greatest inflow.

  1. Orlando, Florida
  2. Dallas, Texas
  3. North Port, Florida
  4. Cape Coral, Florida
  5. Phoenix, Arizona
  6. Tampa, Florida
  7. San Diego, California
  8. Miami, Florida
  9. Las Vegas, Nevada
  10. Sacramento, California

Did you spot the big trend? The state of Florida represents 50 percent of the list. Per Redfin‘s interpretation of the data, home buyers want leave expensive coastal cities behind.

Interesting to us in particular, two cities—Las Vegas and Orlando—are key KRG Hospitality markets. Also interesting is that Nevada and Florida are on the back half of Forbes’ best cities for starting a business in 2023.

However, we’ve seen strong hospitality industry recovery in Las Vegas this year. In fact, even the entertainment industry in Las Vegas is exploding. Additionally, we continue to gain clients in Orlando.

Top Outlow Cities: August to October 2022

Below are the metro areas seeing the greatest outflow.

  1. Philadelphia, Pennsylvania
  2. Seattle, Washington
  3. Denver, Colorado
  4. Detroit, Michigan
  5. Chicago, Illinois
  6. Boston, Massachusetts
  7. Washington, DC
  8. New York, New York
  9. Los Angeles, California
  10. San Francisco, California

If we compare Redfin’s Q2 data to the list above, it’s mostly the same. In fact, the top four outflow cities are identical. Spots five through nine are simply a reshuffling of Q2 and Q3 data.

However, Minneapolis, number ten in Q2, is replaced by Philadelphia in Q3. According to Redfin data, those Philly residents searching for homes elsewhere are showing interest in Salisbury, Maryland.

Consider how expensive it can be to move to and live in LA and San Francisco. It makes sense that California is the only state with two cities on the list above, doesn’t it?

Per Redfin, San Francisco residents are searching Sacramento and Seattle. Those in LA are looking at San Diego and Las Vegas.

Takeaway

It’s important to know where people are moving to and what cities they’re leaving behind. And it’s interesting to get a data-driven view of which states may be best for starting a business.

However, it’s far more useful to know how feasible a given ZIP code may be for a specific concept. So, while these types of lists are helpful, they’re not as practical as a targeted feasibility study.

Moreover, the dust doesn’t appear to have settled when it comes to migratory patterns of home buyers. It’s quite possible that Redfin’s 2023 inflow and outflow data will change once again in Q1 and Q2.

Image: Stephen Leonardi on Unsplash

by David Klemt David Klemt No Comments

Are You Surveying Your Team?

Are You Surveying Your Team?

by David Klemt

Interesting "Information" typography

Successful recruitment is only one element of overcoming the current labor shortage—retention is another crucial element.

In fact, employee turnover can be incredibly costly. According to the Center for Hospitality Research at Cornell, employee turnover costs nearly $6,000 per hourly team member.

Now, consider what it costs to hire a single employee. On average, it costs $3,500 to hire that worker in the first place. So, the math is simple: Losing an employee costs an operator more than hiring one.

Unsurprisingly, turnover cost more than doubles—nearly $14,000—for a restaurant manager. In short, employee retention is arguably more important than recruitment and hiring.

Labor Shortage

Per Datassential, 33 percent of 801 survey respondents say the labor shortage is their greatest challenge in 2022. More than 70 percent of those respondents are independent operators.

However, independent, chain, and franchise operators appear to agree on one particular element of the challenge. Across segments, hiring hourly back-of-house employees is the most difficult.

In fact, Datassential’s latest FoodBytes report states that restaurants are coming up short in the kitchen. Two-thirds of restaurants are struggling to fill open hourly cook positions.

So, what’s the solution? Higher starting wages? Bonuses for remaining in role for 90 days? Benefits like health insurance and a 401K?

Each of those does work—for recruitment and hiring. What keeps a new hire from leaving after 90 days with their bonus cash, heading down the road to the next restaurant or bar?

It’s commonly agreed that the first 90 days of a new hire’s employment are the most crucial. Wages and benefits keep them in role for roughly three months. During that time, they’re deciding if their role and the employer’s culture are for them.

Employee Engagement

If you’re an owner, operator, or member of the leadership team, you know the importance of data. In fact, you should be obsessed with data collection and analysis.

Truly, the best way to make decisions that will impact the business is with information. Guesswork just doesn’t cut it. Yes, you should pay close attention to your “gut.” However, you should avoid acting on gut instincts before analysing the relevant data.

Wisely, many operators encourage their guests to complete satisfaction surveys. After all, their feedback is crucial to the success of any business. But what about employee surveys? Your team is equally as important as your guests.

Unhappy team members, unhappy guests. Unhappy guests, reduction in traffic. Team members fleeing your business? Your guests pick up on turnover. Eventually, you won’t have a business.

Now, you can assume your team is happy. You can feel like your leadership team is ensuring employee satisfaction and engagement. Or, you can know.

How do you know? You ask.

Satisfaction Surveys

Call it a satisfaction survey, call it a happiness survey… Either way, you’re asking your team members how happy they are with you and their role.

Operators will likely want to keep these surveys anonymous. Several sources that address employee surveys claim most employees prefer anonymity. Unfortunately, this is due to a fear of retribution from ownership or the leadership team.

Even with a healthy workplace culture, anonymity is probably the best for these surveys. Of course, if you’re implementing a 90-day happiness survey for new hires, anonymity doesn’t make much sense.

As far as company-wide survey frequency, there are several options. Once per year is obviously the bare minimum. Therefore, it’s not very effective. Every six months is better but is checking in on your team’s happiness twice per year enough?

The sweet spot appears to be quarterly surveys. More than that—monthly or bi-monthly—will likely get annoying.

Survey Questions

Below are a few questions to consider for your surveys. You’ll have to decide if you want to use multiple-choice, yes or no, matrix, or open-ended questions, or a mix of each type.

Another consideration is how your team will access the survey. The process needs to be as painless as possible. So, consider pushing a link via your scheduling platform, text, or QR code.

  • How happy are you working here?
  • How happy are you in your current role?
  • Would you recommend us to friends and family as a good place to work?
  • Does the leadership team make you feel valuable?
  • Do you see yourself working here a year from now?
  • Are we helping you succeed in your role?
  • Are we giving you what you need to progress in your career?

Image: Roman Kraft on Unsplash

Top