Canadian Trends 2022: Technomic
by David Klemt

Curious about what to expect in 2022 as a Canadian restaurant, bar or hotel operator?
Technomic has some predictions for next year.
Reviewing their “Canadian Trends: Looking Ahead to 2022” report, creativity and streamlining will be keys to success.
Let’s jump in!
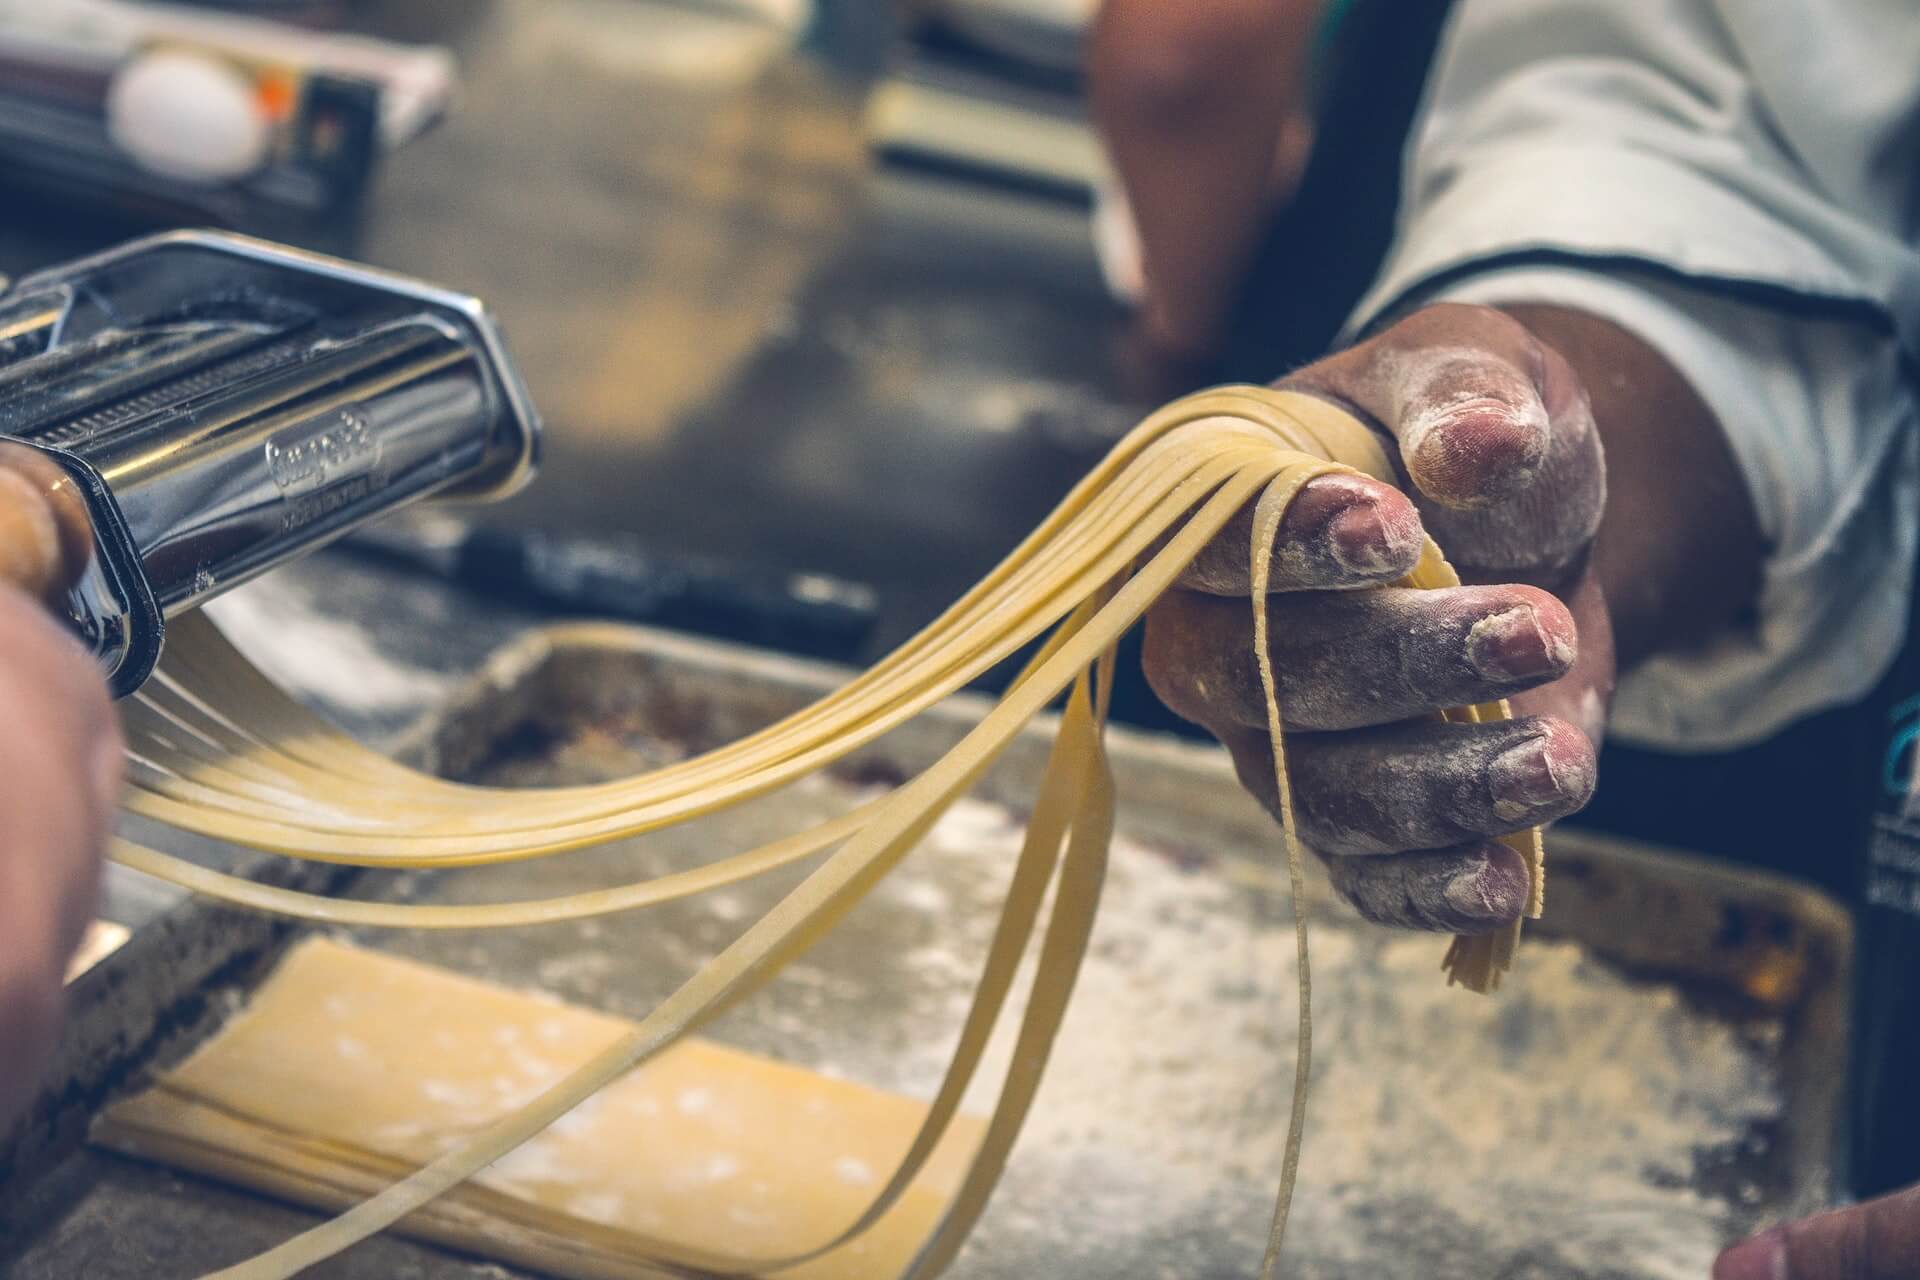
Butter
Yes, this is why I chose the image above. Technomic is very specifically identifying butter as an important 2022 F&B trend.
And no, they don’t appear to be predicting the popularity a particularly rare or esoteric butter. The industry intelligence firm means butter will prove important in 2022.
In large part, Technomic is pointing to comfort food as a driver for butter.
Generally, the firm points to how versatile butter is in the kitchen. Browned and herb-infused butters, says Technomic, will find its way into cocktails.
Flavor and texture will play an important role, extending the butter prediction into buttery foods territory. For example, Technomic predicts butterscotch, buttermilk and ghee will see a boost in usage and demand.
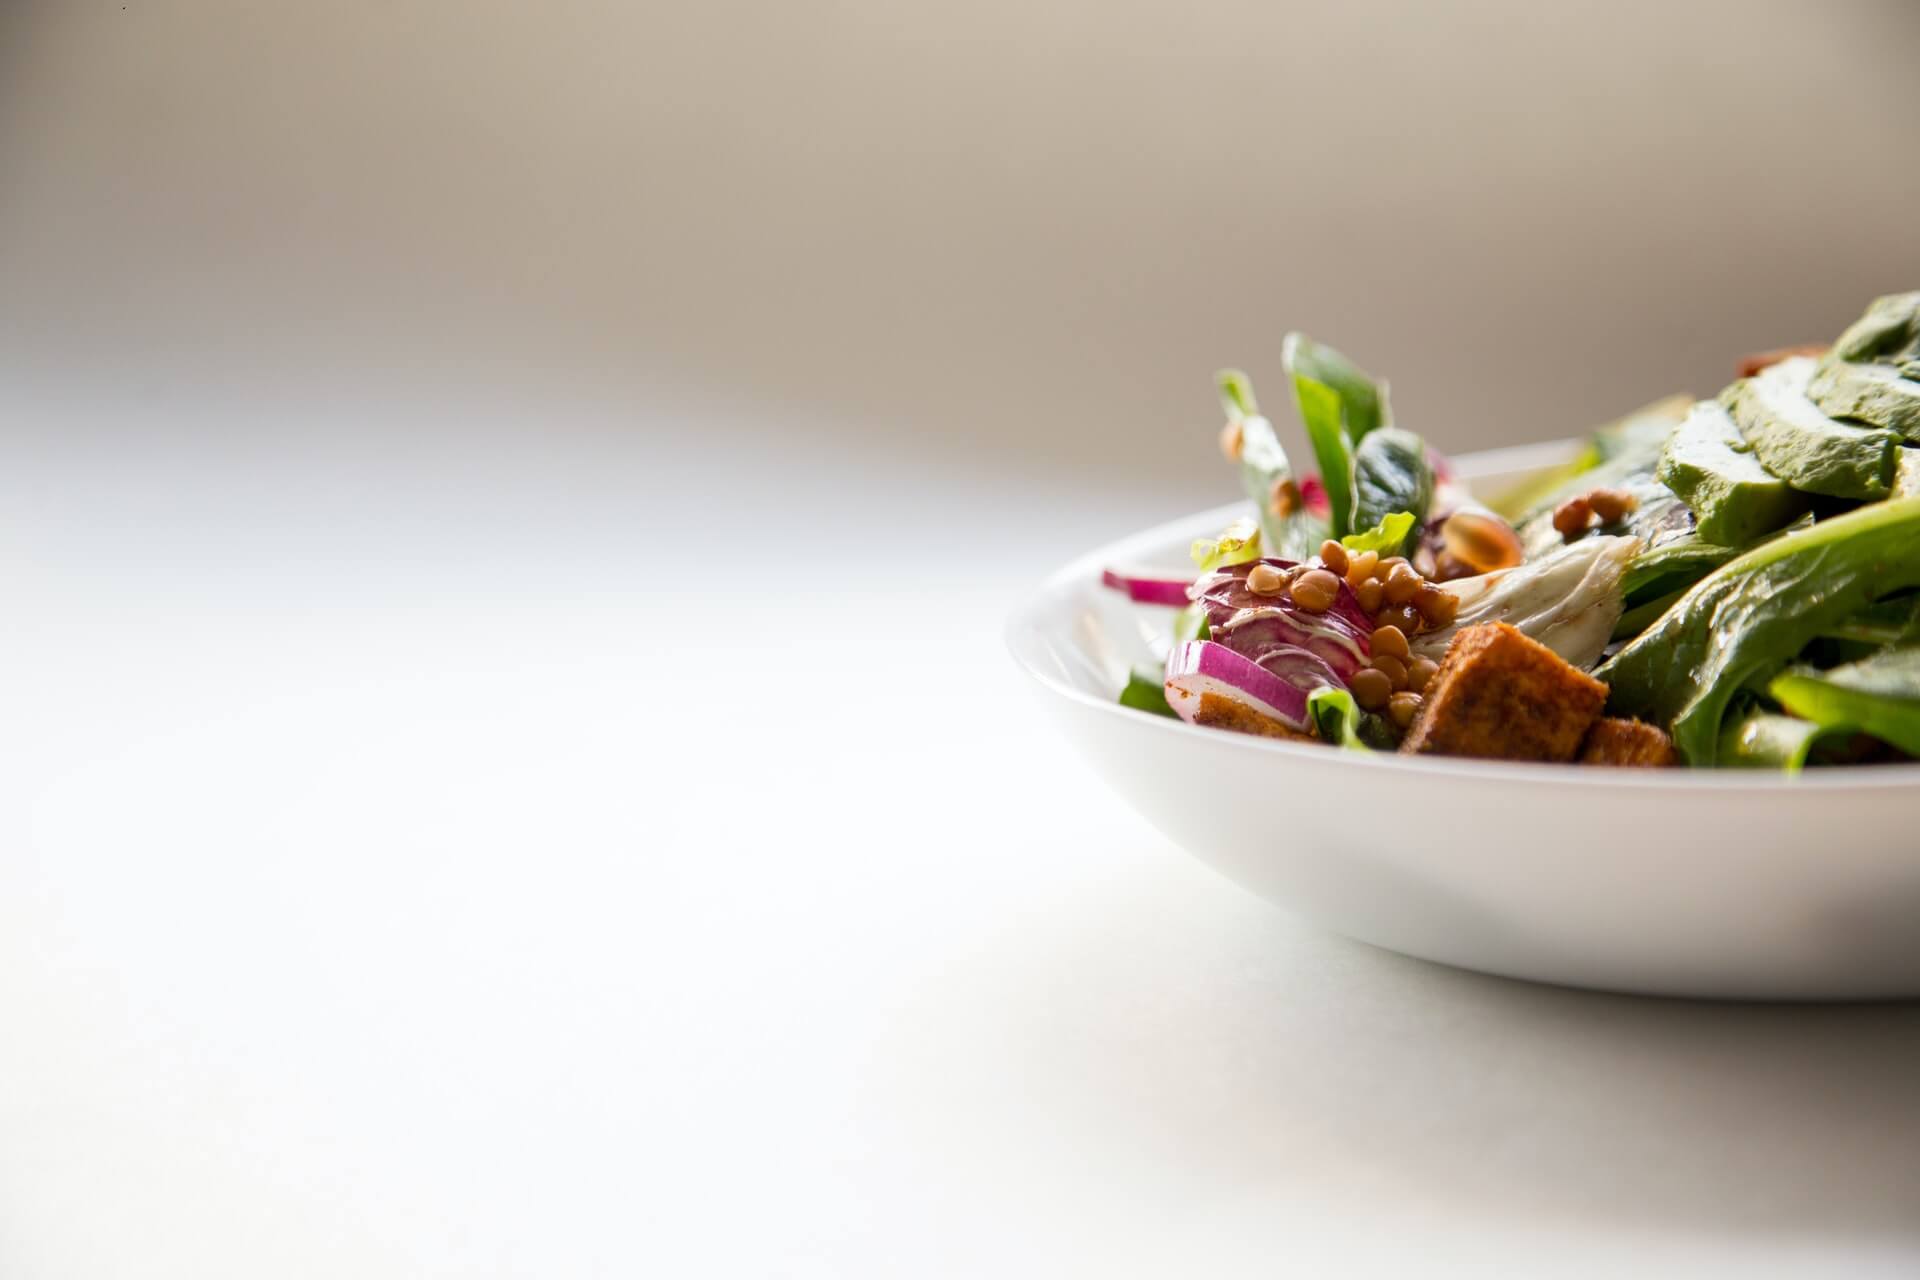
Additionally, the plant-based movement will help nut butters grow more popular. In fact, Technomic says nut butters will find their ways onto burgers and into cocktails.
Interestingly, the firm’s butter prediction gives operators two larger trends to watch: comfort food and plant-based.
Cross-utilization
You don’t need me to tell you that North America—and the rest of the world—is facing supply chain issues.
I know you’re exhausted from just the past nearly two years of constant adaptation and pivoting. In 2022, you’ll have to continue with your creative problem solving.
The supply chain challenge (there’s an understatement) requires creativity in several areas. This includes the kitchen and menu.
Technomic suggests that one path forward through supply chain problems involves ingredient preparations:
- Pickling
- Candying
- Salt-baking
The firm says these creative takes on ingredients operators already have will extend product life; add new flavors to dishes; and deliver new textures. Those last two offer guests new experiences.
In addition, getting creative with the ingredients you may be able to get more readily will help streamline and update 2022 menus. However, revising your menu will require careful consideration of your supply chain and cross-utilization, with a heavy helping of creative prep.
Running Lean
Smaller footprints. Shrunken staff. Streamlined menus. Smaller, shrunken, streamlined, optimized, leaner…
Call the process whatever you want, Technomic is predicting that operators will need to “optimize” (read: make smaller) their businesses.
Of course, there isn’t a one-size-fits-all solution. We’ve read and heard predictions since last year about what will need to shrink moving forward.
While some recent news reports say that ghost kitchens are out, Technomic seems to think that’s not the case. Technomic suggests ghost kitchens will remain viable for operators who want to expand without investing in real estate.
Additionally, Technomic’s report suggests something that should come as no surprise. In short, if it works for a brand or location, smaller may be better and here to stay.
Growth
Now, this is the most promising of Technomic’s predictions: Growth.
Per the firm, the foodservice industry in Canada was down 29 percent in Q1 of 2021. Pre-pandemic, sales reached $95 billion. That represents a loss of nearly $30 billion.
However, there’s reason to be optimistic in 2022, according to Technomic.
The firm expects growth of 21 percent in 2022 over 2021, or sales of $74.8 billion. Should this prediction prove accurate, 2022 would close just three percent under pre-pandemic sales.
Technomic identifies full-service as the foodservice segment to experience the most growth next year at 26.2 percent. In comparison, the firm predicts limited-service to grow 7.3 percent.
Next year won’t be easy. 2022 won’t be a magical return to normalcy. But there is room for optimism if Technomic’s predictions are correct.