Stats

by David Klemt David Klemt No Comments

SevenRooms Drops Extensive 2024 Report

SevenRooms Drops Extensive 2024 Report

by David Klemt
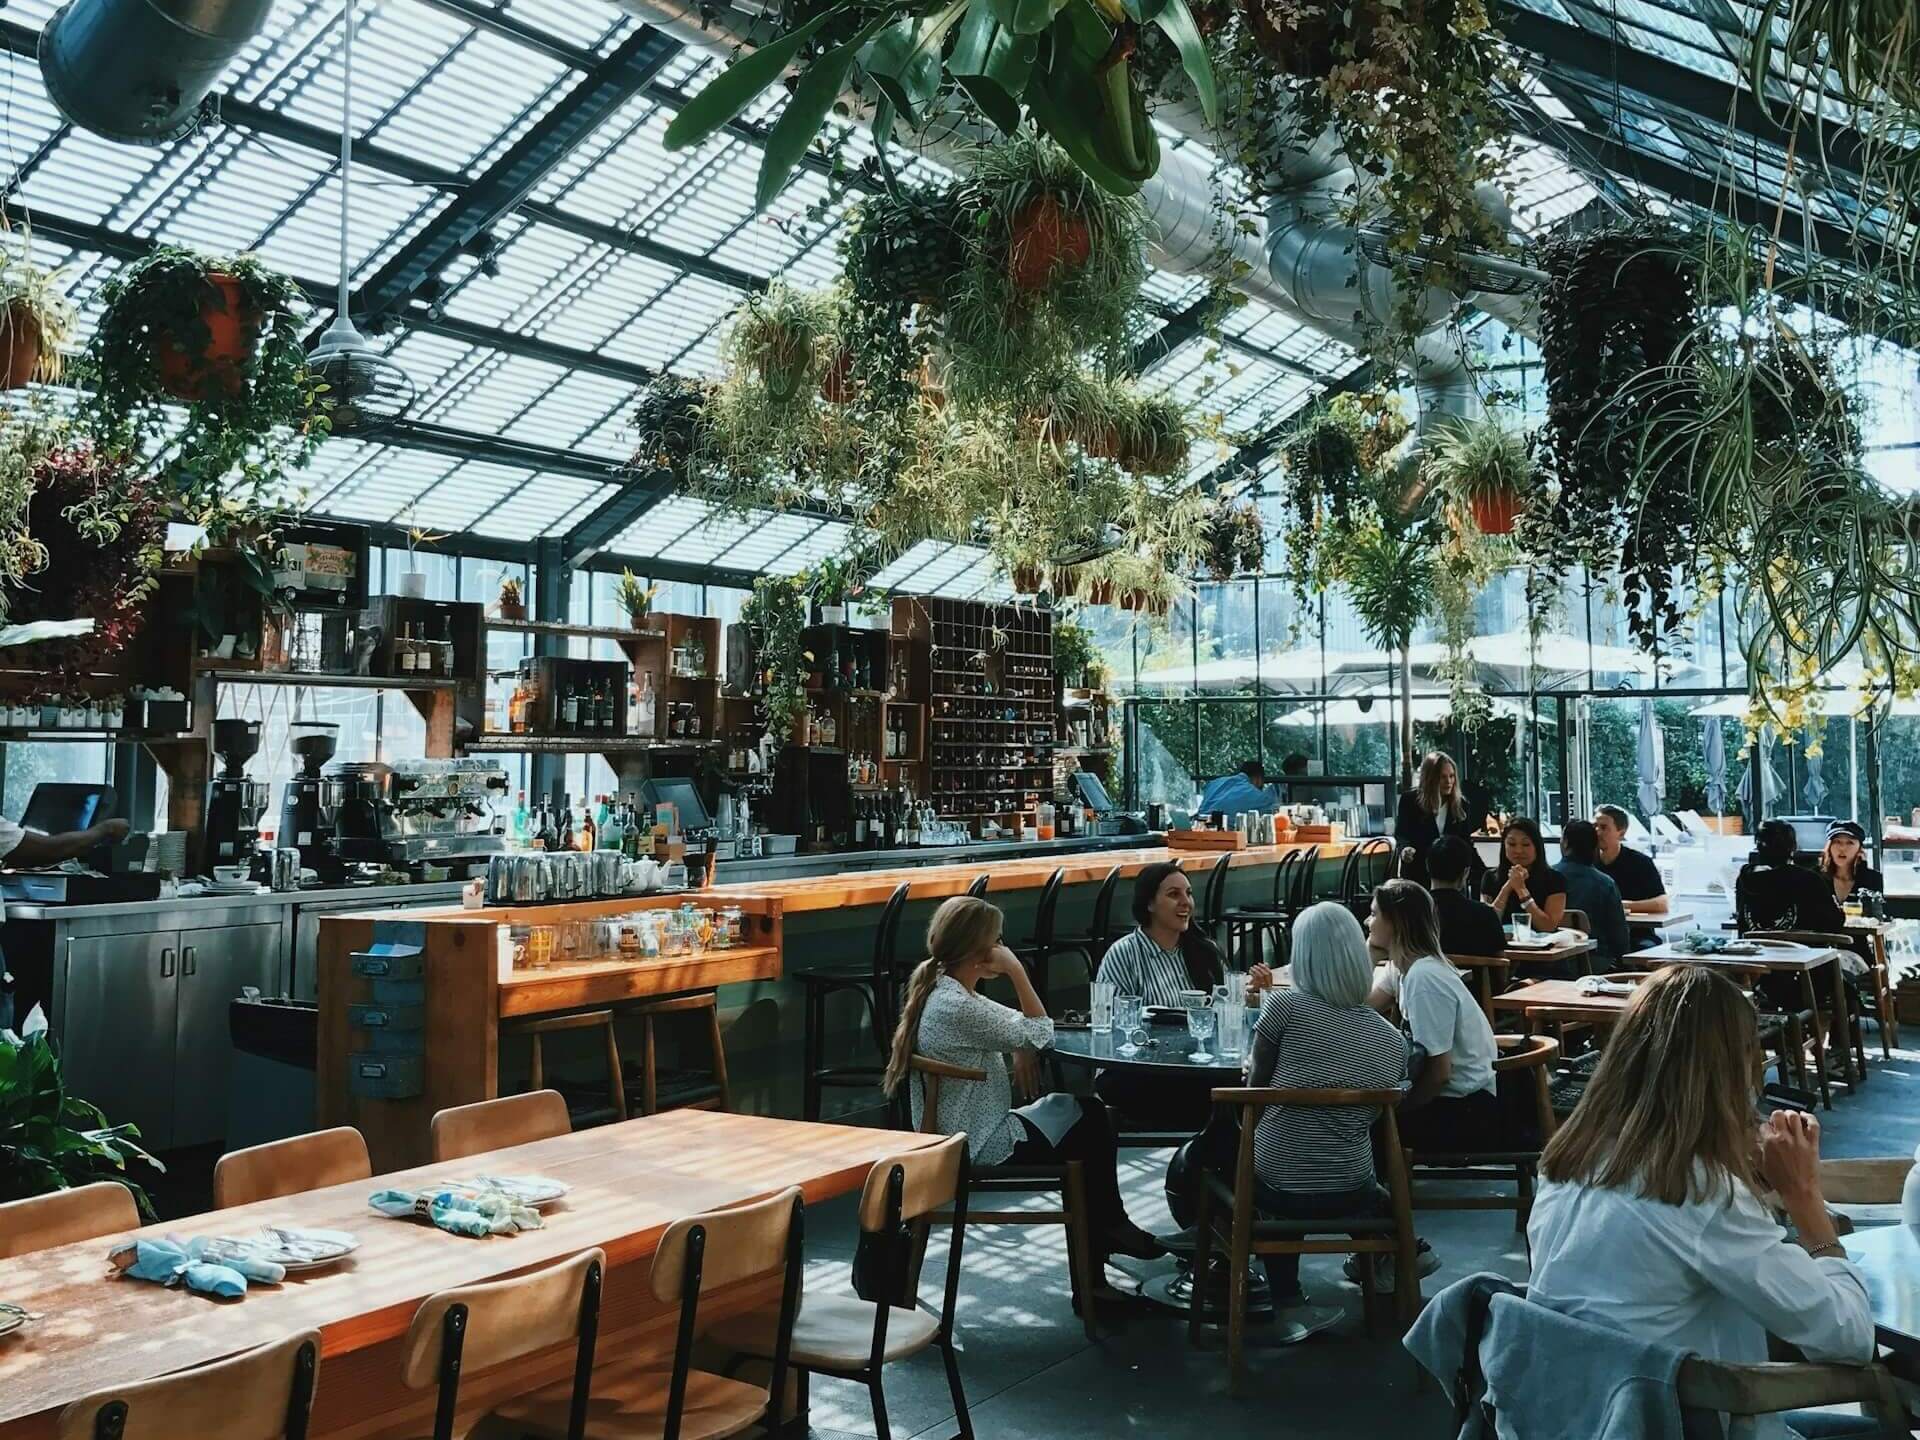
Guests dining in a light, bright restaurant featuring a glass ceiling and hanging plants

Today, we’re taking a look at the first-annual trends report from marketing and operations platform SevenRooms, which focuses on the guest experience.

To gain an understanding of the current state of affairs in America, SevenRooms analyzed the product data of more than 3,000 US clients. Further, the platform engaged over 250 operators, and 1,000 consumers.

The result is a data-rich report that offers helpful insights for operators.

Two findings are particularly interesting to me, and the team here at KRG Hospitality. One, it appears that Americans are back to seeking out their third spots. As a refresher, a third spot, space, or place is where one spends time when away from home or work. Consumers tend to be loyal to these places, making them part of their everyday or weekend routine.

Two, younger consumers are leading the way in terms of restaurant visits. Per SevenRooms, 38 percent of Millennials visit restaurants five or more times per month. Gen Z is also visiting restaurants frequently, with 24 percent visiting five times or more. However, that number climbs to 45 percent for Gen Z when it comes to three or four monthly visits. Among Millennials, 33 percent visit restaurants three or four times per month.

That tells us that younger consumers are eager to socialize, and restaurants can fulfill that desire. As savvy operators know, a person can eat or drink at home; food and beverages are just excuses to get out, hang out, and meet new people.

This also tells us that operators need to ensure they’re ticking several boxes to resonate with younger guests: value, convenience, and personalization. I’ll add that consumers have shown they want to support brands with values that align with their own.

There are many more insights in SevenRooms’ new report, which you can find below. To view the report in its entirety, click here.

SEVENROOMS RELEASES 2024 RESTAURANT TRENDS AND DINER EXPECTATIONS REPORT FOR THE HOSPITALITY INDUSTRY

Annual report gives an inside look at how restaurants are delivering better guest experiences and personalizing their marketing in the age of AI and automation

NEW YORK (August 6, 2024) – SevenRooms, the leading CRM, marketing and operations platform for growing restaurants, today released its first annual trends report, “2024 Restaurant Trends and Diner Expectations, highlighting how restaurants are filling the need for ‘third places’, connection spots outside the home and workplace, what consumers expect from their dining experiences, and how restaurants are leveraging AI and automation to keep diners coming back.

The study, commissioned through independent third-party research firm Censuswide, examines consumer and foodservice operator insights, alongside data from SevenRooms restaurant customers. It emphasizes the importance of restaurants understanding their guests and providing experiences and value to consumers, including marketing and tech trends that operators are paying attention to.

Diners Expect More From Restaurants

While it’s no surprise that diner expectations have evolved in recent years, consumers across generations and cities share key expectations when dining out — they’re looking for convenience, personalization and value from brands they trust. Restaurants must nail all aspects of the guest experience, from hospitality and service to ambiance and atmosphere, to transform diners into brand ambassadors and get them to bring their dollars back more often.

When looking across generations, Millennials are driving a dining resurgence – dining out most frequently with 38% saying they dine out more than 5x a month. They are seeking more from their restaurant visits, and are willing to spend more for elevated experiences, like theatrical elements or high-end items like caviar. For these experiences, Americans are willing to spend up to $63 per person with 45% of Gen Zers open to paying even more. As diners focus on the quality over quantity of their experiences, that means restaurants must do more to keep those diner dollars. Dining upgrades consumers are willing to spend more fall into three categories – experiential, luxurious and personal, including:

  • Experiential (e.g. tableside martini cart; fish presentation or deboning, etc.)
    Dallas – a menu item with some theater (86%)
    Washington DC – a menu item with some theater (71%)
  • Personal (e.g. birthday dessert; welcome drink)
    Chicago – a mocktail or personalized item (55%)
  • Luxurious (e.g. caviar, freshly shaved truffles, seafood tower)
    Los Angeles – high-end items like caviar (55%)
    New York – high-end items like caviar (48%)

Outside of these experiential offerings, restaurants must also capitalize on influential factors that bring diners back. For example, 34% of Gen Zers want personalized surprises in service like a free dessert. Meanwhile, 26% of Millennials care about the ease of making a reservation and 24% of Gen Xers consider the rapport they develop with front-of-house staff. Tailoring guest experience and service helps operators turn one-time diners into loyal customers.

“New consumer demands are pushing restaurants to find the right balance between hospitality and automation to create the experiences guests crave and return for,” said Joel Montaniel, CEO & Co-Founder at SevenRooms. “Diners want both access and recognition when spending their hard-earned dollars, and restaurants must embrace new strategies – and technologies like AI and automation – to enhance hospitality at every touch point. Whether leveraging platform data to personalize diner experiences or power marketing and retention programs, technology and data serve as a vehicle to execute hospitality that guests remember and return for. When technology is used effectively, it allows operators to focus on building deeper connections and delighting guests, one experience at a time.”

Loyalty is Never One-Size-Fits-All

In the U.S., there was a 21% year-over-year increase in reservations comparing Q1 2023 to Q1 2024 and restaurants are looking to a promising future. Whether operators are focused on opening new locations or revamping their social media marketing efforts, one factor remains the same – establishing personal relationships with diners is the strongest way to build and maintain loyal customers.

Consumers have a strong intent to dine with their favorite brands. If a guest can’t get a reservation at their preferred restaurant, 39% of guests look for a sister restaurant to dine at, and 27% check other sites for the same restaurant.

Cultivating loyalty is critical. Loyalty is not a one-size-fits-all effort and diners have different interests when it comes to the benefits they seek out from loyalty programs. Restaurants need to understand their diner demographics to curate operations and offerings, getting their guests to not only return more often but spend more in the process.

38% of diners who would spend $89-$126 on an average night are looking for exclusive VIP events, while 33% of consumers who dine out 7-8 times per month want VIP access to specialty seating areas. Breaking down generational differences:

  • 72% of Gen Zers care most about free menu items
  • 30% of Millennials care most about VIP access to specialty dining areas
  • 1 in 5 Gen Xers and Baby Boomers want early access to reservations

Genuine, Tailored Marketing is Critical to Success

When it comes to marketing, authenticity and personalization reign supreme for consumers. Guests want to be known by their favorite restaurants, and restaurants want to know and understand their guests. To reach these consumers, and serve up personalized marketing that makes guests want to return, restaurants have to use all the tools in their arsenal – from social media to email and text marketing automation – to create high-touch communications that are both authentic and personal.

79% of restaurant operators spend the majority of their marketing budget on social media. Their top social media goals are to drive bookings or online orders (39%), increase brand awareness (29%) and communicate with their audiences (29%). But not all content is created equal – 39% of operators say that organic posts drive the most bookings to their restaurants. Restaurants that showcase their personality – highlighting their team, food and drinks and atmosphere – will win with consumers as they look for more genuine content from brands.

Most diners like hearing about restaurant promotions and offers via email and text, and aren’t as interested in social media DMs or phone calls, but specific preferences vary by generation. 41% of Gen Zers prefer text marketing, whereas 38% of Millennials and 37% of Gen X prefer email marketing.

With targeted Email Marketing, the data report notes that operators see 23% higher open rates and 28% higher click-to-open rates, generating 2x more revenue per email. Text marketing is fairly new for restaurants, but has huge potential, with an average open rate of 98% and $1.64 average reservation revenue generated per text message on SevenRooms. For one SevenRooms customer, Fabio Viviani Hospitality, it drove $220,000 in revenue and 3,000 new guests in just 4 months.

“The biggest thing that excites me about text messaging is that it’s very hard to ignore. When our phones beep, we are just driven to look at them,” said Harry Kaminski, CMO at Fabio Viviani Hospitality. “It’s easier to ignore an email than it is a text.”

Artificial Intelligence (AI) Comes into Play

Every industry today is using AI and automation in some way to streamline their operations and help staff work more efficiently – and the same is true for the restaurant industry. 70% of operators surveyed said they use artificial intelligence in some way to run their business, including:

  • 35% – Processing reservations
  • 34% – Inventory management
  • 33% – Data analytics
  • 27% – Scheduling
  • 26% – Dynamic pricing

But there is room to grow with AI, with only 16% saying they use it to create marketing collateral and 15% for staff hiring and training. With personalized marketing a large focus for operators in 2024 and beyond, as well as hiring and retaining staff to deliver on high-touch hospitality, operators have an opportunity to use AI more effectively.

“AI elevates our storytelling around data,” said Kelly MacPherson, Chief Supply Chain and Technology Officer at Union Square Hospitality Group. “We have a wealth of data at our fingertips, but this can create analysis paralysis. With AI, we can more efficiently synthesize the data, create stories about what’s happening, why it’s happening, and what we can do about it, and then present these stories to our teams in a digestible format with actionable next steps.”

For more information about SevenRooms and to download the full report, please visit here.

About SevenRooms

SevenRooms is a CRM, marketing and operations platform for growing restaurants in the hospitality industry. From Michelin star gems to local favorites, the all-in-one platform helps restaurants increase sales, delight guests, and keep them coming back, automatically. The full suite of products includes reservations, waitlist and table management, review aggregation, referrals, email marketing, and marketing automation. Founded in 2011 and venture-backed by Amazon, Comcast Ventures and PSG, SevenRooms has more than 10,000 dining, hotel F&B, nightlife and entertainment clients globally, including: Marriott International, MGM Resorts International, Mandarin Oriental Hotel Group, Wynn Resorts, Jumeirah Group, Hard Rock Hotels & Resorts, Wolfgang Puck, Michael Mina, Bloomin’ Brands, Union Square Hospitality Group, Australian Venue Co., Maple & Ash, The Wolseley Hospitality Group, Dishoom, Groot Hospitality, MLSE, Live Nation and Topgolf.

Research Methodology

SevenRooms partnered with Censuswide Research – a third-party, professional research and consulting organization. Total sample size was 1,004 U.S. consumers. Fieldwork was undertaken between March 4-11, 2024. The survey was carried out online. The figures have been weighted and are representative of all U.S. adults (aged 16+).

SevenRooms partnered with Censuswide Research – a third-party, professional research and consulting organization. Total sample size was 251 U.S. operators (hospitality decision-makers). Fieldwork was undertaken between March 4-19, 2024. The survey was carried out online. The figures have been weighted and are representative of U.S. hospitality operators.

SevenRooms provided anonymized internal data representative of U.S.-based restaurants using the SevenRooms platform and surveyed a sample of operators at various restaurant sizes and types across the U.S. from March-May 2024.

Image: kayleigh harrington on Unsplash

KRG Hospitality Contact Request for Proposal 30 Minute Discovery Session

by David Klemt David Klemt No Comments

Top-performing Menu Items in the US

Top-performing Menu Items in the US (So Far)

by David Klemt

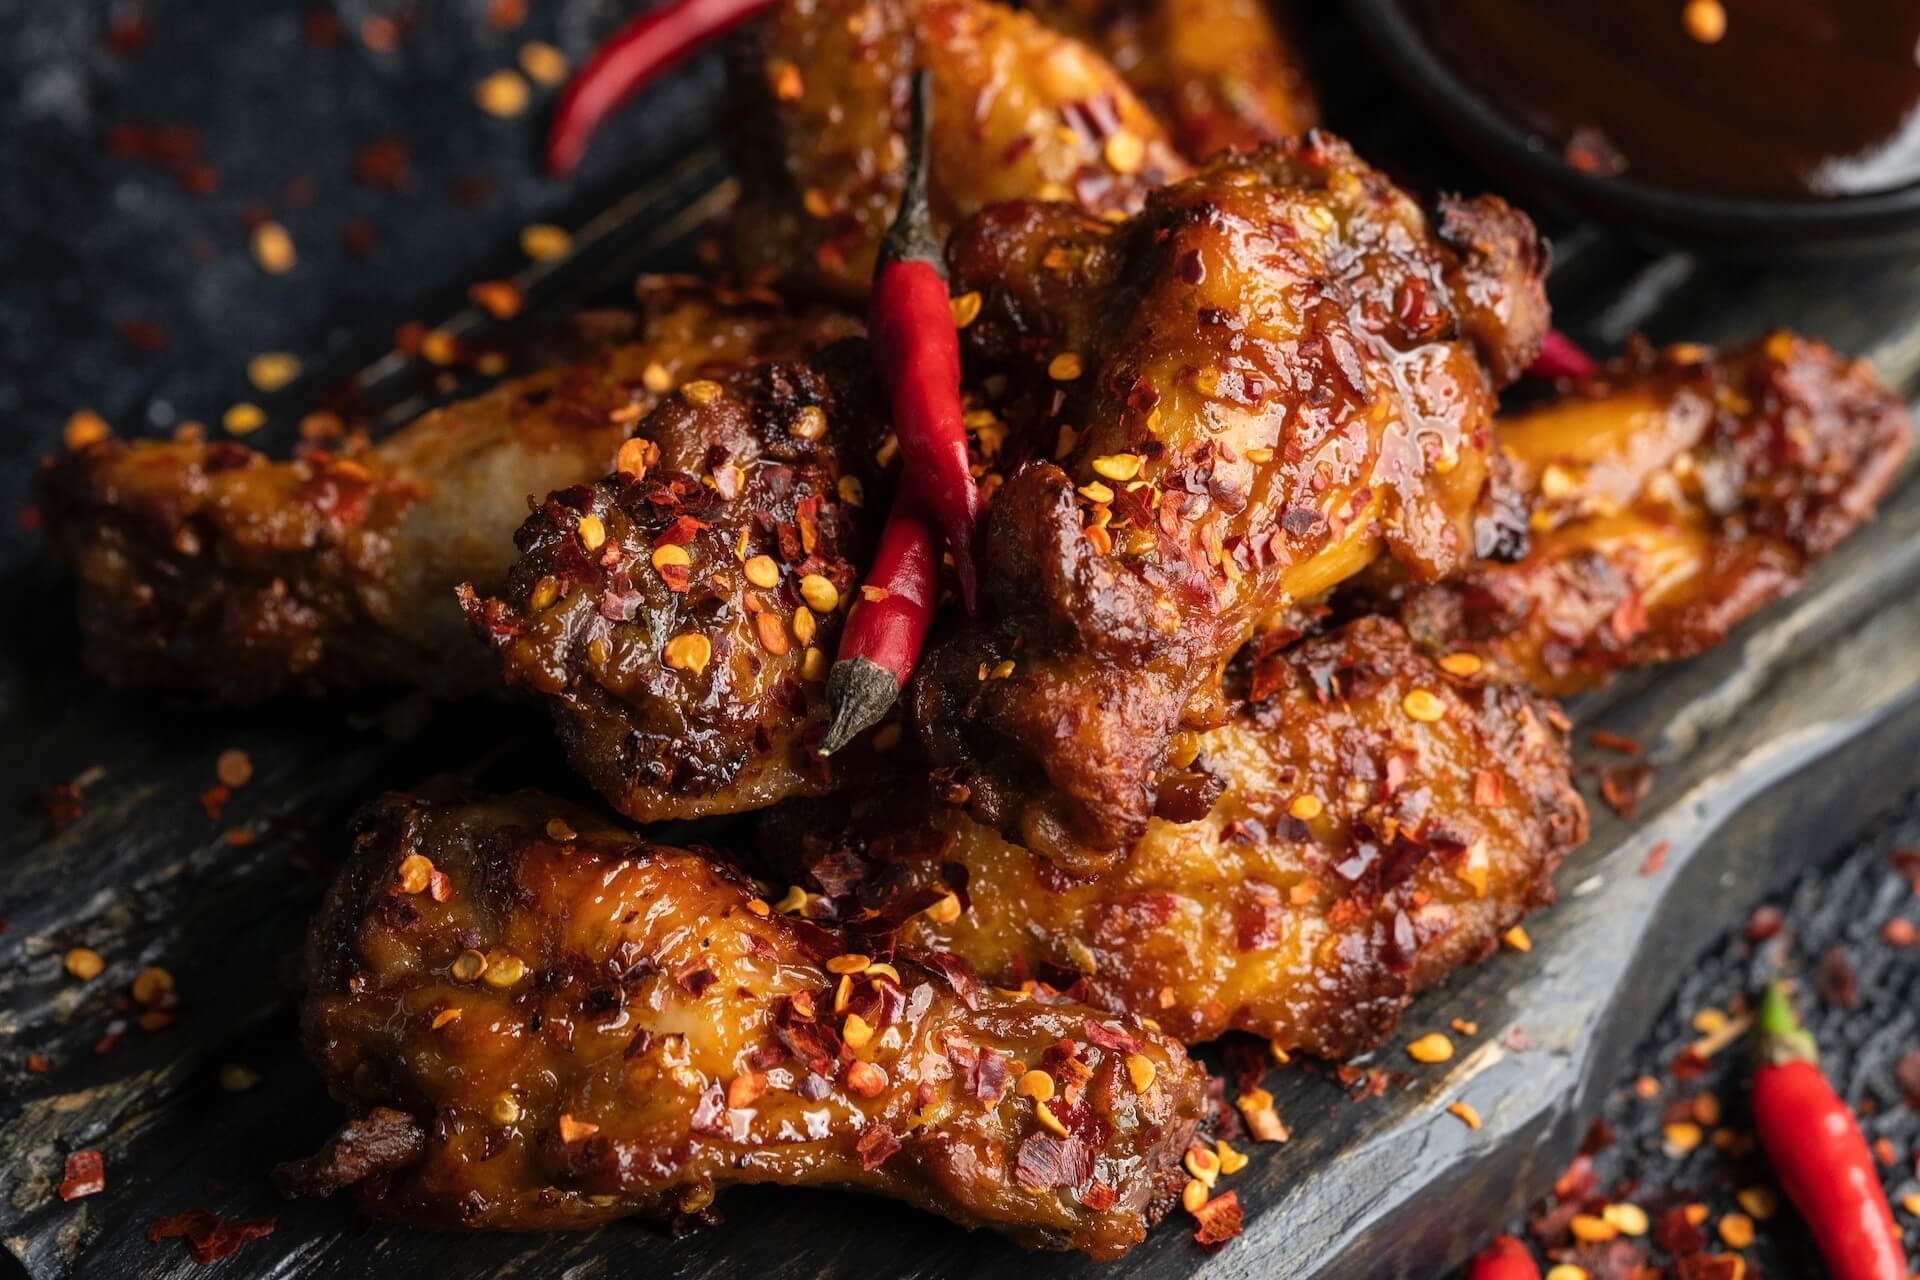
Barbecue chicken wings, chili peppers, and chili flakes

Thanks to a recent mid-year report from F&B intelligence platform Datassential, we now know the top-performing menu items in the US.

For the low, low price of filling out a handful of fields, you can download a copy of Datassential’s “Foodbytes: 2023 Midyear Trend Report” for yourself.

There’s plenty of useful data packed into this short report. You may find some of the top food items a bit surprising.

But First…

Datassential does more than just list the top mid-year menu performers in their latest report. There are also a couple of interesting datapoints for operators to consider.

The first piece of information is an alarming statistic: 54 percent of consumers are of the belief that “tipping culture has gotten out of control.”

As we’ve reported earlier, it’s likely that a major driver of “tip fatigue” comes from retail. The expectation for consumers to tip at a restaurant, bar or nightclub is ingrained deeply in American culture.

However, consumers throughout America are being prompted to tip after just about every transaction they’re attempting to complete. In fact, it’s not just retail that has been encouraging (in some cases, guilting) people to tip. Some contractors are also adding tip lines when handing over tablets to clients so they can pay their invoices.

One result is that servers and bartenders are reporting lower tips; guests are so over tipping that they’re pushing back against the practice in venues where they’d traditionally have no problem doing so.

Of course, tip fatigue isn’t the only reason consumers are pushing back against tipping. Many people feel that operators should increase what they pay staff. Indeed, some people feel that operators are asking them to subsidize their employee pay. Whether they’d be happy to pay higher prices remains to be seen.

Fads Aren’t Bad?

Whenever we cover trends or discuss them with clients, we caution against chasing too many (or the “wrong” trends). And fads? It can be even riskier to hop on the bandwagon of something that may never even reach the trend stage of its lifecycle.

However, likely due to the ubiquity of TikTok, consumers expect restaurants to embrace fads. According to Datassential, 67 percent of consumers overall “want to see more fads at restaurants and retail.”

That number jumps to 74 percent when focusing on Millennials and Gen Z.

So, while we still caution operators about jumping on fads (or “micro trends”) and trends, that doesn’t mean be too cautious. If a fad or trend works with your brand and won’t cost much to feature, at least give it consideration.

Not sure you’re great at identifying fads that will work for your business? Ask your staff which fads and trends are hot at the moment.

Speaking of Hot…

Alright, let’s take a look at the F&B items Datassential identifies as popular at the midway point of 2023.

Again, I encourage you to download the report in its entirety. You can do just that by clicking here.

But for those who want instant gratification, check out these menu items:

  • Super Duper: Let’s kick things off with the hottest chain LTO, the Denny’s Super Slam. Per Datassential, restaurant chains have already featured in excess of 2,000 LTOs in 2023. The F&B intel agency tests them all, and the Super Slam is wearing the LTO crown at the moment.
  • Chef Chatbot: Datassential tapped ChatGPT to create a burger recipe and had Midjourney create an image for the resulting Caprese Avocado Burger. More than half of consumers surveyed—57 percent—want to try it at a restaurant.
  • Big Winner: Datassential asked consumers a simple question: Which would you rather eat for the rest of your life, a hamburger or a hot dog? A staggering 87 percent chose hamburgers, meaning just 13 percent of consumers would choose a hot dog over it’s burger buddy.
  • What a Pickle: Back in March we checked out Slice’s Slice of the Union report, and it predicted pickle pizzas would be a hot trend this year. Well, Datassential has crunched the numbers and says 40 percent of consumers are aware of this pizza style already. Looks like Slice may be proven right by the end of the year.
  • Speed Demon: Curious about the fastest-growing menu item on the US? Well, wonder no more: Datassential says it’s the barbecue chicken wing. Over the past year, they’ve grown 373 percent on menus across the States. Datassential posits the overall growth of chicken and the embracing of flavor trends like Carolina gold barbecue sauce are contributing factors.

There’s a lot to unpack here, so I’ll leave you to it. Just remember that when it comes to fads and trends, there’s a fine line between what’s hot, what’s not, and jumping on the wrong one. Good luck!

Image: Ahmed Bhutta on Pexels

KRG Hospitality Start-Up Restaurant Bar Hotel Consulting Consultant Solutions Plans Services

by David Klemt David Klemt No Comments

iPourIt Releases Their 2023 Pour Report

iPourIt Releases Their 2023 Pour Report

by David Klemt

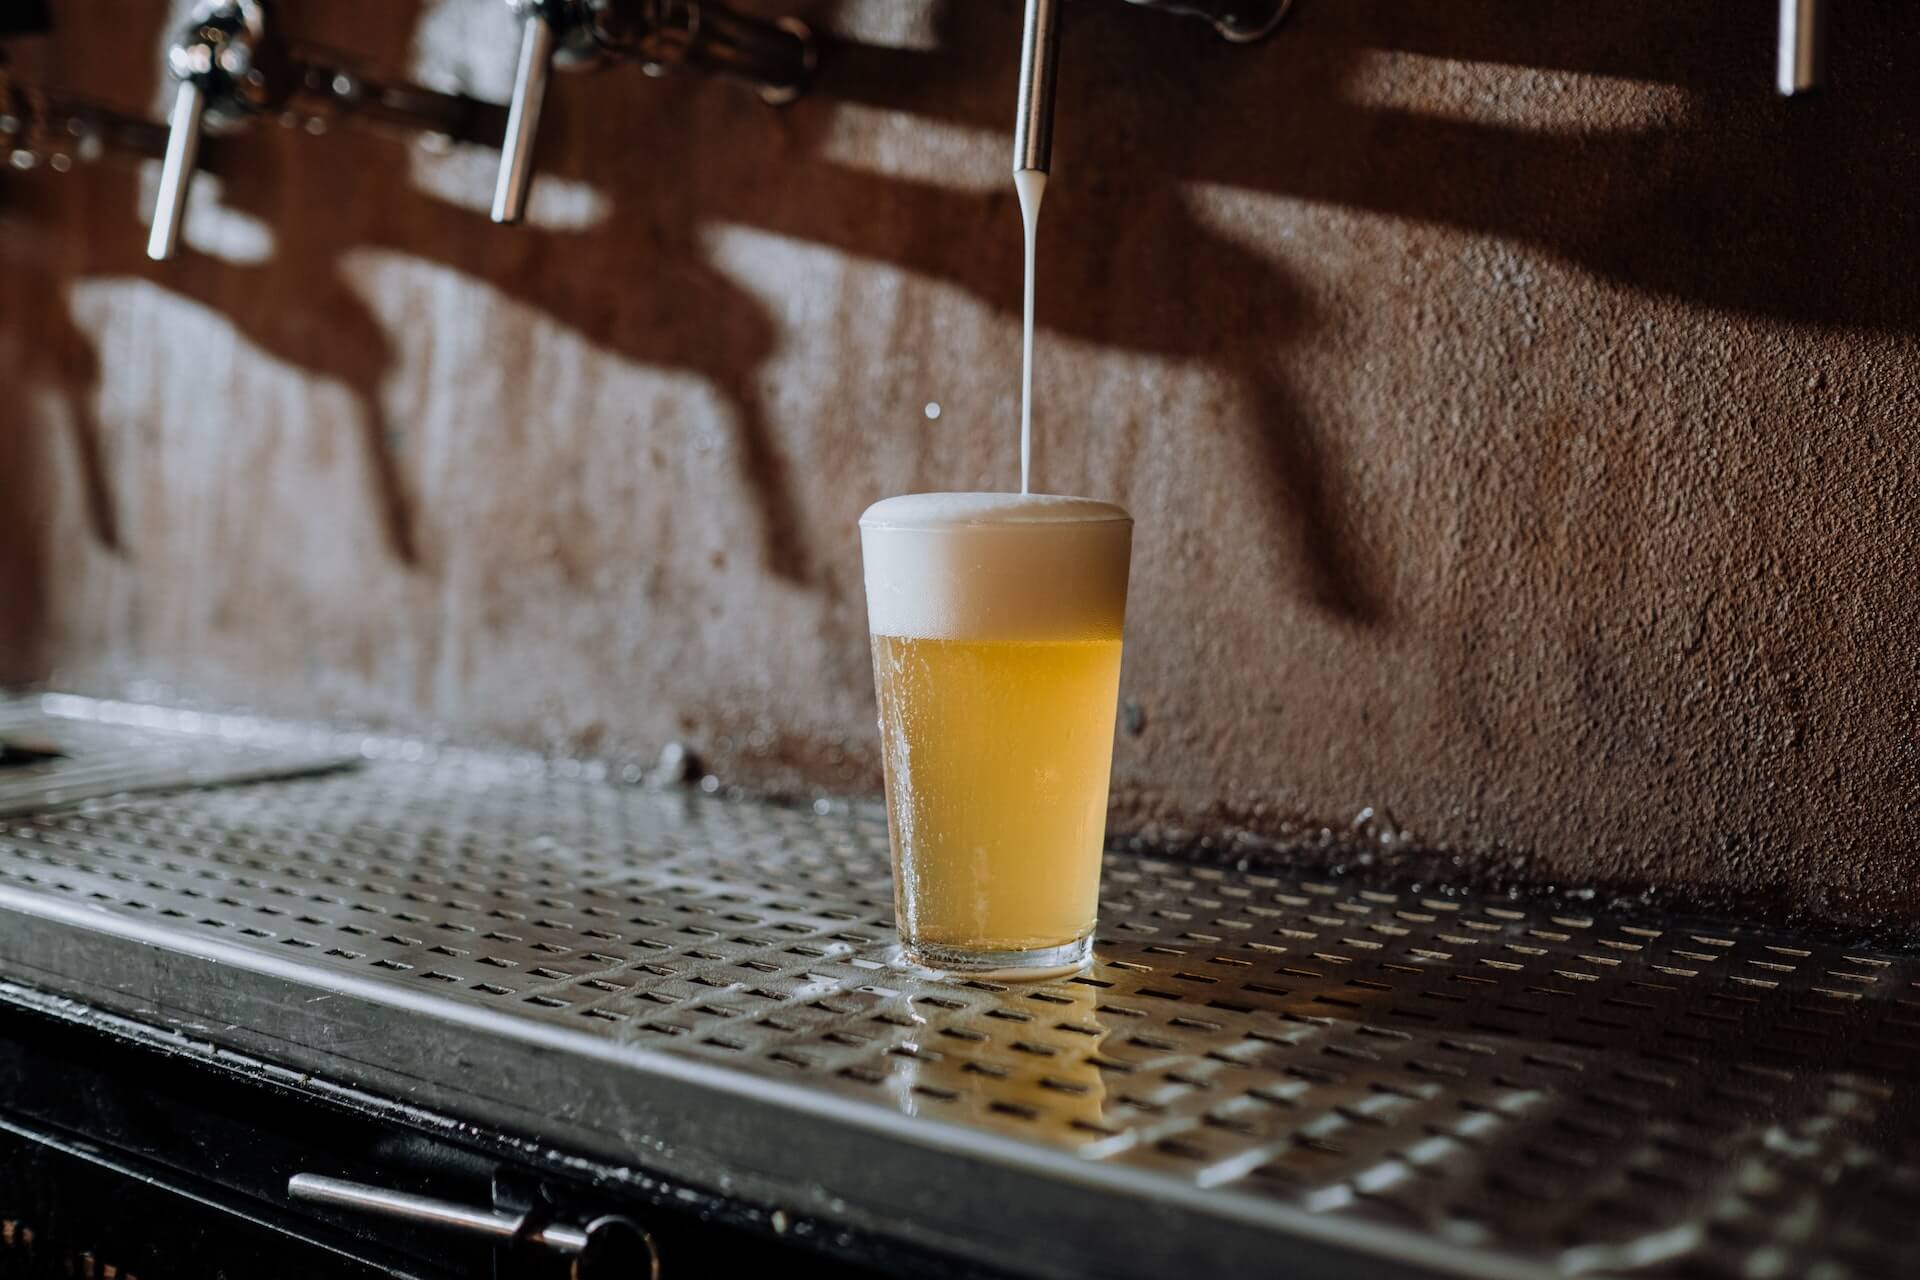
Beer pouring into glass from tap

Interactive self-serve beer experience platform iPourIt‘s latest report, the 2023 Pour Report, is now available for download and review.

iPourIt is a pioneer in the self-serve beverage space. While it may seem counter-intuitive to some, many guests have shown time and again that they enjoy using self-serve walls. For these guests, a not in any way insignificant number, iPourIt installations enhance the guest experience, increase loyalty, and boost revenue.

And while many people associate iPourIt and self-serve programs with beer, these systems can also pour wine, cocktails on tap, spirits, non-alcohol beverages, and soft drinks.


View this post on Instagram


A post shared by Matt Plapp (@mattplapp)

Another benefit from iPourIt? Transparency and sharing of data. The company doesn’t limit providing valuable guest behavior insight to their clients. Rather, they make the data they collect available to anyone. Simply head to their website, fill out a few fields, and gain important beverage insights.

Anyone curious can choose between a standard report and a “pro” version. Both are free to download and peruse. People can also read our article that dives into their fourth-annual report via this link.

Below you’ll find key takeaways from their 2023 report. I strongly urge operators to download and review either report.

The Who

We agree that demographics are a metric that people and businesses often misuse. Valuegraphics can be far more effective for businesses looking to build loyalty and boost revenue.

Still, demographics can provide beneficial insights.

First, let’s look at how men and women used iPourIt systems in 2022. Men poured 20,477,288 ounces last year, whereas women poured 10,848,435 ounces. The average per pour for men was 6.4 ounces in comparison to 5.3 ounces per pour from women. On average, men spent $14.72 per visit to an iPourIt-equipped location; women spent $12.24.

Next, the generational breakdown. IPA was the number-one style poured for Baby Boomers, Generation X, and Millennials. For legal-drinking-age Generation Z drinkers, IPA came in second; their top pour style was cider. Likewise, Lager claimed second place for Boomers, Gen X, and Millennials. Second was IPA for Gen Z, and Lager was third. Wheat beer was third place for Boomers, fourth for Gen X and Millennials, and fifth for Gen Z. Sour came in fifth for Gen X and Millennials fourth for Gen Z; for Boomers, the style didn’t rank among the top five. Stout clinched the fifth spot for Boomers.

Finally, in terms of traffic, men of every age group poured more ounces than their female counterparts.

The What

Below, the top 10 styles of beer poured by men:

  1. Fruit beer
  2. Pale Ale
  3. Blonde
  4. Pilsner
  5. Stout
  6. Sour
  7. Wheat beer
  8. Cider
  9. Lager
  10. IPA

In descending order, the top five (download the report for the top ten) products poured by men were Michelob Ultra, Bud Light, Golden Road Brewing Mango Cart, Coors Light, and Modelo Especial.

And now the top styles of beer or category of beverage poured by women:

  1. Stout
  2. Fruit beer
  3. Blonde
  4. White wine
  5. Hard seltzer
  6. Wheat beer
  7. Sour
  8. Lager
  9. IPA
  10. Cider

Also in descending order, the top products poured by women were Michelob Ultra, Mango Cart by Golden Road Brewing, Bud Light, Ace Pineapple Cider, and Coors Light.

The Where

The 2023 Pour Report by iPourIt breaks the US down into five regions: West, Southwest, Midwest, Southeast, and Northeast.

Because our American head office is in Las Vegas and our hotel consultant is in Pennsylvania, we’ll look at the West and Northeast.

The top-five pours for the West in 2022 were:

  1. Bud Light
  2. Firestone Walker Brewing Co. 805
  3. Golden Road Brewing Mango Cart
  4. Coors Light
  5. Modelo Especial

While the top-five pours in the Northeast were:

  1. Blue Moon Brewing Co. Belgian White
  2. Allagash Brewing Co. White
  3. Lord Hobo Brewing Co. Boom Sauce
  4. Sloop Brewing Co. Juice Bomb
  5. Stella Artois

For the curious, Bud Light and Coors Light are categorized as American-style Light Lagers, 805 is a Blonde Ale, Mango Cart is a Wheat Ale, and Modelo Especial is a Mexican-style Pilsner. Blue Moon and Allagash White are both Belgian-style wheat beers (or Witbiers), Boom Sauce is a Double IPA, Juice Bomb is a Northeastern IPA, and Stella Artois is a Lager.

For further insights, please download this year’s iPourIt report here.

Image: cottonbro studio on Pexels

KRG Hospitality Beverage Programming

by David Klemt David Klemt No Comments

Leverage These 3 Sports for Growth

Leverage These 3 Sports for Growth

by David Klemt

Daniel Ricciardo in McLaren F1 race car

Sports receive more than three million mentions daily on social media and in online communities, and three sports are driving conversations.

Media-monitoring and SaaS platform Meltwater‘s recent report shows growth in media mentions and community engagement. The report, “2023 Industry Snapshot: Sports,” also identifies three sports that are growing globally.

Most restaurant and bar concepts, at least throughout North America, can benefit from sports. They have televisions, at least decent audio, and the proper licenses to air sports and other programs.

At the risk of oversimplifying, that means that any bar or restaurant can be a sports bar. Before anyone begins furiously hammering out an email to send me, I’m not saying any bar or restaurant can automatically become a great sports bar because they have TVs. I’m simply saying that operators who want to leverage sports and specific sporting events are at a good starting point to do so.

With that caveat out of the way, let’s check out what Meltwater has uncovered regarding sports.

Sports Conversations

According to Meltwater, sports is a hot topic every day of the year. On average, there are 3.16 millions mentions of sports each day.

And that’s just on a “normal” day. Last year, that number jumped to well over 12 million mentions during the FIFA World Cup.

Meltwater identifies 2022 as a particularly strong year in terms of growth for sports conversations. That boost is expected to carry into 2023, providing savvy operators with opportunities to leverage sports.

Per Meltwater, sports social media handles, hashtags, and keywords have grown by more than 20 percent. That’s significant growth.

Now, let’s look at the sports driving much of that growth.

Football

When I say “football” in this context, I mean the sport some people call “soccer.” So, not American football, which Dave Grohl and Crown Royal pointed out is a Canadian invention during Super Bowl LVII.

For the past few decades (at least), much has been made of Americans maligning football (soccer). Well, all the tropes of that mockery may be wearing very thin.

Last year, mentions of football keywords were up 56 percent—in the US. The second-place country was Nigeria with an increase of 33 percent.

Globally, the sport’s online conversations went up by 32 percent. The day of the FIFA World Cup final? That number exploded to 630 percent. Could be smart for operators to begin planning their World Cup promotions soon.

Baseball

There are some interesting stats surrounding baseball and online conversations.

Last year, conversations of this sport grew by just three percent. And for a country that claims the sport as their national pastime, American baseball convos saw a notable dropoff: a decrease of 11 percent.

However, baseball grew by nine percent in Canada in 2022. Japan saw an increase of 36 percent, and Venezuela was up 22 percent.

Unsurprisingly, the sport’s two largest organizations dominate baseball conversations.

Leading the charge, Major League Baseball mentions grew by 16 percent in 2022 globally, and by 54 percent in Japan. Right on MLB’s heels, Nippon Professional Baseball 23 percent globally and 28 percent in the US.

For those who are curious, three teams stood out in the baseball conversation: the Los Angeles Dodgers (+59 percent), New York Yankees (+55 percent), and NY Mets (+46 percent). However, LA Angels pitcher Shohei Ohtani saw truly incredible growth with an increase of 74 percent.

An important takeaway: Baseball fans in America appear quite interested in watching (or listening to) NPB. That gives operators another organization—and all their scheduled games—to leverage.

Formula 1

Ah, my favorite sport. I’m happy (for the most part) to see this motorsport growing around the world. In fact, Formula 1 keyword mentions grew 13 percent globally, and #F1 was among the hashtags used most in 2022.

On July 3, 2022, Ferrari driver Carlos Sainz, Jr. (driver #55) won the British Grand Prix at Silverstone. Red Bull’s Sergio Perez (#11) took second and Mercedes’ Lewis Hamilton (#44) took third. And on this day the F1 conversation skyrocketed, growing by 338 percent.

The country leading the way for F1-related keyword mentions in 2022 was Japan, growing by a staggering 91 percent.

Much of the increase in interest in F1 can be traced back to Netflix and its Drive to Survive docu-series (some call it a reality-TV drama).

Looking at American interest in the sport, it helps that there are now three races on the calendar that take place in the US: the Miami Grand Prix, the US Grand Prix at Circuit of the Americas in Austin, TX, and the Las Vegas Grand Prix. That’s three opportunities (Miami has already happened) for American operators to take advantage of this sport’s growing popularity.

Last year, former Aston Martin driver Sebastian Vettel (#5), Red Bull driver Max Verstappen (current champion and #1), and Ferrari driver Charles Leclerc (#16) saw the most growth in terms of individual drivers.

I can only hope that my other favorite motorsport, MotoGP, starts to become more popular throughout North America.

Takeaways

Some operators may find that sports don’t work for their concept, such as a high-end cocktail bar or fine-dining restaurant. Those are two venue types that tend to eschew televisions as they don’t work with their vibe and aesthetic.

That said, each operator must choose how to best implement sports and related promotions. This includes understanding which sports, teams, and players their guests like. Then, of course, it’s also a matter of gauging interest.

With that determined, operators must also decide how to make sports work with their concept. Some things to consider are themed F&B menus, sports-related LTOs, FoH uniforms, and how far to go with promotions. That latter consideration will depend on how rabid a fan base each operator is targeting. A truly dedicated fan base encourages some bars to “officially” support a certain team.

Another important consideration? Will leveraging a particular sport or team alienate other guests due to rivalries or a lack of interest or comfort? Sometimes the cost of implementing promotions includes pushing away a percentage of guests on particular days.

Because I live in Las Vegas, I have an array of venues available to me around the clock. It’s conceivable that I could find a home bar or restaurant to watch F1 and MotoGP. Personally, the capability of comfortably watching my two favorite sports would boost my loyalty and visits. However, there may not be a large pool of people like me in this market. Would a bartender want to turn on an F1 race just for me?

There’s a lot to consider when choosing how to best leverage sports. The upsides include converting customers to loyal, repeat guests; a realistic idea of what to consider in terms of labor and inventory for specific days, weeks, months, and seasons; and boosts in traffic, revenue, and online engagement (which in turn can translate to more traffic and revenue).

Image: Photo by PRAT clement via Pexels

KRG Hospitality Sports & Entertainment, 2023 icon

by David Klemt David Klemt No Comments

F&B in Canada: Top Menu Items

F&B in Canada: Top Menu Items

by David Klemt

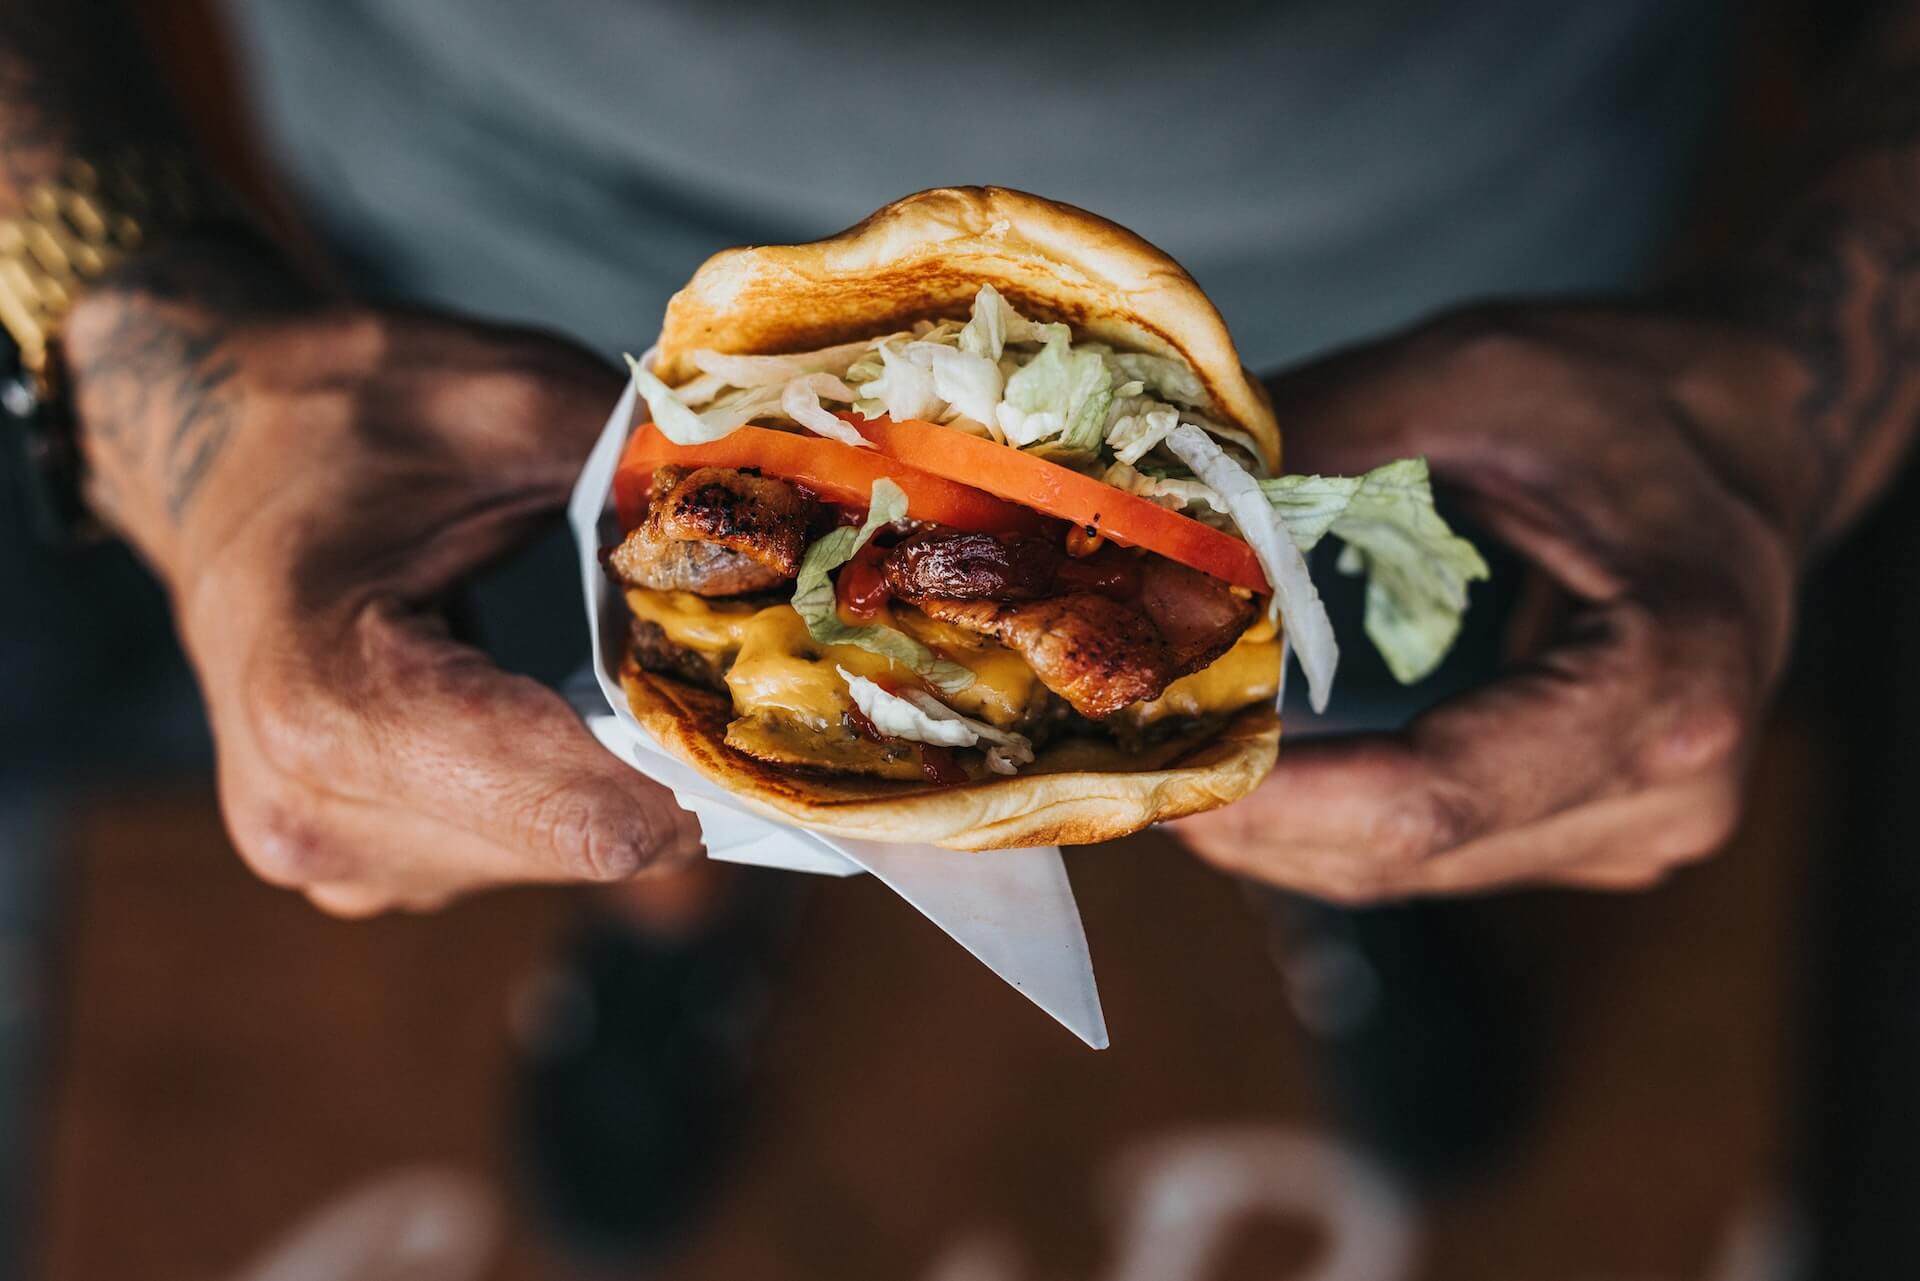
Closeup of hands holding burger

Those wondering what food and beverage menu items are performing best among consumers throughout Canada need wonder no more.

And why is that? Well, Restaurants Canada has the answers, revealing the top ten food and top ten beverage items.

Further, the organization compares each item’s performance. In this instance, Restaurants Canada analyses the percentage of orders that contained each food or beverage item from January to April 2022 in comparison to 2019.

These insights (and many more) are available in Restaurants Canada’s 2022 Foodservice Facts report. In fact, you can find our reviews of several of the restaurant advocacy group’s report topics via the links below:

For your own copy of this year’s Foodservice Facts report, click here.

Top 10 Canadian Drink Menu Trends

As you’ll see below, coffee is outperforming nearly every other beverage category. Specifically, Hot coffee is at the top, while Iced or frozen coffee is ranked third.

Unsurprisingly, Carbonated soft drinks / Pop / Soda split the two coffee categories. According to Restaurants Canada, the Carbonated soft drink category can credit its performance in large part to QSRs.

  1. Milk: 1.8% (2019) to 1.8% (2022)
  2. Iced tea: 2.9% (2019) to 1.6% (2022)
  3. Milkshakes / Smoothies: 2.1% (2019) to 2.0% (2022)
  4. Fruit juice: 3.8% (2019) to 3.0% (2022)
  5. Hot tea: 5.5% (2019) to 4.5% (2022)
  6. Alcohol beverages: 5.1% (2019) to 5.7% (2022)
  7. Water: 6.6% (2019) to 5.0% (2022)
  8. Iced or frozen coffee: 5.3% (2019) to 7.5% (2022)
  9. Carbonated soft drinks / Pop / Soda: 19.7% (2019) to 20.2% (2022)
  10. Hot coffee: 40.9% (2019) to 41.9% (2022)

Compellingly, Alcohol beverage performance in restaurants fluctuated by age group between 2021 and 2022. Alcohol order shares in restaurants, per Restaurants Canada:

  • Legal drinking Age (LDA) to 34: 46% (2021) to 43% (2022)
  • 35 to 49: 17% (2021) to 21% (2022)
  • 50-plus: 37% (2021) to 36% (2022)

Alcohol order shares in bars, according to Restaurants Canada:

  • LDA to 34: 35% (2021) to 35% (2022)
  • 35 to 49: 17% (2021) to 19% (2022)
  • 50-plus: 49% (2021) to 47% (2022)

Overall, the 35 to 49 age group appears to be consuming less alcohol in bars and restaurants in comparison to the LDA to 34 and 50-plus cohorts.

Top 10 Canadian Food Menu Trends

As Restaurants Canada notes, the Sandwich / Sub category has grown in 2022. Interestingly, the category just below it in growth, Chicken, is partially responsible for boosting Sandwich / Sub performance.

As far as entrees or “main attractions,” the Burger category remains at the top, beating out Breakfast, Sandwich / Sub, Chicken, and Pizza menu items.

  1. Cake / Squares / Muffins: 3.7% (2019) to 3.3% (2022)
  2. Salad: 4.3% (2019) to 3.8% (2022)
  3. Donuts / Beignets: 3.0% (2019) to 3.8% (2022)
  4. Breads: 4.3% (2019) to 3.4% (2022)
  5. Pizza / Panzerotti / Calzone: 4.1% (2019) to 4.3% (2022)
  6. Chicken: 7.6% (2019) to 8.5% (2022)
  7. Sandwich / Sub: 8.0% (2019) to 8.5% (2022)
  8. Breakfast: 10.8% (2019) to 11.4% (2022)
  9. Burger: 9.0% (2019) to 10.9% (2022)
  10. French fries / Potato / Sweet potato / Onion rings: 15.0% (2019) to 16.1% (2022)

Image: Nathan Dumlao on Unsplash

by David Klemt David Klemt No Comments

The Numbers on Food Delivery in Canada

The Numbers on Food Delivery in Canada

by David Klemt

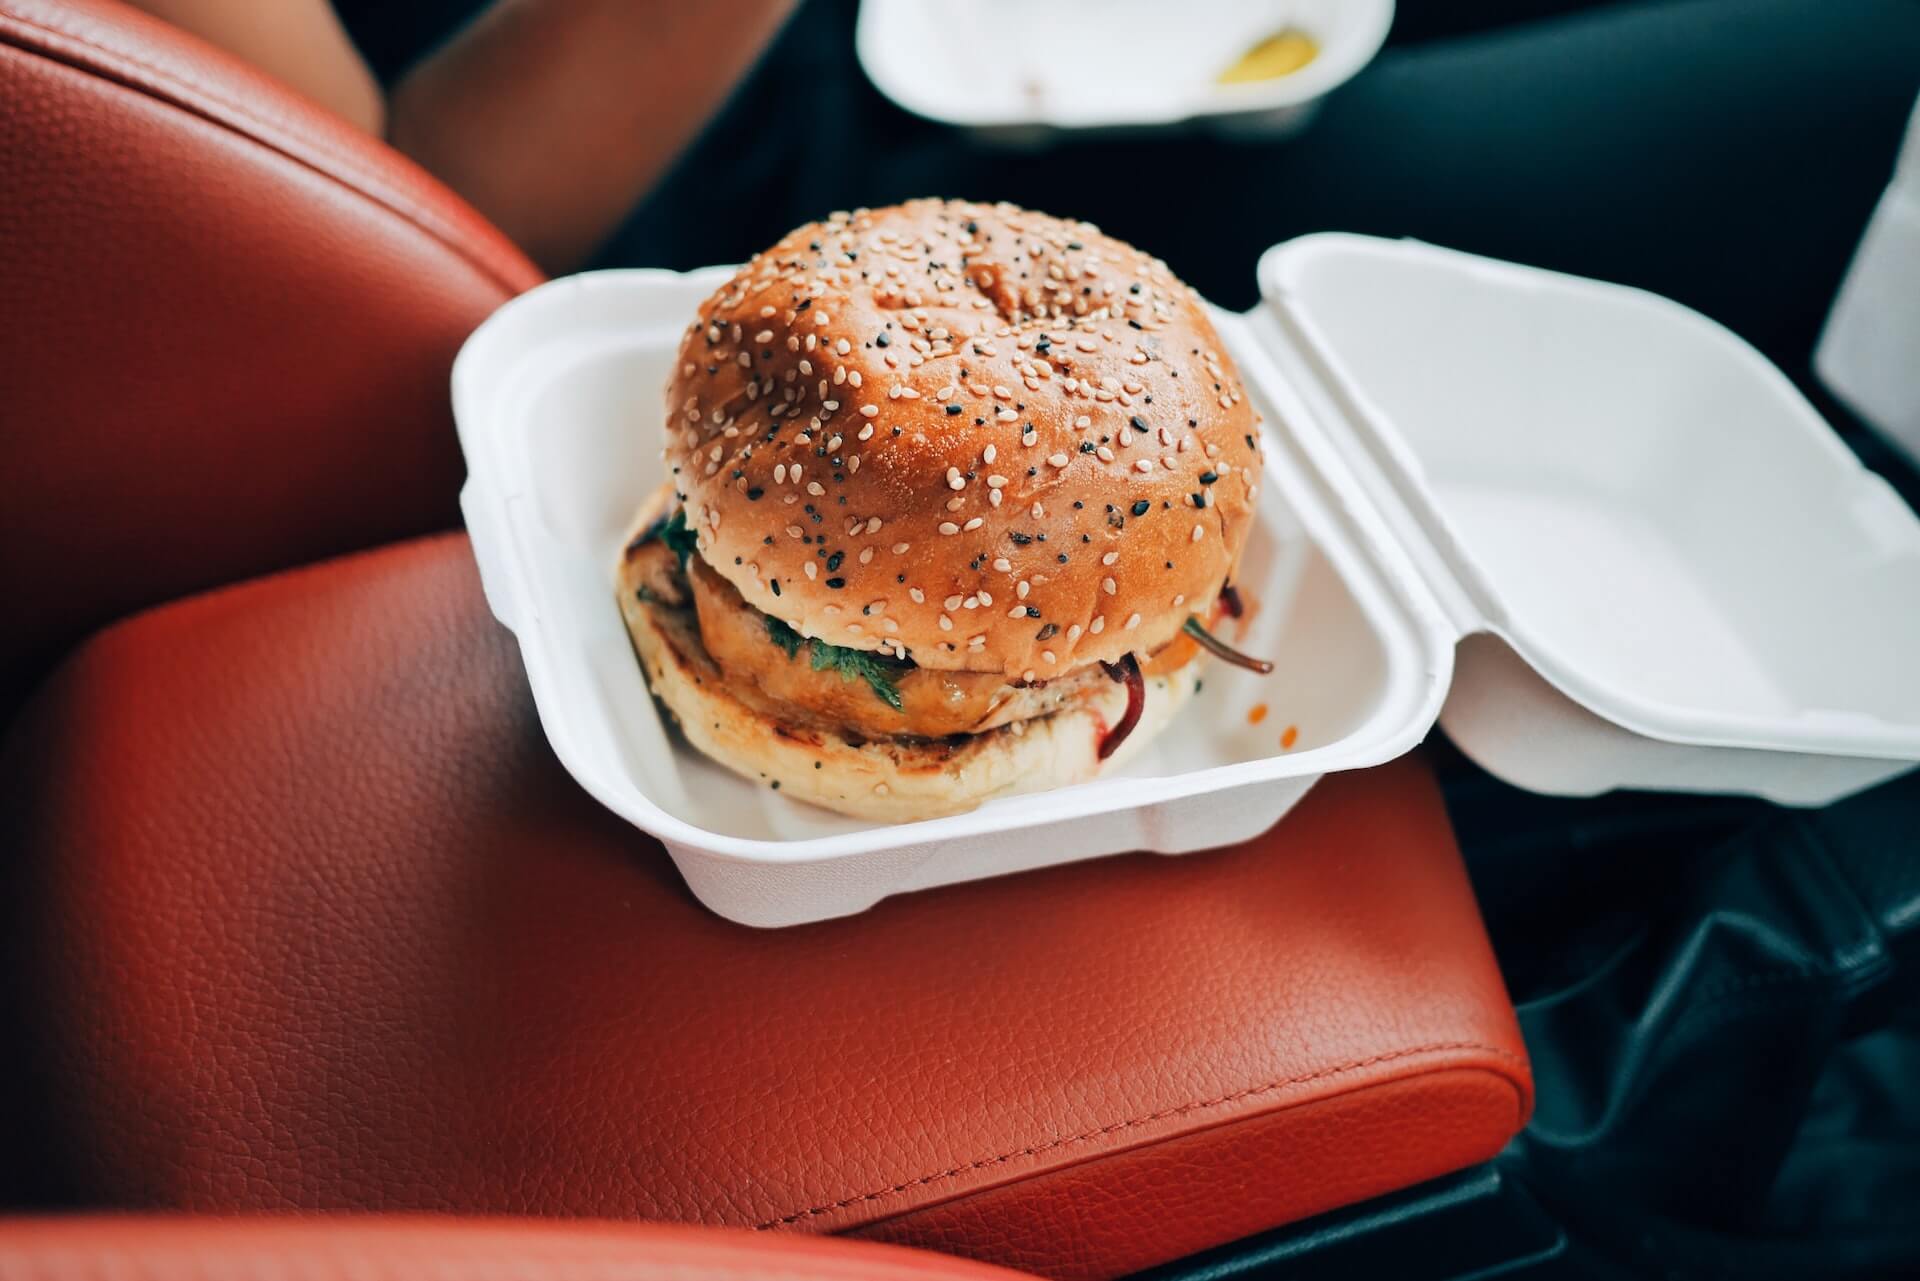
Burger in container inside car

For most restaurants, delivery is now a crucial service element rather than a “nice-to-have” option a small percentage of guests expect.

This is true whether your restaurant is in the US or Canada. But who’s placing orders? How are they ordering? And will they continue to order for the foreseeable future?

Well, Restaurants Canada has answers to all those questions and more. So, we let’s take a look at what their 2022 Foodservice Facts report says about delivery.

To download your own copy of this informative report, click here.

Who’s Placing Orders?

In their 2022 Foodservice Facts report, Restaurants Canada looks at three age groups:

  • 18 to 34
  • 35 to 54
  • 55-plus

Perhaps unsurprisingly, the 18- to 34-year-old cohort leads the charge when it comes to ordering delivery. It’s also not surprising that 35 to 54 comes in second, and 55 and older is third.

However, the first two groups are closer than some may assume. Eighty-three percent of the the 18 to 34 cohort placed orders at quick-service or full-service restaurants between December 2021 and May 2022.

That number does drop for the same time period among the 35 to 54 group, but not by a significant amount. Of that cohort, 77 percent ordered delivery. Just over half of the 55-plus group placed delivery orders: 52 percent.

Now, those numbers are down a bit from 2021, which makes sense. Things were much more restrictive in 2021 and people were just getting back to a sense of normalcy at the start of this year.

In 2021, the delivery order percentages were:

  • 18 to 34: 89 percent
  • 35 to 54: 81 percent
  • 55-plus: 67 percent

Looking at these numbers, it appears the 55-plus cohort is more comfortable dining out in person. Conversely, the 18 to 34 age group is clearly comfortable making delivery a part of their everyday lives.

How do People Want to Order?

Believe it or not, your website still matters. I’ve been saying this for years but the pervasiveness of delivery and takeout ordering is really driving this point home.

The fact is, a notable percentage of your guests want to support your restaurant and staff directly. Over the past couple of years, consumers have become well aware that third-party delivery services are incredibly costly for operators.

Consumers are also aware of third-party delivery debacles, such as the abysmal Grubhub “Free Lunch” mess from May of this year.

So, direct delivery is something that operators need to at least consider. Implementation is often less difficult than most business owners believe. And many platforms, SevenRooms, for example, make implementing direct delivery simple and affordable.

Interestingly, Restaurants Canada data supports the need for direct delivery. Back in May, the industry advocacy organization asked survey respondents how they prefer to place delivery orders from restaurants.

Preferences for QSR customers:

  • No preference: 10 percent
  • Over the phone: 19 percent
  • Third party: 35 percent
  • Restaurant website or app: 36 percent

Full-service customer preferences:

  • No preference: 8 percent
  • Over the phone: 28 percent
  • Third party: 29 percent
  • Restaurant website or app: 35 percent

Honestly, I find it surprising anyone calls a QSR to place an order. However, I suppose that makes sense for an office or catering.

At any rate, make sure your website is up-to-date, you offer direct or “last-mile” delivery, and make it easy to navigate your menu and the ordering process.

Is Ordering Here to Stay?

Now, we all know why restaurant delivery has been supercharged the past two years. However, consumer trend data show that delivery was on the rise before the Covid-19 pandemic.

But now that people are eager to return to normal and the industry is on its way to returning to pre-pandemic levels, is delivery really here to stay?

According to another question asked of survey respondents by Restaurants Canada, more than half of QSR and full-service restaurant customers plan to stick with delivery.

For their 2022 Foodservice Facts report, Restaurants Canada asked back in May how often consumers planned to place delivery orders in the next six months.

Order frequency for QSR customers:

  • Never placed a delivery order and don’t plan to now: 29 percent
  • Order less often: 20 percent
  • Will order with the same frequency: 45 percent
  • Will order more often: 7 percent

Frequency of orders for full-service customers:

  • Never placed a delivery order: 24 percent
  • Order less often: 23 percent
  • Will order with the same frequency: 44 percent
  • Will order more often: 9 percent

Here to Stay?

Of course, there are multiple factors feeding the numbers above. Some people simply don’t like ordering and waiting for delivery. For these consumers, the practice doesn’t just seem convenient.

There’s also the consumer demand to return to in-person dining, socializing with family and friends. And, of course, meeting new people while dining out.

We must also consider inflation and rising costs. Often, restaurant spending is among the first to be reduced when consumers need to be more frugal. Rising menu costs are sure to curtail some delivery spending.

That said, it’s clear delivery is here to stay and must be considered a crucial element for most restaurant operations. QSR and full-service operators need to bear in mind is placing orders; how often they’re placing orders; and get them in the habit of placing orders directly.

Image: Oliur on Unsplash

by David Klemt David Klemt No Comments

This Year’s Big Trend: Moderation

This Year’s Big Trend: Moderation

by David Klemt

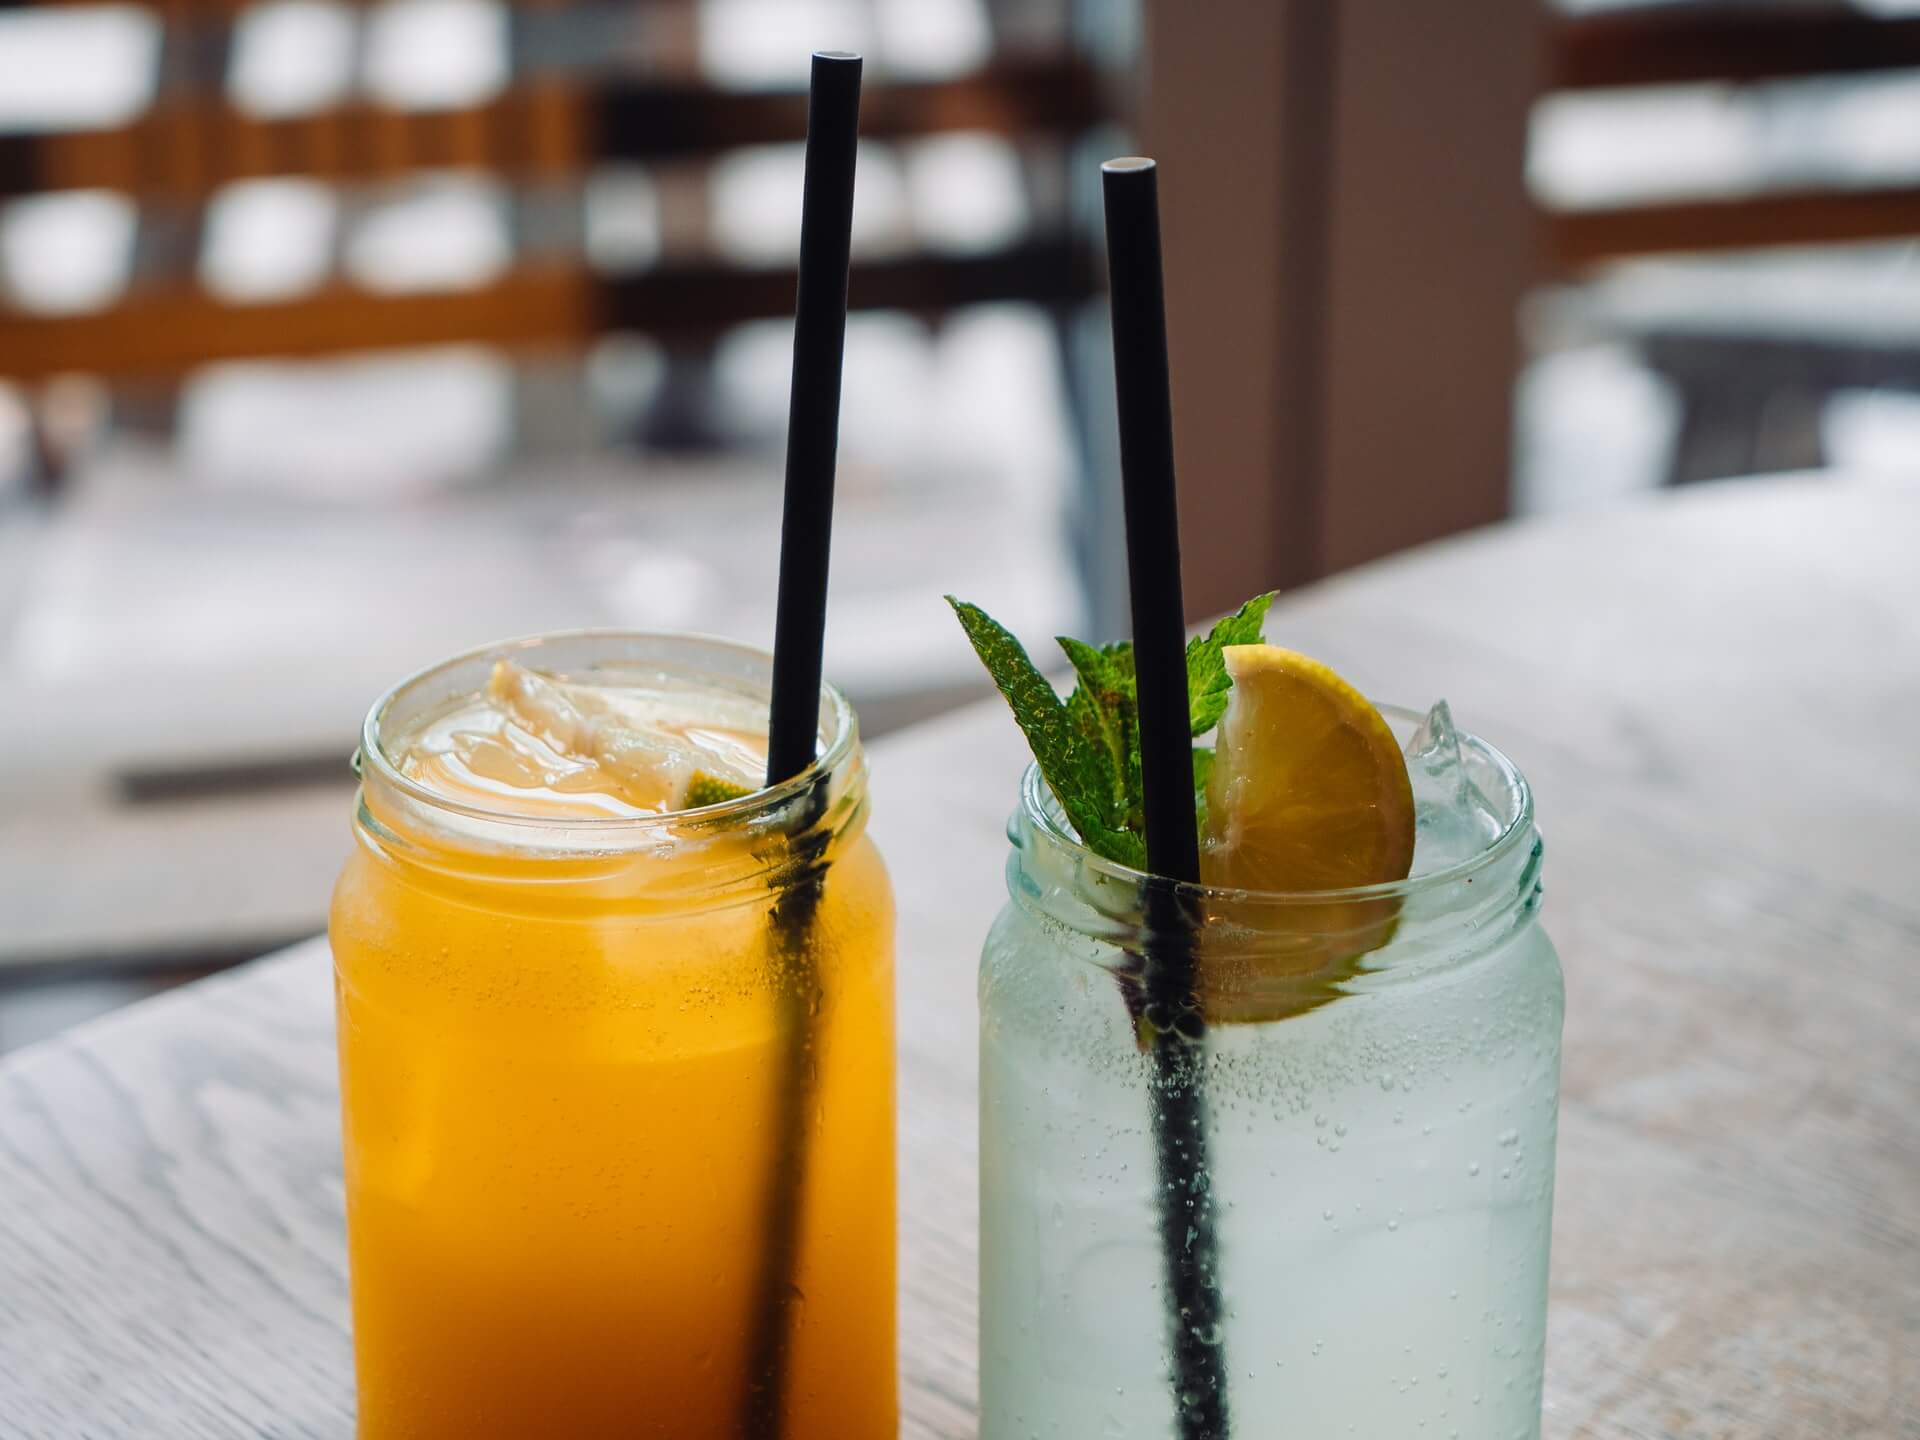
Two drinks in mason jars

Beverage-top media platform Ripples is reporting 2022’s big drink trend, focusing heavily on Gen Z imbibing habits.

The unique company produces devices that make it possible to print images atop drinks. With beverages of all types as their focus, the company is a great position to study drink trends.

Interestingly, Ripples focuses primarily on Gen Z drinking habits. However, the company’s data identifies an intriguing trend that transcends a single generation.

Let’s jump in.

Zero-proof Beverage Growth

At KRG Hospitality, we appreciate numbers; we’re a data-driven agency. Well, amongst all the stats Ripples latest findings reveal, two are massive.

First, in comparison to 2019, zero-alcohol products are up 166 percent. Second, the non-alcohol category is growing four times faster than its low-ABV counterpart.

Another impressive number? Non-alcohol spirits have grown by over 113 percent since 2020.

Per Ripples, Gen Z is driving the growth in the no-alcohol space. According to the beverage-tech company, this is likely due to social media presence.

I’m sure you read articles at least from time to time about Gen Z social media habits. Those written by their older counterparts make it seem like Gen Z doesn’t understand the risks of recording their every action.

Well, it’s highly likely that much of Gen Z would rather not have their drunken shenanigans on display on every social platform.

Values Drive Purchase Decisions

Beyond risk aversion, Ripples identifies values as key to Gen Z purchase and consumption decisions.

Generally speaking, members of Gen Z value transparency and authenticity. Brands that share those values are more likely to succeed with Gen Z.

And, again, speaking broadly, smaller, independent brands are often perceived as more transparent, authentic, and responsible. Large, mainstream brands are often seen as anything but green and responsible, never mind transparent or authentic.

Ripples posits that small indies aren’t encountering daunting barriers to entry. So, small-batch, craft non-alcohol brands are apt to find Gen Z support.

Craft sodas, RTDs offering health benefits, and zero-proof cocktails in cans or bottles are flooding the market. And they’re finding success. In fact, according to Ripples, RTD sales are up 400 percent on Drizly since 2019.

The Big Trend

If you’re a listener of our Bar Hacks podcast you’ve likely heard our episodes with David Allison. If you haven’t heard them, they’re episode 46 and episode 67.

As the founder of the Valuegraphics Project, Allison isn’t a fan of focusing on demographic stereotypes. Instead, he recommends a focus on values in conjunction with demographic and psychographic data.

In part, the Valuegraphics Project approach encourages business owners and operators to identify and target their customers’ values. This is, according to Allison, far more powerful than focusing on age and sex. As important is the fact that demographics tend to divide us, and stereotypes are dangerous.

So, he and the Valuegraphics Project team probably wouldn’t like all the focus on a single generation in this article and Ripples’ findings. Well, there’s some good news and it pertains to what’s likely this year’s biggest drinking trend.

Across all generations, one drinking trend is common: Moderation. An interest in no- and low-alcohol beverages is shared among all generations.

In fact, according to Ripples, 78 percent of consumers purchasing zero-proof drinks aren’t doing so exclusively. These consumers are still buying they’re favorite full-alcohol beverages.

Takeaway

Leveraging the moderation trend is fairly simple. The growth of all zero-proof categories means operators can succeed with alcohol-free spirits, beer, and wine.

RTD cocktails—full-, low- and zero-proof—are selling very well and work in restaurants and bars.

In short, ensure you have low-ABV and zero-alcohol versions of your full-ABV drinks on your menu. Include these in a dedicated non-alcohol section.

Operators don’t need to be afraid of guests drinking more moderately. The stereotype that guests who choose zero- or low-proof drinks are bad for the bottom line simply isn’t true.

Image: Chris Curry on Unsplash

by David Klemt David Klemt No Comments

Square: 2022 Threats & Opportunities

Square: 2022 Threats & Opportunities

by David Klemt

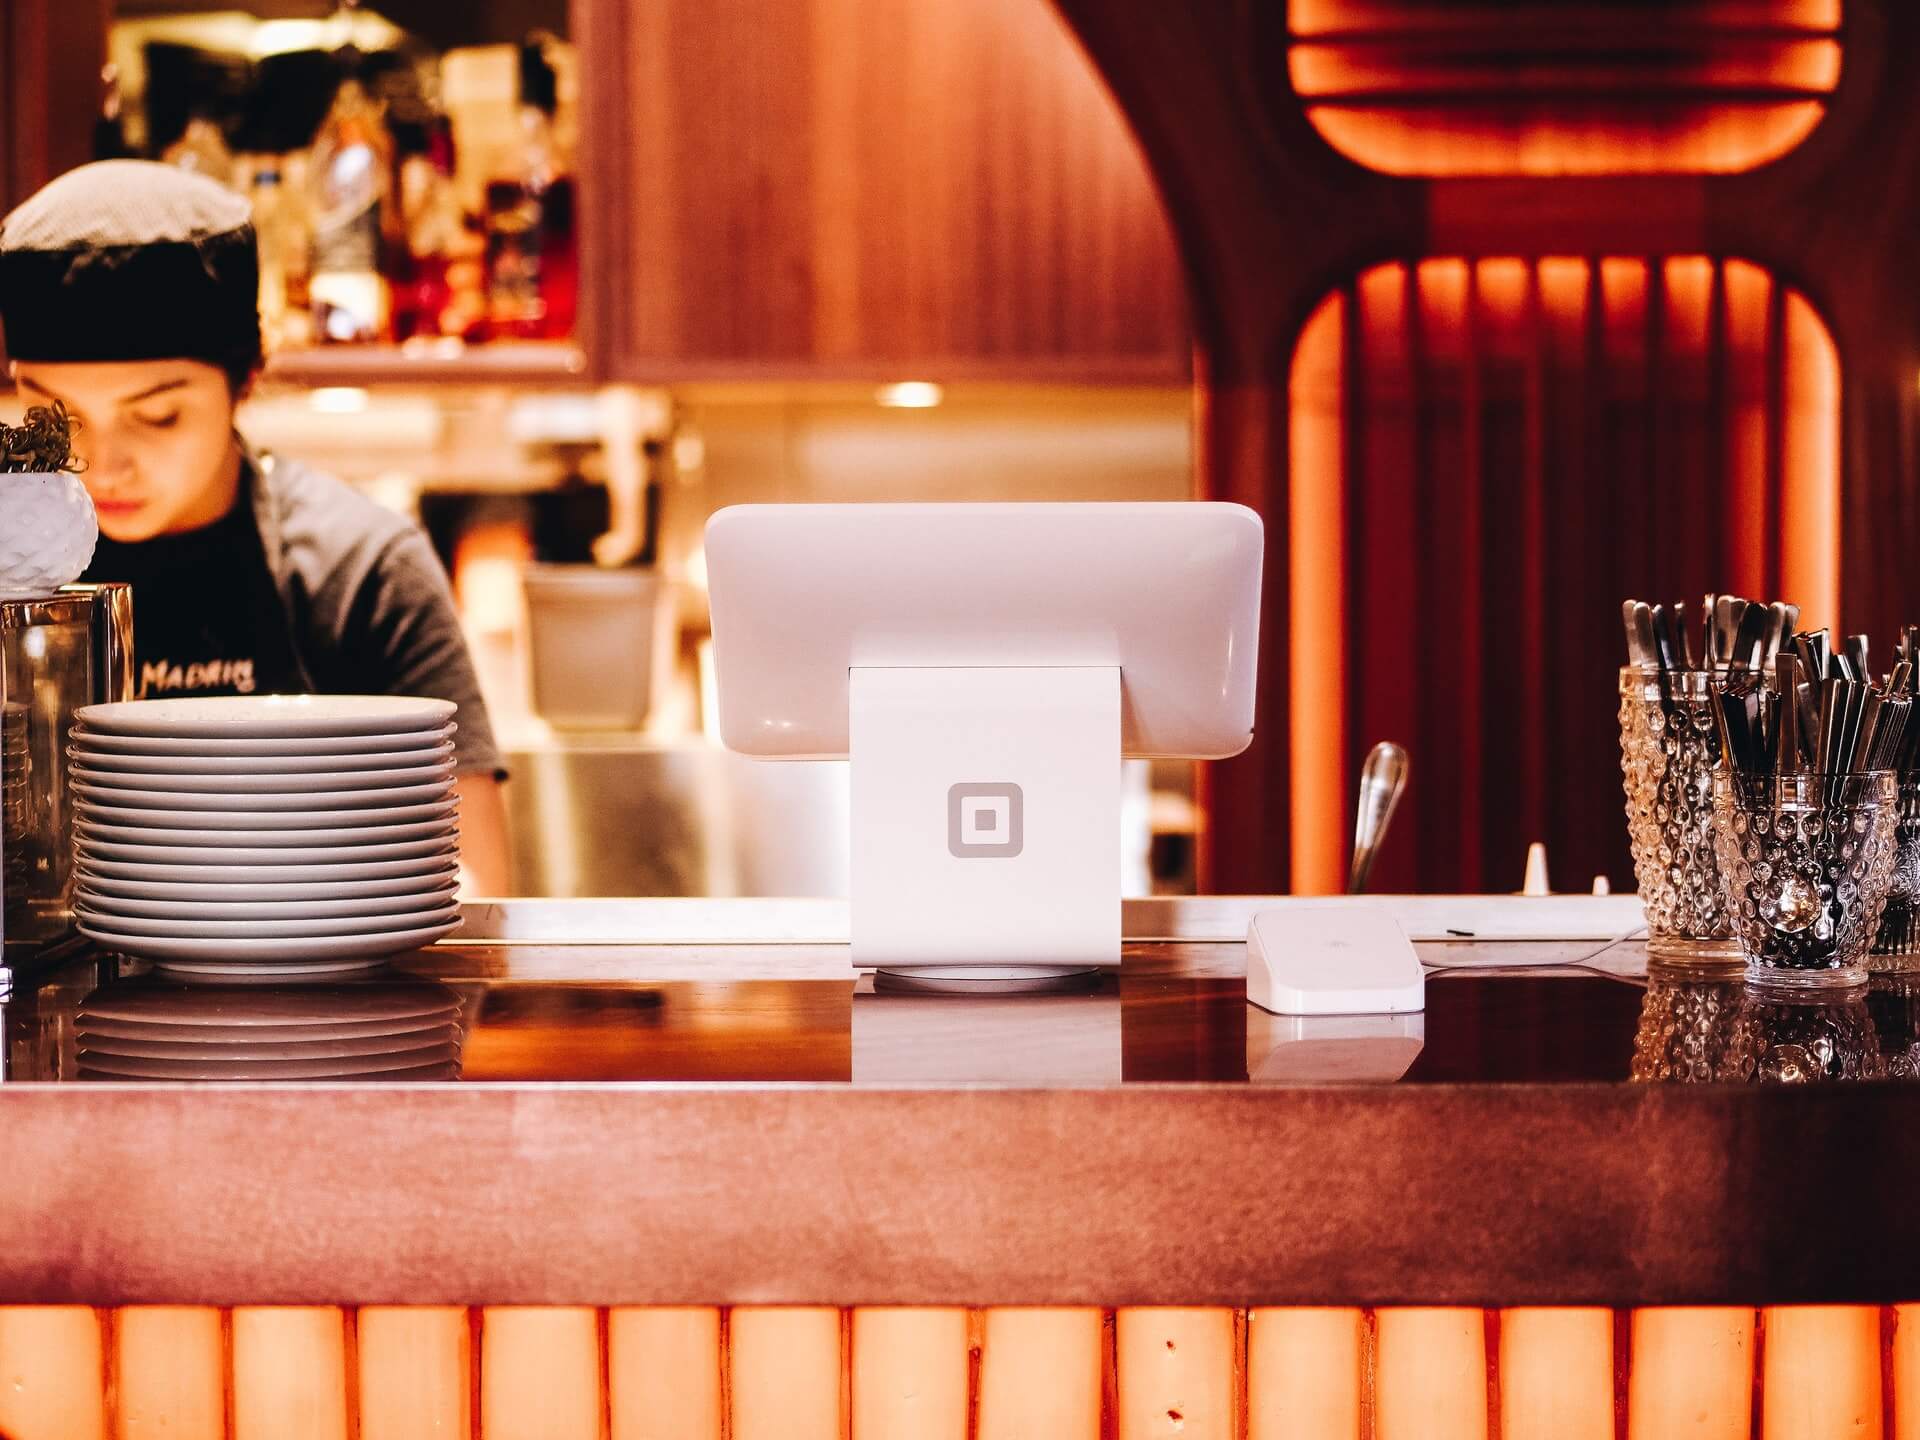
Square terminal in restaurant kitchen

As all hospitality professionals know, the past nearly two years is imposing rapid change on the industry, necessitating rapid, strategic adaptation.

The key word in the above sentence isn’t “adaptation,” it’s “strategic.”

Of course, it’s hard to make strategic choices without as much information as possible.

To that end, we’ve reviewed Square‘s recently released “Future of Restaurants: 2022 Edition.” This is the company’s second annual Future of Restaurants report.

Square partnered with Wakefield Research, surveying 500 operators and 1,000 consumers to identify 2022 threats and opportunities.

Threat: Labor Shortage

Most operators aren’t going to want to read this prediction from Square. However, we can’t identify and adapt for opportunities if we don’t acknowledge threats.

Per Square’s report, the labor shortage may never see a correction. In other words, welcome to yet another new normal.

More than 70 percent of operators say they’re facing a labor shortage, per Square. Just over 20 percent of available positions were, at the time the survey was conducted, unfilled.

Instead, operators will likely, according to Square, need to make operational and work culture changes:

  • Improve working conditions. For example, encouraging and acting on team feedback. Another example? Modernizing scheduling.
  • Ensure workers are being mentored and not simply managed.
  • Hire, train, assign tasks, and schedule more strategically to operate with a smaller team.
  • Offering incentives that entice higher-quality candidates to work for you.

One participant quoted in the Square report claims that QR code ordering dropped their labor cost percentage by 150 percent.

Threat: Lack of Tech

As SevenRooms suggested when looking forward to 2022, technology solutions can lessen the burden of labor shortages. That leads us to another big threat: failing to embrace tech.

Some operators bristle at the word “automation.” For many, it conjures an image of robots in the kitchen and delivering food to tables.

Obviously, we’re opposed to replacing staff with any form of automation. However, we support automating tasks if that means team members are better utilized.

Why not automate inventory? Why not automate online order filling? If it improves operations and the guest experience, automation is less threatening.

According to Square’s report, 62 percent of operators think automation is appealing for managing online, delivery, and contactless orders. Ninety percent of operators say that back-of-house automation—if staff can focus on more important tasks—is a good idea.

More than 90 percent think automated inventory is an appealing solution.

It has taken a lot of time for hospitality to catch up to other industries in embracing tech. But Square reports that 36 percent of restaurants upgraded their business tech in 2021.

Of course, automation will become a threat if operators lean too heavily into it and stop paying attention to detail.

Phrased another way, be tech-savvy, not tech-reliant.

Opportunity: Omni-channel

Square see implementing an omni-channel strategy as the way forward. In fact, their general manager for Square Restaurants, Bryan Solar, said the following:

“We see the time of the dine-in only or takeout only as largely done forever.”

Going omni-channel (diversifying) in the restaurant space means making online ordering and delivery important elements within the overall business strategy. To that end, Solar posits kitchens will grow in size to better handle online orders.

Square’s survey reveals some intriguing numbers:

  • 13 percent of consumers say they’ll avoid restaurants that don’t offer online ordering.
  • Among restaurants with online ordering, those channels generate 34 percent of their revenue.
  • Over the past year, 54 percent of restaurants either added or expanded online ordering channels.
  • Online ordering is likely here to stay: 69 percent of respondents plan to offer it post-Covid-19.
  • 24 percent of operators are planning to allow guests to order alcohol from them online.

Another interesting set of numbers pertains to first- and third-party delivery. As we’ve stated several times, we much prefer operators offer first-party or direct delivery. According to Square, 49 percent of operators plan go direct delivery. More than half—62 percent—will pursue third-party delivery. That suggests that some operators will offer both.

Opportunity: Direct Ordering

When it comes to engaging online guests, operators need to control the experience. As I wrote for another publication years ago, a restaurant or bar’s website is still very important.

This statistic proves that statement true: Per Square, 68 percent of online guests want to order via a restaurant’s website or app, not a third-party.

More than likely, a significant portion of those guests want to know they’re supporting a restaurant and its staff directly. Hence the importance placed on ordering via the website or their own branded app.

So, operators would do well to ensure their websites feature an ordering widget. Or, they can opt to have an app built (or at least skinned) for their business.

Opportunity: Kiosks

According to Square’s survey results, 79 percent of consumers prefer ordering from kiosks over ordering from staff.

Most consumers and operators likely associate ordering kiosks with fast food restaurants. However, other categories can also benefit from these devices.

Close to half—45 percent—identified it as a preference when ordering at a casual-dining restaurant.

And fine dining isn’t immune to the convenience of tech. A little over 20 percent of consumers prefer to order via kiosk in the fine-dining space.

Overall, kiosks speak to the guest desires for convenience and safety. More than a third indicated that ordering via digital menu is appealing because they don’t have to touch a menu someone else has touched. And 37 percent like a digital option because they don’t have to wait for a server to bring them a physical menu.

Eleven percent of Square survey respondents will avoid a restaurant if they don’t offer digital menus.

Nearly half (45 percent) of restaurants are planning to offer QR code menus post-Covid-19. Another benefit of digital menus is dynamic pricing. As costs fluctuate, operators can increase or reduce prices easily without printing new menus.

Outlook

Representing a stark contrast from 2020 survey results, nearly 60 percent of operators say the survival of their restaurants is a concern in 2022.

That’s still a high number but vastly lower than how operators answered about 2021. Last year, 92 percent of operators surveyed said they were worried about survival.

According to Square’s report, operators are looking past surviving and making long-term plans. That’s a welcome sign that confidence is improving.

To review Square’s “Future of Restaurants: 2022 Edition” report in its entirety, click here.

Image: Patrick Tomasso on Unsplash

by David Klemt David Klemt No Comments

SevenRooms Predicts 2022

SevenRooms Predicts 2022

by David Klemt

SevenRooms guest data image

As we near the end of a tumultuous 2021 we must look ahead to 2022 to set our industry up for best strategies, innovations, and recovery.

SevenRooms is doing just that, looking at what operators should consider to meet guest expectations next year.

In a blog post on the company’s website, SevenRooms reveals what they believe are the keys to success in 2022.

Let’s jump in.

More is More

The first quarter of 2022 will mark two years of the pandemic and its affects on the industry.

As SevenRooms says, some guests will not have been out of their homes for two years. The company predicts this contingent will be looking to unleash pent-up demand.

Of course, that represents an opportunity for operators. Another wave of pent-up demand can mean a boost in traffic and revenue.

However, guest expectations will be sky high. That cliché that less is more? Yeah, you can toss that right out.

More will be more for this contingent of guests looking to dine and drink out after feeling cooped up for month after endless month.

Sure, some guests are aware that operators are facing labor shortages, increased costs, and other pandemic-driven challenges. They know that workers are overwhelmed and finding themselves in hostile confrontations they certainly don’t deserve.

And sure, some guests are sympathetic to those struggles. However, they have their demands and expect restaurants, bars, and hotels to meet them.

What can operators do to meet those demands? In fact, what can they do to anticipate and overdeliver on guest expectations?

SevenRooms has a couple suggestions.

Collect guest data. At this point, this should be a given. How can an operator engage with and retain guests if they don’t really know anything about them?

Embrace more tech. Platforms like SevenRooms can handle a restaurant or bar’s reservations quickly and easily. This is a feature that, per SevenRooms, more than half of guests expect a restaurant or bar offer. Some platforms can also automate marketing; send guests post-visit surveys; and tackle review aggregation.

Convenience Reigns Supreme

Here’s a quick, impromptu survey:

Do you prefer a seamless restaurant, bar or hotel experience, or do you like frustrating dining, drinking and lodging experiences?

I’m going to go ahead and assume you prefer the former option. In other words, you like what your guests like: convenience.

Well, SevenRooms is predicting that the desire for convenience will only grow stronger among guests.

Yes, delivering on the increasingly important topic of convenience will rely on collecting data. But rather than view it as just one more task, SevenRoom suggests looking at it in a more positive light.

A number of the conveniences guests expect can be automated. They can even help ease the burden of the labor shortage somewhat.

For example, contactless ordering and contactless pay are close to becoming standards. Offering those features to guests means meeting expectations, thereby delivering an excellent guest experience. On-demand ordering and paying can also ease some front- and back-of-house pressure.

Collecting guest data allows management and front-of-house staff to add personal touches before a guest is even seated. Again, seamless, excellent guest service.

Another convenience? Online ordering. SevenRooms isn’t the first to predict that on-demand ordering is here to stay. In fact, a suite of conveniences will be important moving forward:

  • Online ordering during in-person visits and for delivery or pickup.
  • A user-friendly reservation system that goes deeper than just picking a date and time. Why not allow guests to select seats and even request upgrades?
  • A virtual waitlist. Not only is this convenient, SevenRooms says this feature can boost walk-in traffic and reduce abandonment.
  • Contactless, mobile paying options.

There you have it. Two seemingly basic predictions—higher expectations and a desire for even more convenience—with the potential to boost traffic, loyalty, and revenue.

Image: SevenRooms

by David Klemt David Klemt No Comments

Canadian Trends 2022: Technomic

Canadian Trends 2022: Technomic

by David Klemt

Yellow neon "butter" sign and scaffolding

Curious about what to expect in 2022 as a Canadian restaurant, bar or hotel operator?

Technomic has some predictions for next year.

Reviewing their “Canadian Trends: Looking Ahead to 2022” report, creativity and streamlining will be keys to success.

Let’s jump in!

Butter

Yes, this is why I chose the image above. Technomic is very specifically identifying butter as an important 2022 F&B trend.

And no, they don’t appear to be predicting the popularity a particularly rare or esoteric butter. The industry intelligence firm means butter will prove important in 2022.

In large part, Technomic is pointing to comfort food as a driver for butter.

Generally, the firm points to how versatile butter is in the kitchen. Browned and herb-infused butters, says Technomic, will find its way into cocktails.

Flavor and texture will play an important role, extending the butter prediction into buttery foods territory. For example, Technomic predicts butterscotch, buttermilk and ghee will see a boost in usage and demand.

Additionally, the plant-based movement will help nut butters grow more popular. In fact, Technomic says nut butters will find their ways onto burgers and into cocktails.

Interestingly, the firm’s butter prediction gives operators two larger trends to watch: comfort food and plant-based.

Cross-utilization

You don’t need me to tell you that North America—and the rest of the world—is facing supply chain issues.

I know you’re exhausted from just the past nearly two years of constant adaptation and pivoting. In 2022, you’ll have to continue with your creative problem solving.

The supply chain challenge (there’s an understatement) requires creativity in several areas. This includes the kitchen and menu.

Technomic suggests that one path forward through supply chain problems involves ingredient preparations:

  • Pickling
  • Candying
  • Salt-baking

The firm says these creative takes on ingredients operators already have will extend product life; add new flavors to dishes; and deliver new textures. Those last two offer guests new experiences.

In addition, getting creative with the ingredients you may be able to get more readily will help streamline and update 2022 menus. However, revising your menu will require careful consideration of your supply chain and cross-utilization, with a heavy helping of creative prep.

Running Lean

Smaller footprints. Shrunken staff. Streamlined menus. Smaller, shrunken, streamlined, optimized, leaner…

Call the process whatever you want, Technomic is predicting that operators will need to “optimize” (read: make smaller) their businesses.

Of course, there isn’t a one-size-fits-all solution. We’ve read and heard predictions since last year about what will need to shrink moving forward.

While some recent news reports say that ghost kitchens are out, Technomic seems to think that’s not the case. Technomic suggests ghost kitchens will remain viable for operators who want to expand without investing in real estate.

Additionally, Technomic’s report suggests something that should come as no surprise. In short, if it works for a brand or location, smaller may be better and here to stay.

Growth

Now, this is the most promising of Technomic’s predictions: Growth.

Per the firm, the foodservice industry in Canada was down 29 percent in Q1 of 2021. Pre-pandemic, sales reached $95 billion. That represents a loss of nearly $30 billion.

However, there’s reason to be optimistic in 2022, according to Technomic.

The firm expects growth of 21 percent in 2022 over 2021, or sales of $74.8 billion. Should this prediction prove accurate, 2022 would close just three percent under pre-pandemic sales.

Technomic identifies full-service as the foodservice segment to experience the most growth next year at 26.2 percent. In comparison, the firm predicts limited-service to grow 7.3 percent.

Next year won’t be easy. 2022 won’t be a magical return to normalcy. But there is room for optimism if Technomic’s predictions are correct.

Image: Jon Tyson on Unsplash

Top