Stats

by David Klemt David Klemt No Comments

Global Cuisine Performance

Global Cuisine Performance

by David Klemt
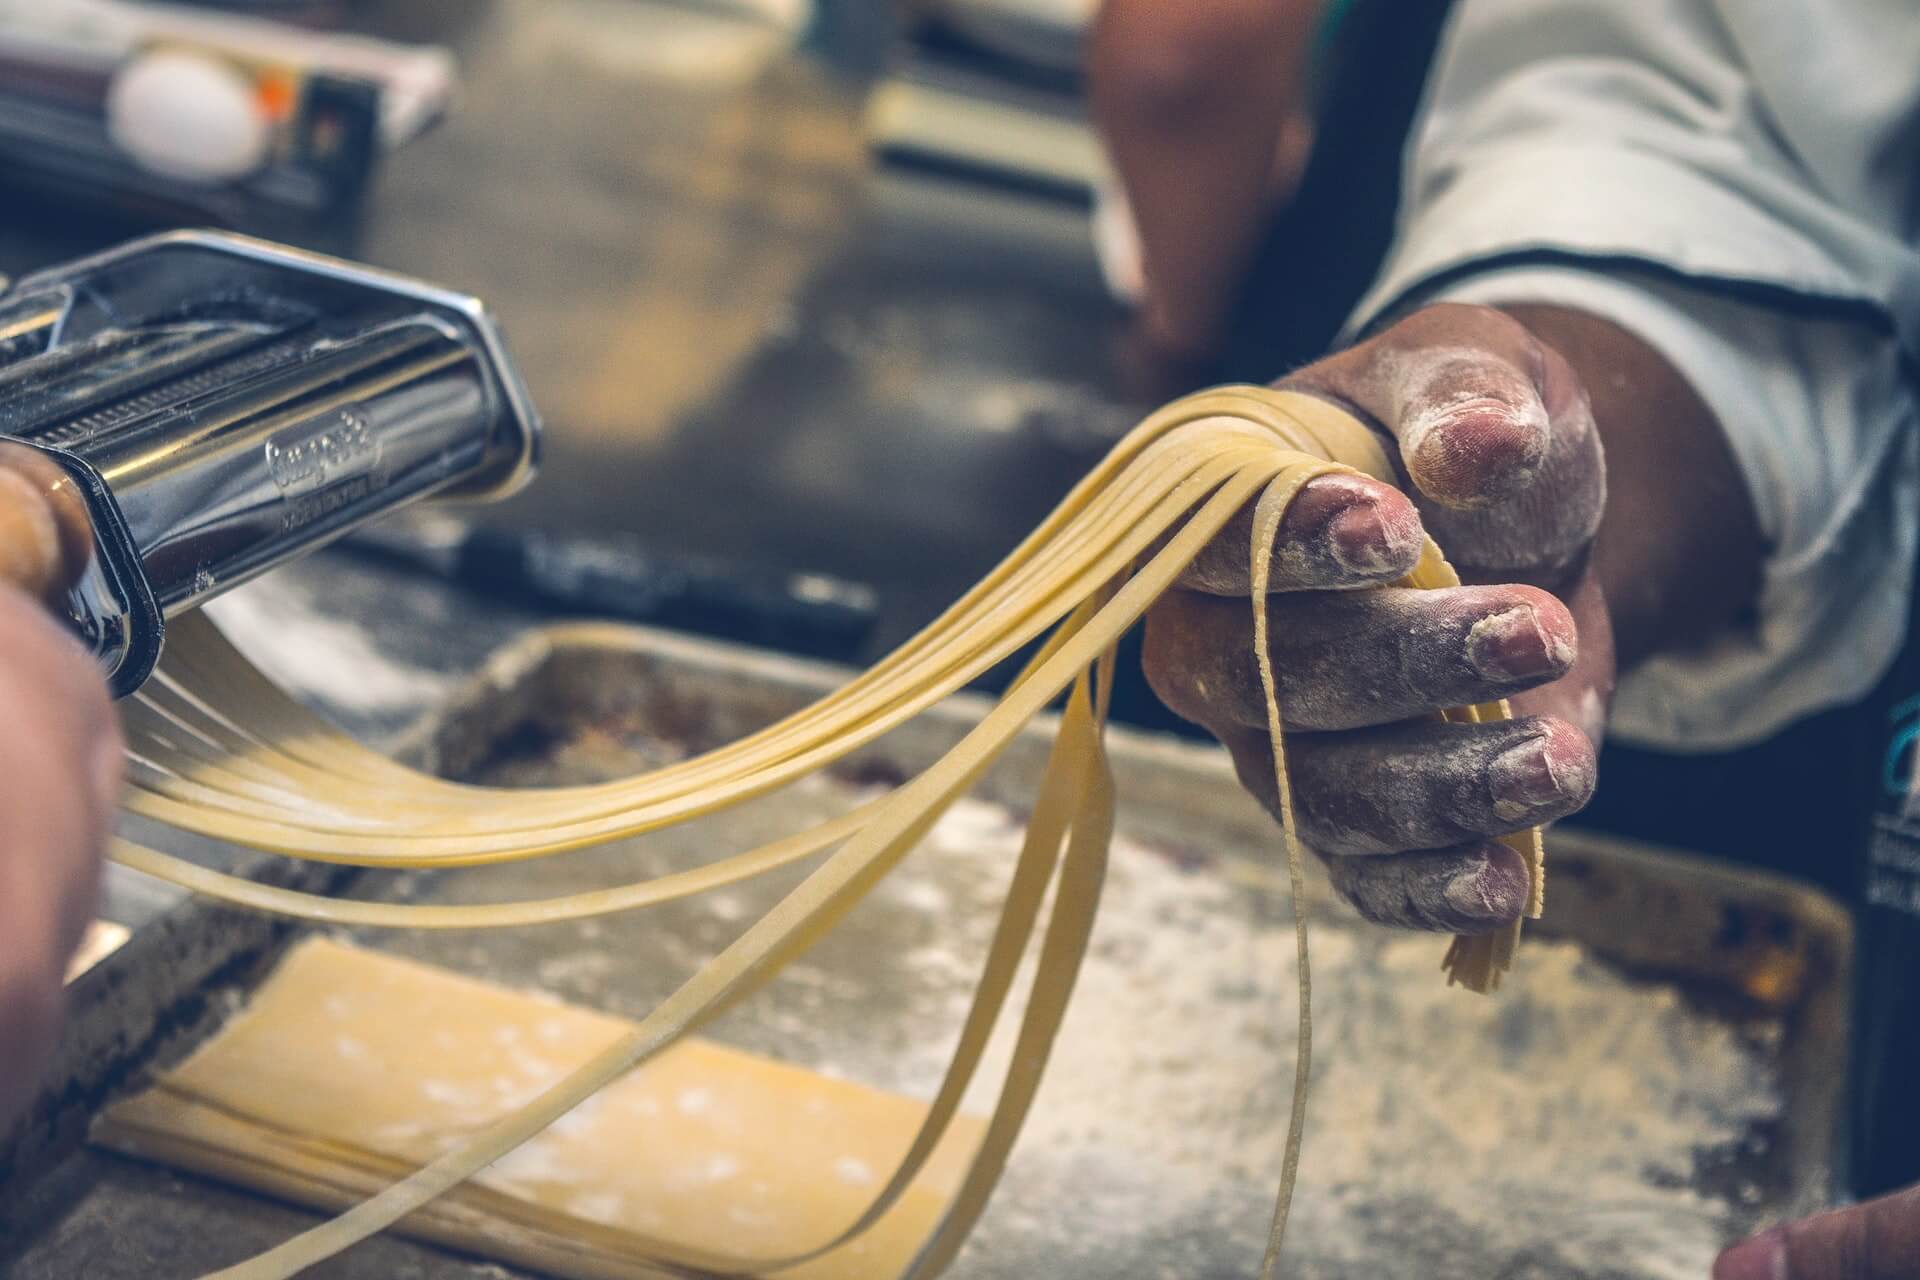
Cook making handmade pasta noodles

We don’t have a crystal ball to help us see which cuisines will be most popular. Obviously, the same holds true for knowing which are just now getting recognition.

However, we do have the next-best thing: data from Datassential.

Recently, the food and beverage analytics firm ranked dozens of global cuisines according to their current state of popularity among diners.

Then, they shared that information in October during their “Around the World in 80 Trends” webinar.

“Ubiquity”

When analyzing food and beverage trends, Datassential funnels them into four distinct designations: Inception, Adoption, Proliferation, and Ubiquity.

Arguably, once a trend reaches Proliferation and Ubiquity it becomes a mainstay. So, we can more than likely stop referring to it as a trend.

Now, the two most precarious stages for a trend are Inception and Adoption. Plenty of trends die on the Inception vine. Several won’t make it out of Adoption.

When you see Datassential’s list of global cuisines that fly under the Ubiquity banner, I doubt there will be much surprise:

  • Italian
  • Southern
  • Mexican
  • Creole/Cajun
  • Tex Mex
  • Chinese

So, any shocks to your system there? Most likely not.

“Proliferation”

Another to label this Datassential designation is “second most popular.” Each of these cuisines has a clear shot at reaching Ubiquity.

In fact, I find one of the global cuisines in this category surprising. It’s the first one in this list:

  • Japanese
  • Regional Italian
  • Regional Mexican
  • Greek
  • Mediterranean
  • Regional US
  • Southwestern
  • Cuban

As you’ll see, the lists grow longer steadily as we move down from Ubiquity.

“Adoption”

For me, it’ll be interesting to review follow-up data from Datassential regarding global cuisines.

As such, I’m eager to learn which cuisine from the list below reaches Proliferation in 2022:

  • Caribbean
  • Indian
  • French
  • Regional Chinese
  • Oaxacan
  • German
  • Middle Eastern
  • Korean
  • Ashkenazi
  • Hawaiian
  • Vietnamese
  • Venezuelan
  • Spanish
  • Sicilian
  • Jamaican
  • Israeli
  • Thai
  • British

To be honest, my first reaction to seeing French cuisine under the Adoption banner was surprise. Of course, I then thought back to how many French restaurants we have here in Las Vegas.

Sure, this little city in the desert is a foodie destination. However, French restaurants don’t dot the landscape like those that focus on other cuisines.

“Inception”

That brings us to the first stage of any trend: Inception.

Now, the first thing you’ll notice is that this category contains the most global cuisines. Whereas Adoption features 18, Proliferation lists eight, and a mere six have reached Ubiquity, Inception identifies two dozen.

They are as follows:

  • Brazilian
  • Mizrahi
  • Russian
  • Malaysian
  • Croatian
  • Moroccan
  • Lebanese
  • South African
  • Native American
  • Central American
  • Argentinian
  • Peruvian
  • Filipino
  • Appalachian
  • Sephardic
  • Ethiopian
  • Senegalese
  • Scandinavian
  • Sonoran
  • Nigerian
  • Iranian
  • Persian
  • Turkish
  • Polish

Again, there are some surprises here, at least for me. For example, I expected Ethiopian cuisine to have reached Adoption by now.

Takeaways

Of course, there are multiple ways to interpret this data.

First, you can embrace Ubiquity, leveraging their incredible popularity. However, standing out and building traffic will be challenging.

Second, you can feature Proliferation cuisine. Sure, these have yet to reach the Ubiquity stage. But they’re close to doing so, and you’ll also face stiff competition.

Third, focusing on cuisine from the Adoption designation involves taking a risk but mitigating it somewhat. These cuisines are developing a following and guest demand.

Finally, the riskiest move, depending on location: featuring Inception cuisines. But with risk comes reward. Identify a gap in a certain area—something we can do with our signature feasibility studies—and you may realize staggering success.

So, what do you think? Did you find any of Datassential’s designations surprising for certain cuisines? Let us know on our Instagram, Facebook, Twitter or LinkedIn pages!

Image: Jorge Zapata on Unsplash

by David Klemt David Klemt No Comments

Things Looking Up For December

Things Looking Up For December

by David Klemt

Friends toasting with Champagne outside during the winter

Food and beverage research and analytics firm Datassential’s end-of-year insights point to a positive outlook for restaurants in December.

While many consumers still have reservations about spending time in public, others are eager to return to “normal.”

Restaurants and bars are expected to play an important role in reaching normalcy this holiday season.

Let’s take a look at Datassential’s 2021 Holiday Issue statistics.

Hesitancy Waning?

Let’s get the less-promising data out of the way first. Some consumers still find the idea of in-person restaurant visits uncomfortable.

Nearly half of Boomers surveyed by Datassential (46 percent) said they’re “significantly less likely” to visit a fast-casual or fast-food restaurant in December.

And, interestingly, 42 percent of men gave the same answer for visiting traditional sit-down restaurants.

However, of all the in-person options presented to participants by Datassential, restaurants performed the best.

More than half of all respondents—men, women, Gen Z, Millennials, Gen X, Boomers—plan to visit fast-casual, fast-food, and sit-down restaurants more in December than they have in recent months.

It’s most likely that anticipation for restaurant visits is driven by the desire to gather and celebrate the holidays.

Overall, 57 percent of respondents plan to visit fast-casual and fast-food restaurants more. And 47 percent expect to visit sit-down restaurants more.

That makes those two options the top answers.

Only 16 percent of respondents indicated they don’t plan on visiting any on-site foodservice venues.

Regarding bars, sports bars, lounges, and nightclubs, men are “significantly more likely” (23 percent) to visit those types of venues in December.

Holiday Opportunity

According to Datassential’s report, the opportunity for holiday bookings is out there.

More than likely, gatherings will simply be smaller than they were prior to the pandemic.

Asked about plans to gather at restaurants in December, get-togethers are expected to be “moderately sized.”

Almost half of survey respondents (44 percent) plan on gathering at restaurants in parties of seven to twelve.

Just over a quarter (29 percent) plan on get-togethers of six or fewer of people. Only 18 percent of respondents are planning large (13 to 18 people) gatherings at restaurants in December.

As far as parties of 19 or more, just nine percent of respondents plan “very large” gatherings.

Of course, individual operations’ results will vary. However, this information gives us an idea of what traffic may look like for many operators.

2021 Spending

This is where the news looks even better for restaurants, bars and nightclubs in December.

When asked about spending money on going out to eat and for drinks, just 18 percent of respondents said they planned to spend less this year than in 2020.

Very nearly half (49 percent) plan to spend the same as they did last year. However, 32 percent said they think they’ll increase their spending.

When it comes to New Year’s Eve, the numbers shift a bit. However, 50 percent of respondents plan to spend the same on NYE in 2021 as they did in 2020.

Twenty-six percent plan to spend more on NYE in 2021. Just 24 percent plan to spend less this year on NYE.

Per Datassential, Millennials are most likely to splash out for NYE this year.

So, things won’t be returning to pre-pandemic normalcy by 2021’s end. However, if Datassentials findings prove accurate, things are looking healthier for December.

Image: Christine Jou on Unsplash

by David Klemt David Klemt No Comments

Thanksgiving Eve by the Numbers

Thanksgiving Eve by the Numbers

by David Klemt

Two shot glasses garnished with salt rim and lemon wedges

Tonight, guests will be looking to celebrate a bar holiday that’s traditionally lucrative for operators: Thanksgiving Eve, a.k.a. Drinksgiving.

It’s difficult to imagine that any operator or hospitality worker is unaware of Thanksgiving Eve’s status.

Sure, some mark the start of end-of-year celebrations with Halloween or Thanksgiving. However, I feel Thanksgiving Eve truly ushers in the holiday season.

I’d also argue that while retailers have Black Friday and Cyber Monday, operators have the night before Thanksgiving. Yes, New Year’s Eve is also huge, but Thanksgiving Eve is considered the busiest night of the year for bars.

Interestingly, this is a holiday that benefits bars across the nation. In fact, it’s not exclusive to destination cities.

After all, the reason it’s so big, traditionally, is that people are traveling back to their hometowns. And while Thanksgiving is for their families, Thanksgiving Eve is for catching up with childhood and high school friends.

Obviously, there are fantastic bars located in cities outside of their destination counterparts. Hot take, I know.

So, does Thanksgiving Eve deserve its hype ?

The Evidence

Unfortunately, data from 2020 isn’t readily available, for obvious reasons.

However, we do have some data, largely thanks to restaurant management and POS platform Upserve.

One of the simplest ways to analyze Thanksgiving Eve’s impact is to compare it to the previous Wednesday.

Per Upserve, guest counts rose 23 percent in 2018 when compared to the Wednesday prior to Thanksgiving Eve.

Looking at data from more than 10,000 restaurants and bars, Upserve found that guest count totaled 496,883 on November 14, 2018. One week later, that number rose to 643,637.

As Upserve content marketing coordinator Stephanie Resendes says in her Thanksgiving Eve article, “More people = more money.”

Of the 10,000-plus Upserve clients whose data was analyzed, net sales were $17.250 million on the Wednesday preceding Thanksgiving Eve 2018. That number jumped to $22.296 million.

So, looking just at a relatively small sample size from 2018, Thanksgiving Eve’s impact doesn’t seem overblown.

The Drinks

According to Upserve, beer was the year-over-year winner through 2018. It saw the most growth by far on Thanksgiving Eve 2018 when compared to the Wednesday prior and the same period in 2017.

Spirits and wine, at least for Thanksgiving Eve 2018, were nearly tied for second place.

Now, looking at the data for Thanksgiving Eve 2019, spirits saw the most growth overall. Resendes shared that shot sales increased 173 percent on Thanksgiving Eve 2019 when compared to the Wednesday prior.

Tequila led the charge for spirits, rising 156 percent. Vodka saw a 144-percent boost, rum increased 120 percent, whiskey went up 65 percent, and gin saw a lift of 47 percent. For its part, beer sales rose 65 percent.

Not content to simply look at traffic and sales numbers, Upserve also split their clients into four regions. In this way, they identified who parties hardest on Thanksgiving Eve and who needs to ramp things up.

The four regions and their net sales growth from Thanksgiving Eve 2019 compared to the Wednesday prior are below:

  • Midwest: 34 percent
  • Northeast: 34 percent
  • South: 33 percent
  • West: 22 percent

Clearly, there was still growth in the Western region. However, the Midwest and Northeast led the way, with the South just behind them.

We’ll have to wait to see how Thanksgiving Eve 2021 plays out. We’re still waiting on the numbers from 2020. However, Upserve’s data shows that Thanksgiving Eve remains crucial to restaurants and bars throughout America.

Image: Alena Plotnikova on Unsplash

Top