“More help is on the way.” But not for restaurants and bars.
by David Klemt
Speaking about the economic relief package, Senate Majority Leader Mitch McConnell (R-KY) struck what can be generously described as tainted altruism.
“More help is on the way,” said McConnell on the Senate floor on Sunday. He also took the time to attempt to absolve Republican leadership of any blame for the glacier-paced movement forward on relief, laying the fault at Democrats’ feet.
To be blunt, both parties have failed the American people and small businesses in terms of providing federal assistance during the pandemic.
After months of inaction on relief—with the exception of a Congressional vote in September that failed to pass in the Senate—and weeks of discussions and partisan sniping, negotiators finally managed to zero in on a bill with a strong likelihood of becoming law.
Yet sifting through remarks made by some politicians regarding pandemic relief over the course of the past several months, variants of the word “prompt” were bandied about.
If the package passes—which is expected to happen later today—members of Congress and Senate will no doubt perform self-congratulatory victory laps for finally doing their jobs after months of failing to do much of anything in the way of relief. Meanwhile, millions of Americans will continue to face life-altering challenges, reaching out for lifelines that are simply not there.
Included in the package are a number of details identified as “key” to both political parties:
- The ability for businesses that had received Paycheck Protection Program loans which had been forgiven to deduct the costs said loans covered on their federal tax returns.
- Speaking of the PPP, it will be reopened with over $284 billion intended for small businesses.
- $12 billion in available PPP funds for minority-owned and “very small” businesses.
- $15 billion made available in PPP funds specifically for independent movie theaters, live music venues, and cultural institutions like museums.
- $600 stimulus checks for qualifying adults (and each child in a household) who earned $75,000 or less in 2019. The amount would be reduced for people who earned more. Those who made $99,000 or more last year are not expected to receive a stimulus check.
- A $300 boost to unemployment benefits for 11 months, with a possible implementation date of December 27.
- Gig and contract workers enrolled in the PUA or PEUC programs can expect the same $300 boost to their benefits for 11 to 13 weeks.
- The deadline to spend billions of dollars made available to cities and states via the CARES Act is expected to be extended from the end of this year to be an entire year.
- $25 billion in emergency assistance for renters.
- A moratorium on evictions expected to be extended through the end of January.
What’s not in the package expected to be rushed through Congress? Hundreds of billions of dollars in state and local aid Democrats wanted, liability shields for corporations Republicans wanted, the $120 billion RESTAURANTS Act, or the $240 billion Restaurant and Foodservice Industry Recovery Fund.
Despite McConnell’s declaration that federal assistance is on the way, the economic relief plan leaves an industry that employs millions of American workers and contributes hundreds of billions of dollars to the nation’s GDP (four percent before the pandemic) to fend for itself.
Guy Fieri, in all seriousness, has done more for more unemployed restaurant workers than the government, raising more than $21 million in relief funds in under two months.
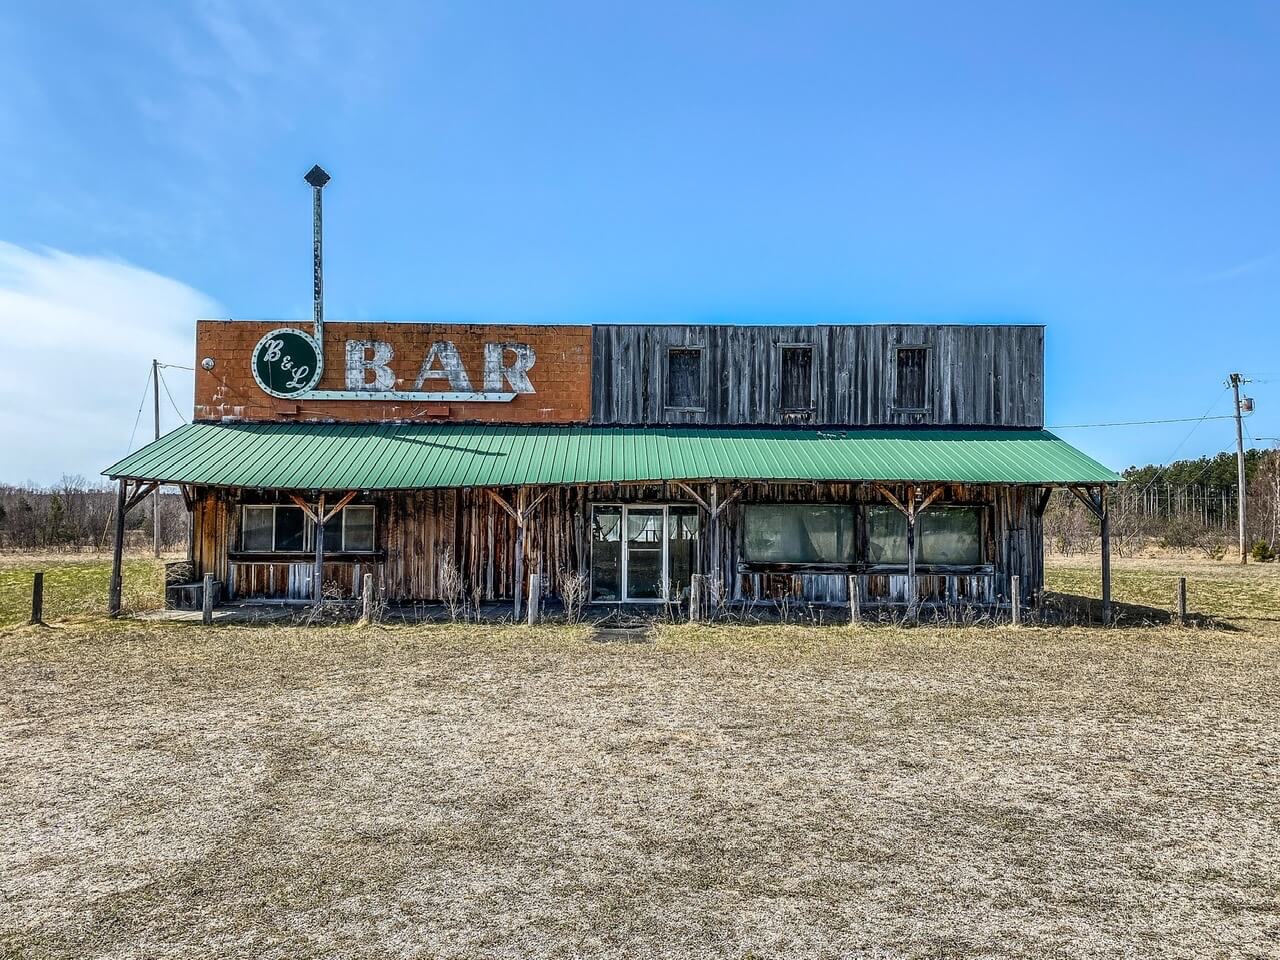
The hospitality jobs lost due to Covid-19 aren’t expected to return. With more than 110,000 restaurants closed—and counting—the economic impact will be felt nationwide and, in all probability, have global ramifications.
The PPP turned out to be an absolute farce: billions of dollars went to businesses that are anything but small by definition. There’s little reason to believe the process will improve much (if at all) this time around.
And while restaurants and bars have been crucial to nurturing community, connections and culture since inception, they’re clearly not considered culturally relevant institutions by politicians.
With Congress facing an uphill battle in terms of drafting the language for the relief bill and then voting on it, expecting our elected officials to propose, negotiate, draft and vote on a bill for the hospitality industry seems foolish. That means the earliest the industry can expect help—which seems exceedingly unlikely to ever materialize—is in late February of 2021.
Apparently restaurants, bars, and the foodservice professionals they employ aren’t key to politicians on any side of the aisle. Well, not until they need venues to host their campaign fundraisers, that is.
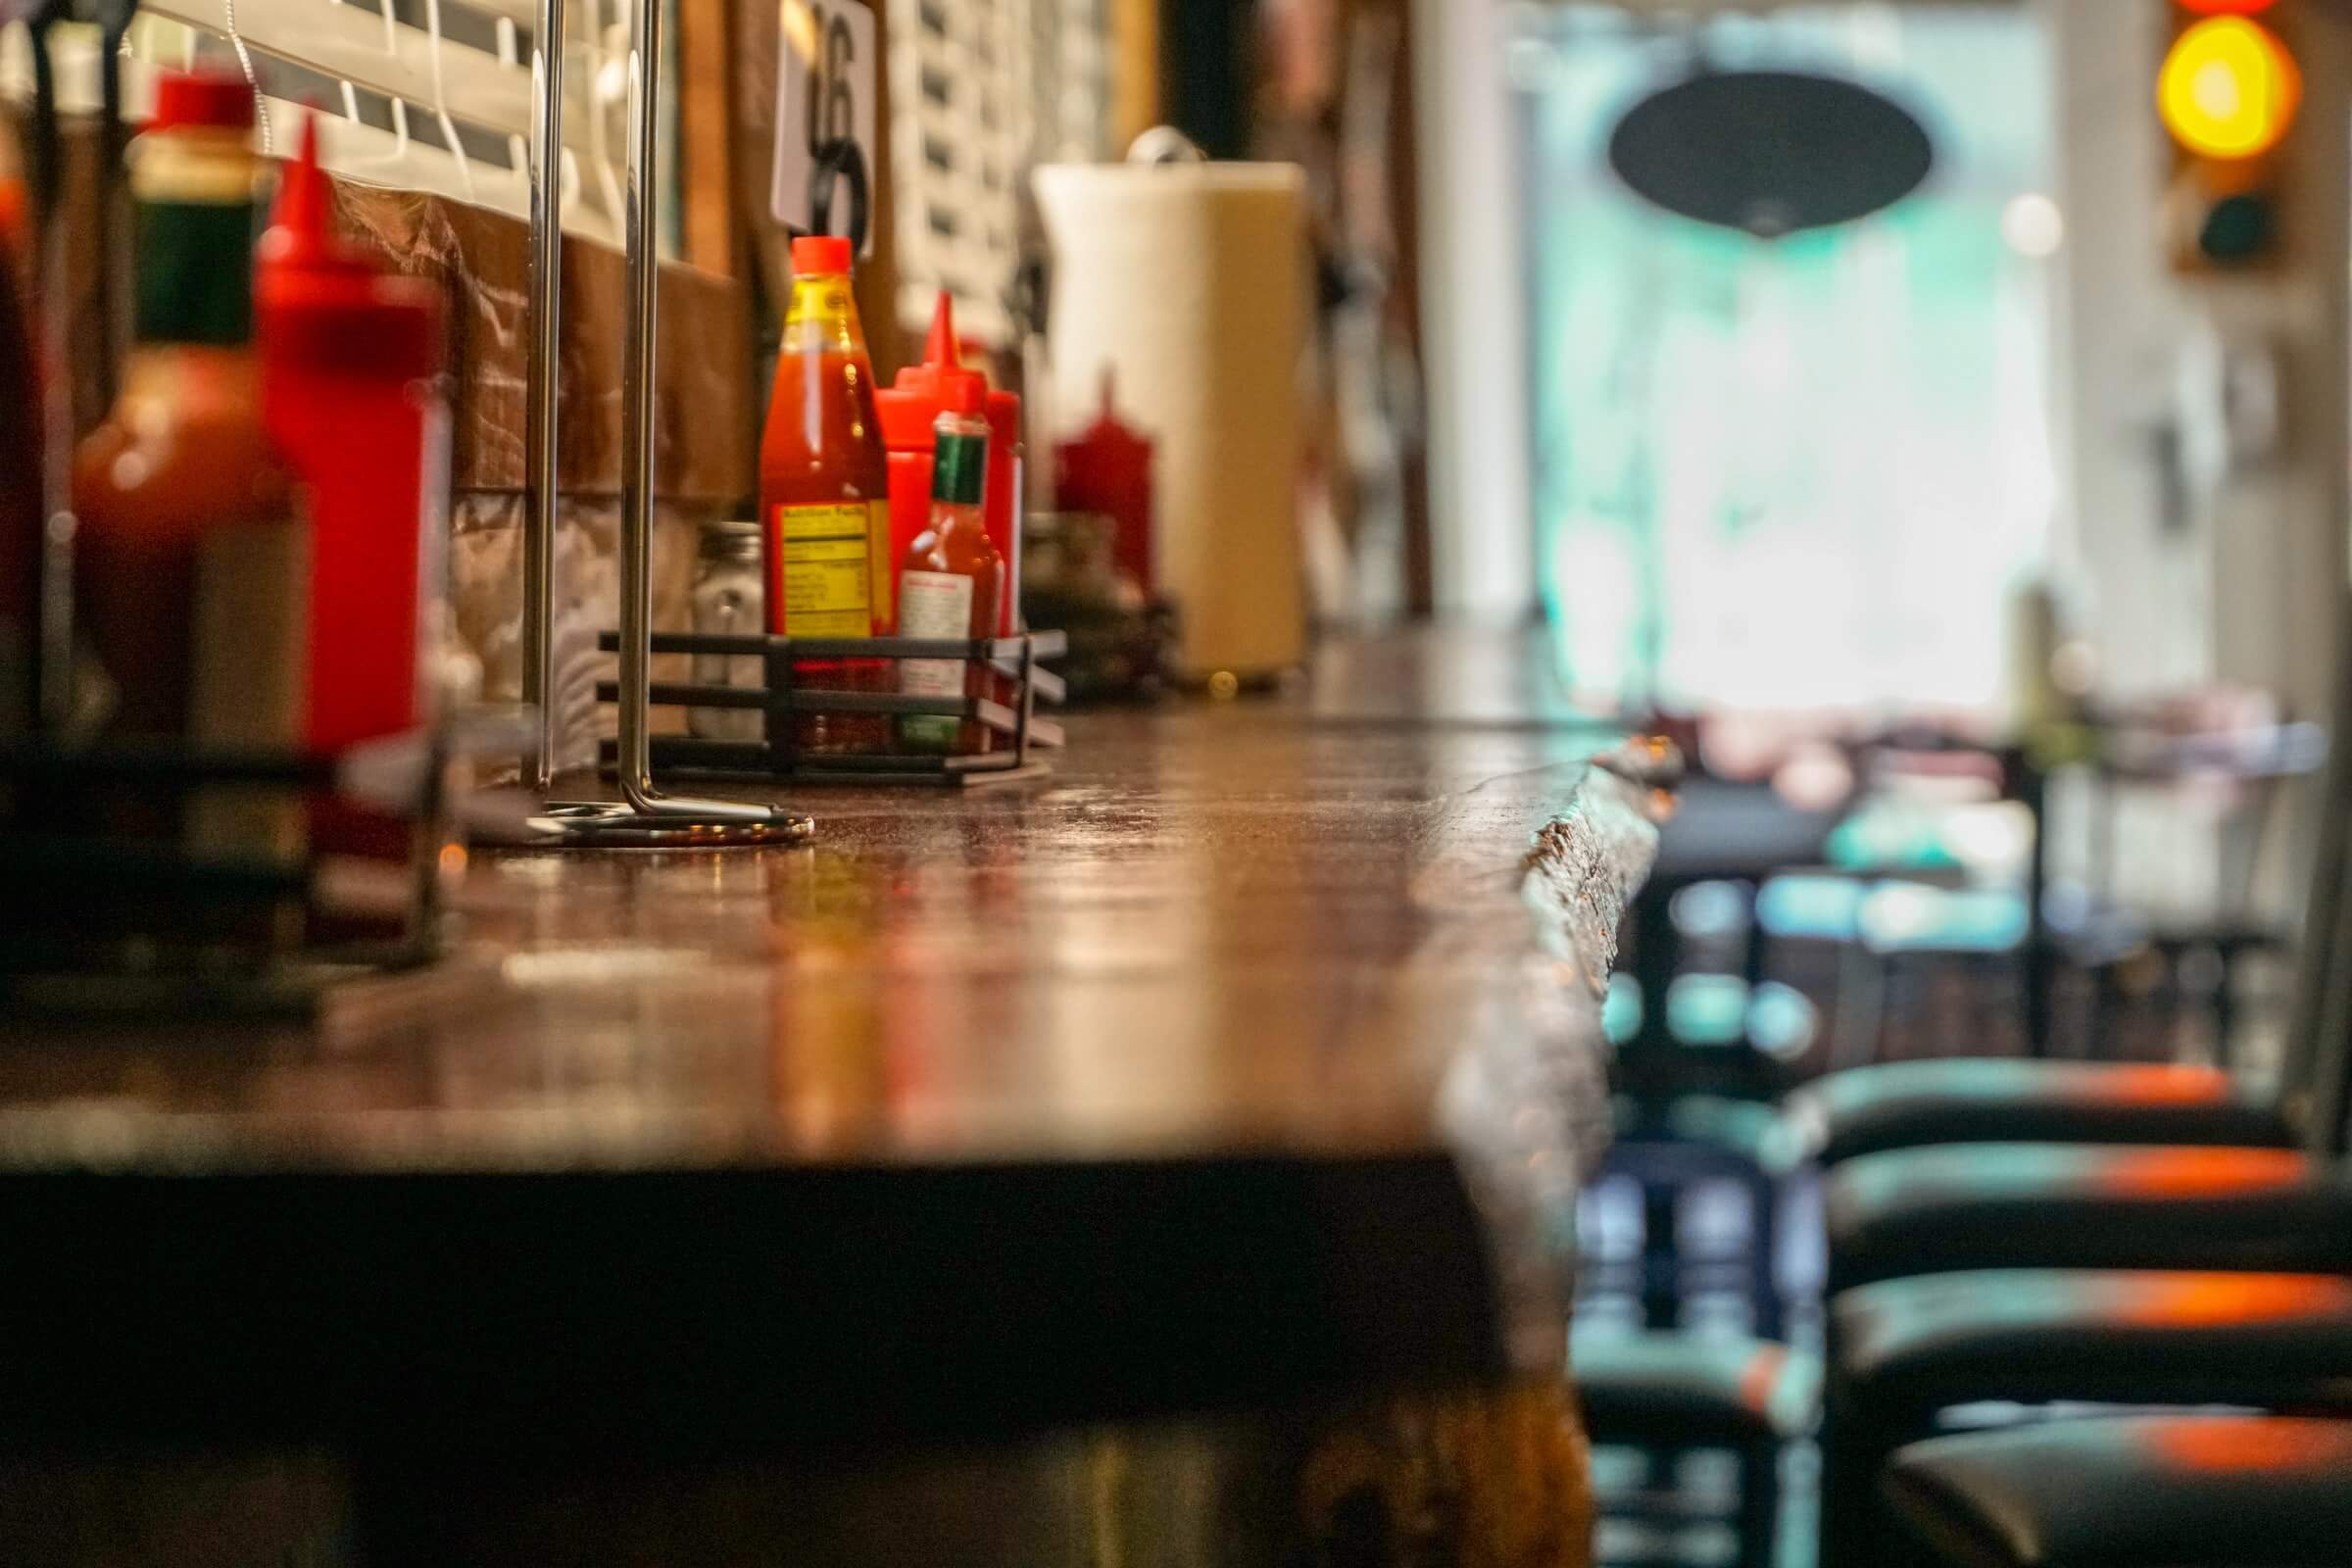
Image: Andrew Seaman on Unsplash