Ultra lounge

by David Klemt David Klemt No Comments

2022 World’s 50 Best Bars: 51-100

2022 World’s 50 Best Bars: 51-100

by David Klemt

Closeup of bartender's hand pouring shot

As we approach the ceremony to announce the 2022 World’s 50 Best Bars we now know which bars across the globe are on the 51 to 100 list.

It’s crucial to keep in mind that these are 50 of the most impressive bars not just in the US, not just in Canada, and not just in North America. Rather, these are among the absolute best bars in the world.

Of particular note, Singapore continues to prove itself as a dominant cocktail destination. There are eight bars on the 2022 51 to 100 list, and I predict that at least three more from Singapore will appear on the 1 to 50 list.

Also, the UK and Cape Town each claim four spots among the best 51 to 100 bars, and Paris boasts three. Operators, bar professionals, and tourists should keep their eyes on Cape Town as it continues to transform into a cocktail hot spot.

Among the 51 to 100 list, four are from the US and, sadly, none are in Canada. Overall, 15 bars on this list are new entries, as are five of the cities represented.

1 to 50: One Week Away

Of course, this leaves us all with a few important questions.

When will we find out about bars 1 through 50? Which bars are on that list? And which bar will be number one this year?

Well, I can answer one of those questions for you. A week from now, October 4, the World’s 50 Best Bars will announce the top 50 bars in the world during a ceremony in Barcelona, Spain.

To learn more about the World’s 50 Best Bars and this year’s ceremony, listen to Bar Hacks episode 82 with Mark Sansom. Also, make sure you’re following the World’s 50 Best Bars on Twitter and Instagram.

For now, scroll down to check out bars 51 to 100. Congratulations to the bars below!

The World’s 50 Best Bars 2022: 100 to 51

  1. Sin + Tax (Johannesburg)
  2. Tesouro (Goa)
  3. Zapote Bar (Playa del Carmen)
  4. Tag (Kraków)
  5. The Dead Rabbit (New York)
  6. The Bamboo Bar (Bangkok)
  7. Sweet Liberty (Miami)
  8. Mace (New York)
  9. The House of Machines (Cape Town)
  10. Antique American Bar (Bratislava)
  11. Republic (Singapore)
  12. Donovan Bar (London)
  13. Art of Duplicity (Cape Town)
  14. Re (Sydney)
  15. Freni e Frizioni (Rome)
  16. Danico (Paris)
  17. Le Syndicat (Paris)
  18. Bar Goto (New York)
  19. Indulge Experimental Bistro (Taipei)
  20. Lost & Found (Nicosia)
  21. Dead End Paradise (Beirut)
  22. Vesper (Bangkok)
  23. Röda Huset (Stockholm)
  24. The Court (Rome)
  25. Candelaria (Paris)
  26. Side Hustle (London)
  27. Nutmeg & Clove (Singapore)
  28. Camparino in Galleria (Milan)
  29. Three Sheets (London)
  30. Tjoget (Stockholm)
  31. La Sala de Laura (Bogotá)
  32. No Sleep Club (Singapore)
  33. Hero Bar (Nairobi)
  34. Atlas (Singapore)
  35. El Barón (Cartagena)
  36. Analogue (Singapore)
  37. Brujas (Mexico City)
  38. The SG Club (Tokyo)
  39. Tan Tan (São Paulo)
  40. Presidente (Buenos Aires)
  41. Caretaker’s Cottage (Melbourne)
  42. Schofield’s (Manchester)
  43. Mimi Kakushi (Dubai)
  44.  MO Bar (Singapore)
  45. Quinary (Hong Kong)
  46. 28 HongKong Street (Singapore)
  47. La Factoría (Old San Juan)
  48. Cause Effect Cocktail Kitchen (Cape Town)
  49. Barro Negro (Athens)
  50. Sago House (Singapore)

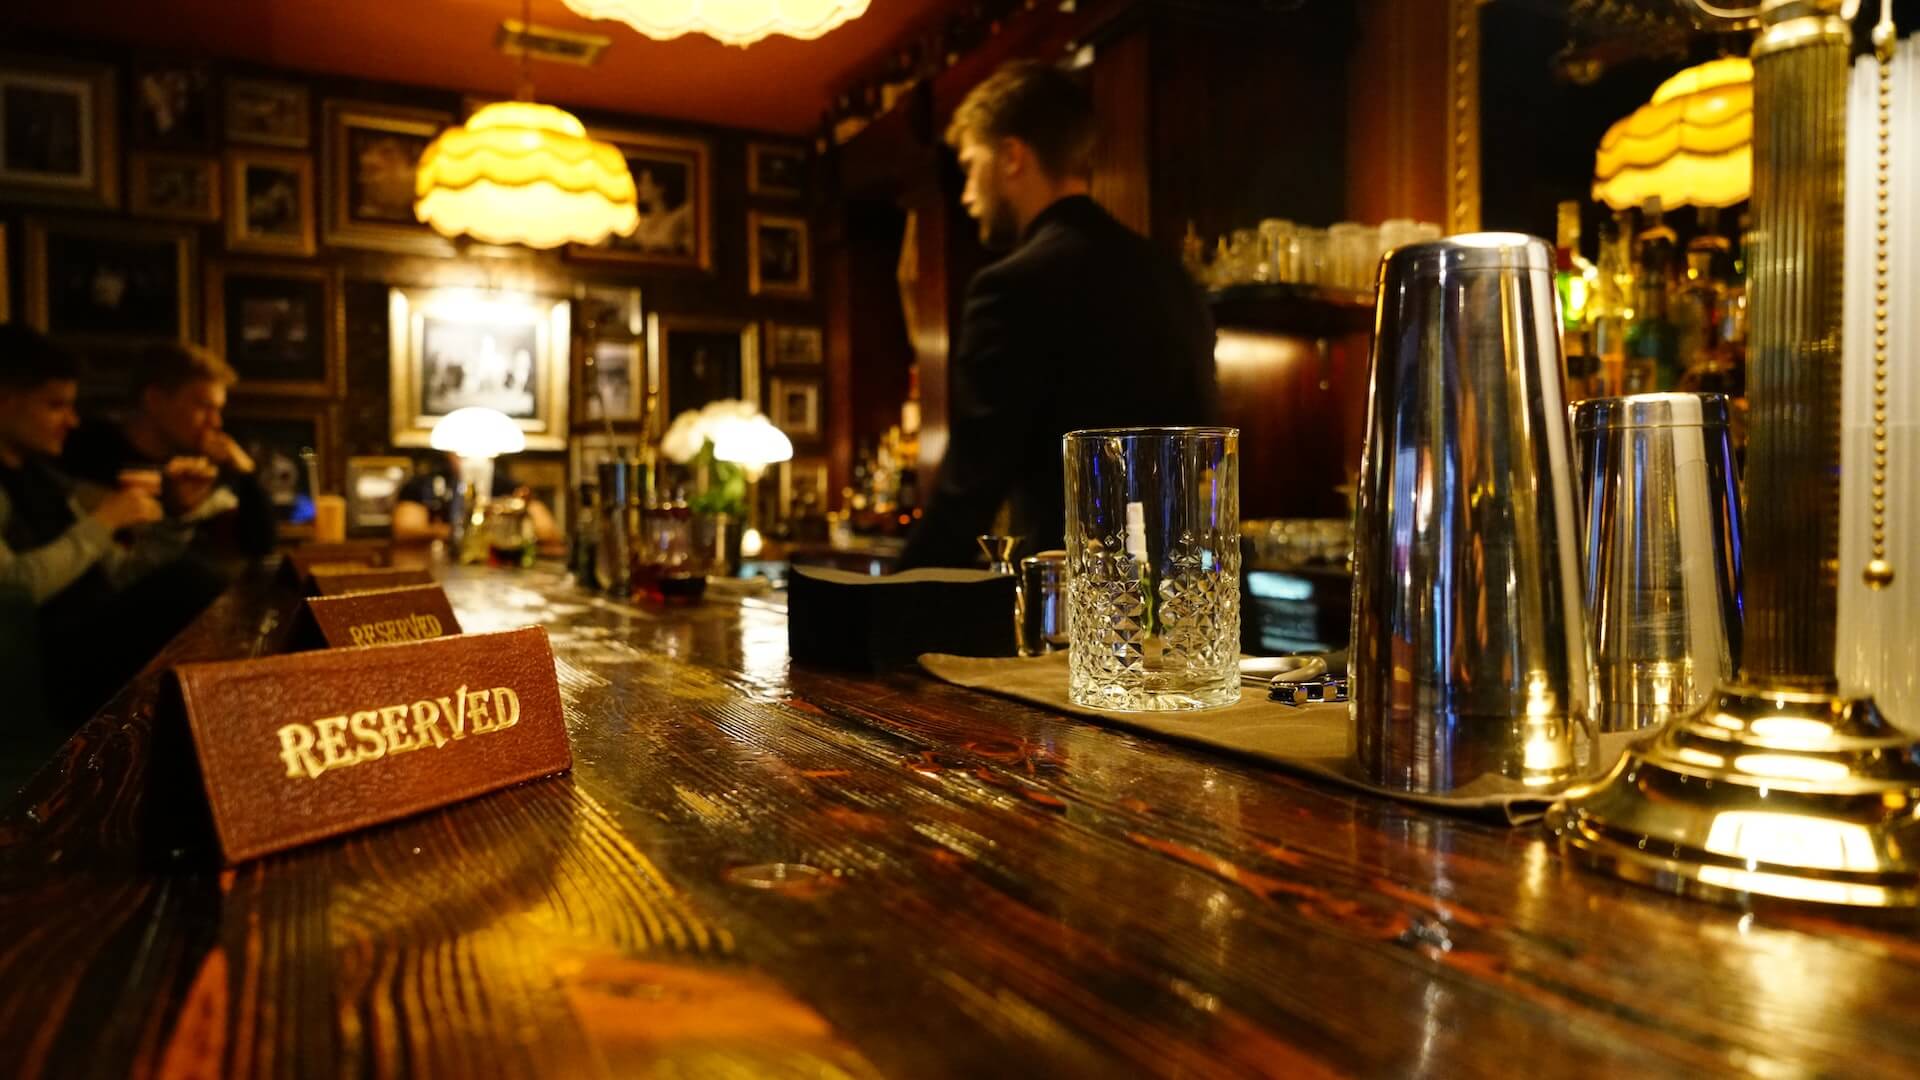
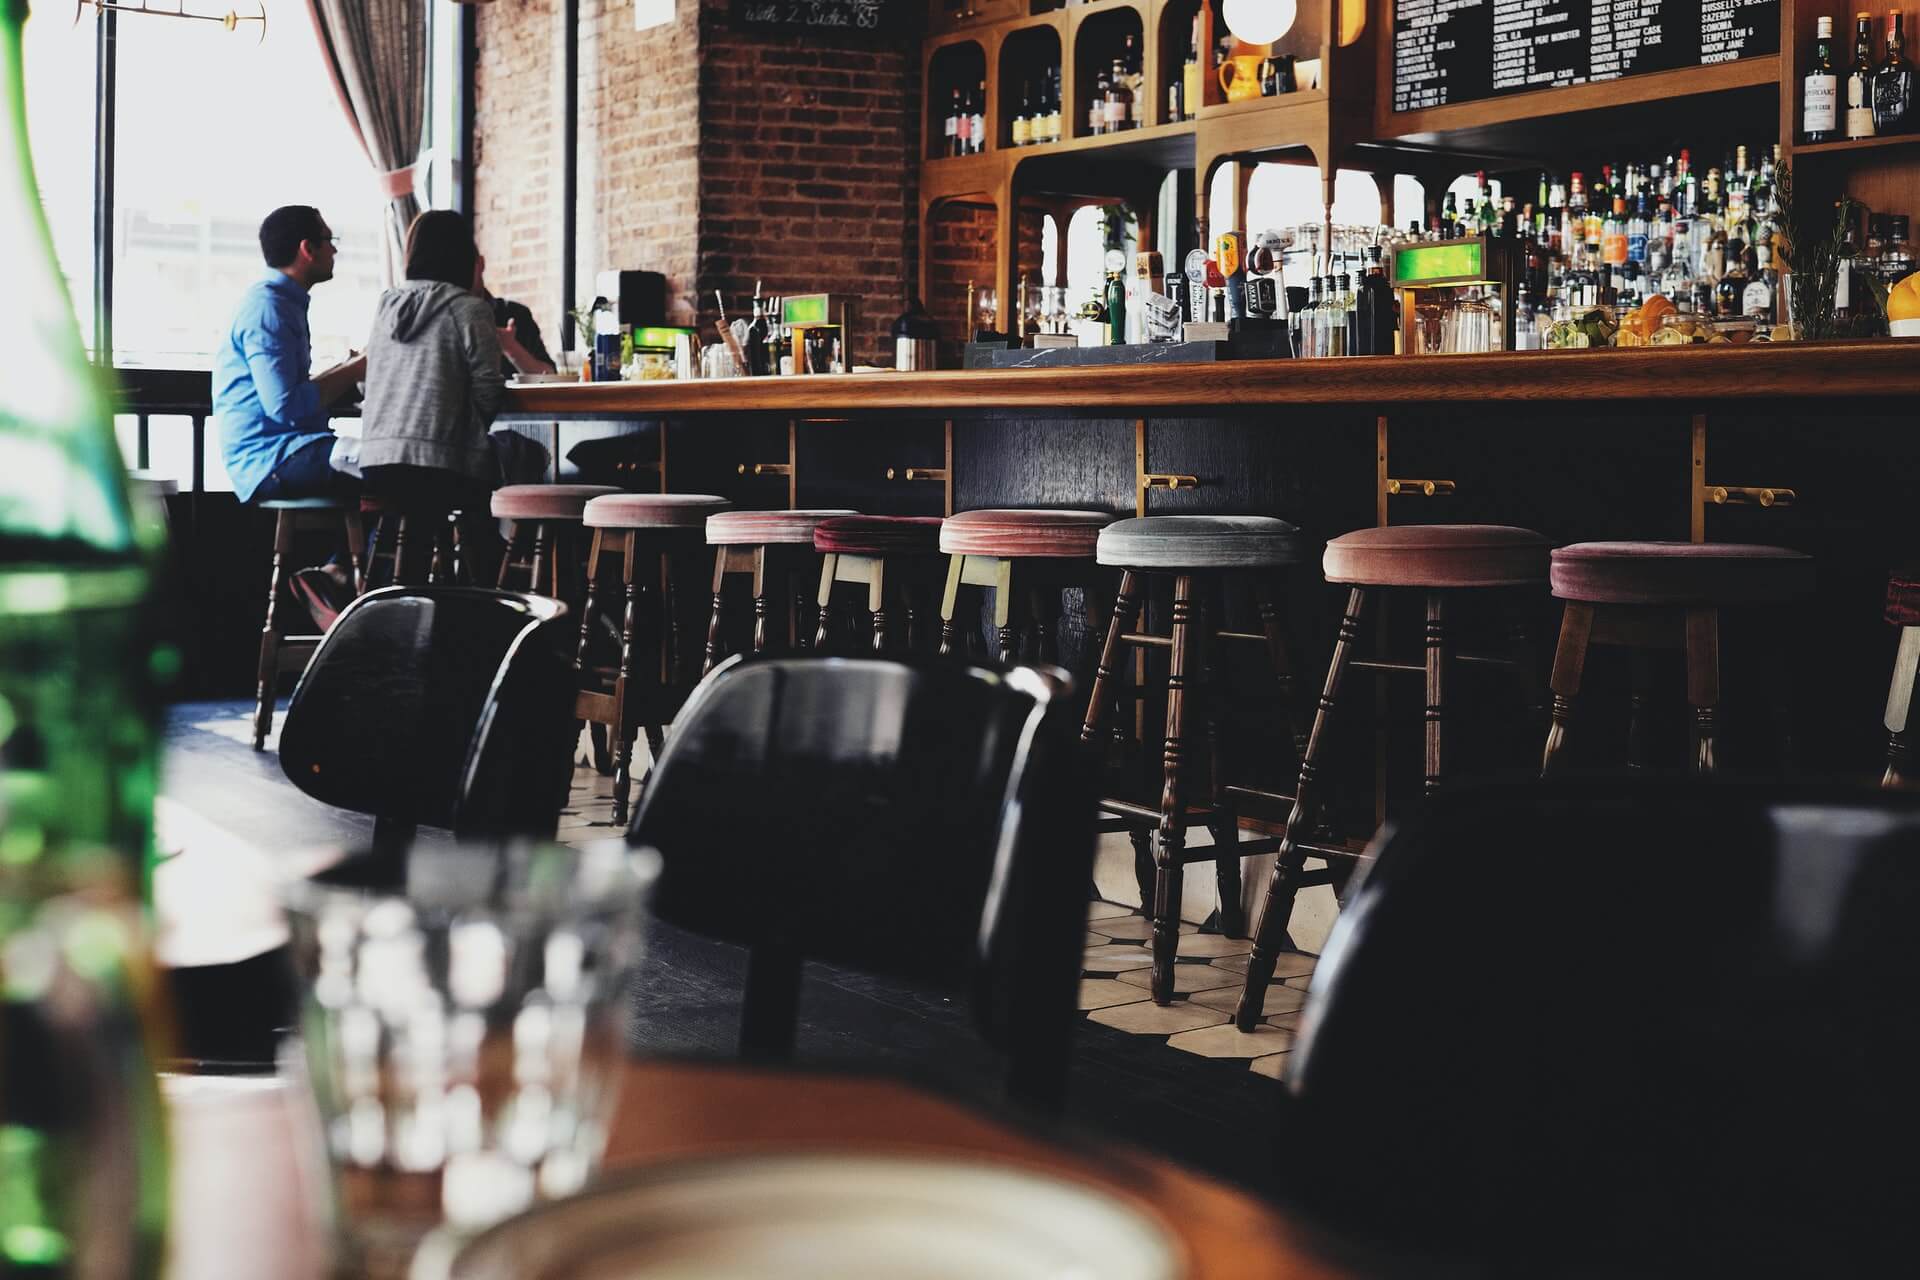
Image: Louis Hansel on Unsplash

by David Klemt David Klemt No Comments

Canada’s Restaurant Labor by the Numbers

Canada’s Restaurant Labor by the Numbers

by David Klemt

Chef inside commercial kitchen

While there are positive signs for Canada’s foodservice industry, recruiting and retaining labor continues to be a challenge.

Unfortunately, this isn’t a challenge unique to Canada. Operators throughout North America and indeed across the globe are facing labor shortages.

Restaurants Canada addresses this topic in their 2022 Foodservice Facts report. The non-profit research and advocacy group predicts sales will reach pre-pandemic levels by Q4 of this year.

However, restaurants, bars, and nightclubs may have to achieve traffic and revenue growth despite a significant labor deficit.

Please click here to access the 2022 Foodservice Facts report yourself.

Labor Shortage by Category

In their latest report, Restaurants Canada crunches the numbers for three distinct venue categories. These are quick-serve restaurants, full-service restaurants, and bars and nightclubs.

The organization finds that QSRs and FSRs are facing the greatest shortages. In fact, in response to a survey from May of this year, at least half of QSRs and FSRs aren’t operating with fulls staffs.

For QSRs, 52 percent of respondents say they perceive restaurants and bars they’ve visited to be understaffed. A bit over a third (36 percent) think staffing is “about right.” Unhelpfully, 12 percent “don’t know” if restaurants and bars have enough staff.

So, let’s switch gears to FSRs. Precisely half of survey respondends say restaurants and bars don’t have enough staff. Just like their QSR counterparts, 36 percent say that staffing seems to be at the ideal level. Fourteen percent respond that they “don’t know,” which doesn’t tell us much.

Per Canadians who responded to Restaurants Canada’s survey, bars and nightclubs are fairing better…at first. Frustratingly, a staggering 37 percent of respondents “don’t know” if bars or nightclubs have appropriate levels of staffing. Thirty-two percent think they’re understaffed, 31 percent think staffing levels are “about right.”

Industry professionals are probably already putting two and two together here. As long as guests receive the level of service they expect, from greeting to speed of service, to closing out their check, they think things are fine. If they’re made to wait longer than they want, they’ll likely say a restaurant, bar or nightclub doesn’t have enough people on shift.

Labor Shortage by Role

Okay, so the May 2022 Restaurants Canada wasn’t entirely helpful. It still provides interesting insight. That is, we know how guests perceive staffing in at least most instances.

So, let’s get down to hard numbers: shortages in specific roles throughout the industry.

Here, Restaurants Canada provides compelling information, even if it’s not what we want to see. In comparison to 2019, every role is down by thousands of people. In some cases, tens of thousands.

Below you’ll find the deficits by role:

  • Foodservice supervisors: -3,100
  • Chefs: -10,900
  • Bartenders: -17,600
  • Maîtres d’hôtel and hosts/hostesses: -21,100
  • Restaurant and foodservice managers: -22,400
  • Food counter attendants, kitchen helpers, and related support occupations: -43,200
  • Cooks: -44,400
  • F&B servers: -89,500
  • Other: -18,800

Add that up and that’s a shortage of 271,000 people throughout Canada’s foodservice industry. For further context, the industry boasted 1,265,700 workers. In 2021, the industry was down to 994,700.

Unfortunately, from 2020 to 2021, just 4,100 jobs were recovered, according to Restaurants Canada. This situation clearly shows that operators need to change their approach to staffing.

Now, more than ever, operators must focus on effective recruitment, onboarding, and retention. For tips on making improvements, click here. To learn how to implement employee surveys to boost retention and avoid costly turnover, click here.

Image: Brian Tromp on Unsplash

by David Klemt David Klemt No Comments

Restaurants Canada Reveals Pandemic Impact

Two Years On, Restaurants Canada Reveals Pandemic Impact

by David Klemt

Canon accounting calculator

Restaurants Canada looks at the impact of the pandemic on the foodservice industry in their latest Foodservice Facts report.

Canada’s foodservice industry research and advocacy non-profit sees a return to pre-pandemic operations. However, the path forward toward pre-pandemic traffic and sales levels won’t be without its challenges.

“While nominal sales are expected to return to pre-pandemic levels before the end of the year, traffic still remains below what it was before,” says Restaurants Canada president and CEO Christian Buhagiar.

To access your own copy of 2022 Foodservice Facts, click here.

Industry Still Struggling

As an owner, operator, or foodservice professional, you probably have the answer to a specific question in mind.

When will we be “back to normal?” And, of course, the natural followup to that question. Will the industry surpass 2019 traffic and sales?

Restaurants and bars throughout Canada have survived six waves of Covid-19 over the course of two-plus years. There have been an inordinate amount of lockdowns that inarguably forced the permanent closure of far too many businesses.

As Restaurants Canada states (and the rest of us know all too well), there’s no telling if another Covid-19 variant will rear its ugly head. It’s conceivable (but with any luck unlikely) that Canada could face future lockdowns.

At the moment, according to Restaurants Canada, foodservice sales are currently 11 percent below 2019 levels. And yes, that’s after adjustment for inflation. Speaking of which, one reason traffic and sales remain below those of 2019 is consumer confidence. Many Canadians are concerned about a possible recession.

In addition, operators in Canada continue to face a labor shortage.

News Not All Bad

Now, anyone who read the previous section would be justified in lacking confidence in the industry. However, there is good news.

First, let’s compare Q1 of 2022 to Q2. Per Restaurants Canada, just 15 percent of restaurants were able to seat guests with zero restrictions. By April, though, approximately 90 percent of restaurants in Canada could serve in-person guests restriction-free.

Second, Q2 had more positivity in store for operators. According to Restaurants Canada, the FSR segment endured an 18-month decline in traffic when Covid-19 took hold. When restrictions were lifted, the floodgates of consumer demand burst. By Q2, traffic was a mere one percent lower in comparison to 2019.

Going a bit granular, QSR performance also improved in Q2. Per Restaurants Canada, QSR traffic lagged eight percent behind pre-pandemic levels. However, that number improved to just two percent under pre-pandemic levels by Q2.

Compellingly, Q2 still wasn’t done with foodservice industry positivity. While QSRs outpaced FSRs three-fold in terms of traffic, their numbers combined bring the industry back to 2019 Q2 levels.

Restaurant Canada’s positive outlook predicts that the industry will return to pre-pandemic levels by Q4.

Image: StellrWeb on Unsplash

by David Klemt David Klemt No Comments

Will Virtual Kitchens Persist?

Will Virtual Kitchens Persist or Go Brick-and-Mortar?

by David Klemt

Closeup shot of double cheeseburger

Virtual kitchens and virtual brands are back in the headlines after a record-setting grand opening in Rutherford, New Jersey.

Well, I should clarify: A restaurant may now hold a specific record.

The restaurant in question is the first brick-and-mortar MrBeast Burger location. And the record it may hold claim to is most burgers sold in a single day by a single restaurant.


View this post on Instagram


A post shared by MrBeast Burger (@mrbeastburger)

Now, if you don’t spend much time on YouTube, you may not know MrBeast. So, here’s a quick rundown: He’s Jimmy Donaldson, a YouTube personality known for “expensive stunts.” In fact, he may be the pioneer of that type of content.

Right about now you may be wondering what this all has to do with virtual kitchens and brands. It’s quite simple, really. MrBeast was among the highest-profile virtual brands to launch during the pandemic.

Incredibly, MrBeast Burger boasts more than 1,700 virtual kitchen locations. And now, one brick-and-mortar MrBeast restaurant.

Leveraging Demand and Popularity

So, you’re an influential YouTube content creator with tens of millions of subscribers. Obviously, your channel is monetized. What else can you do to leverage your popularity?

Well, if there’s a pandemic crippling the globe and people are stuck at home, maybe you notice the demand for takeout and delivery. And perhaps you learn about something known as a “virtual kitchen.”

If you’re a foodie or maybe just a savvy businessperson, maybe you’d jump into the virtual space. It is, it goes without saying, much less expensive than opening your own restaurant. And if you perform well, that’s an excellent way to collect data and guest feedback.

Also, an efficient way to hone your brand without a lease, buildout or the overhead of a physical restaurant. In a way, a virtual brand is akin to a pop-up restaurant, only you can test hundreds of markets simultaneously.

Okay, so now let’s say you reach a rare milestone in the creator space: 100 million subscribers. MrBeast did just that in July of this year. Do you think you’d want to leverage the support of millions of fans willing to support you and your brand?

The first physical MrBeast Burger opened last week at the American Dream mall in New Jersey. Reports claim that over 10,000 people waited in line for the grand opening.

Oh, and that’s when the location may have claimed the aforementioned record: 5,500 burgers sold in one day. After just one day of operation, MrBeast wondered if the brand should franchise:

Virtual to Physical

This (potential) record-setting event brings virtual kitchens and brands back into the spotlight.

Of course, most virtual brands don’t have the same origin story as MrBeast. One hundred million supporters? That’s rarified air.

At any rate, virtual kitchens do offer potential physical restaurant operators a less expensive method of testing their concepts. Couple data collection and feedback with an accurate feasibility study and taking the next step may make sense. And it may make a tidy profit.

It’s possible we’ll see MrBeast franchise off the success of two years of operating virtually and opening a physical location. And it’s possible we’ll see other virtual brands expand beyond the virtual kitchen.

However, it’s important that virtual brand owners keep a few things in mind. One, online success doesn’t always translate to brick-and-mortar success. Two, the restaurant space doesn’t care about your subscriber count—the KPIs are entirely different here. Three, potential operators need to perform the proper studies—or retain an agency with experience performing them—rather than rushing into the restaurant space.

It’s highly likely we’ll see more virtual brands enter the physical restaurant world. How many will do so successfully remains to be seen.

Image: Eiliv-Sonas Aceron on Unsplash

by David Klemt David Klemt No Comments

Addressing Substance Abuse in the Industry

Restaurant Business Articles Address Substance Abuse

by David Klemt

Two full shot glasses on a bar

Two revealing Restaurant Business articles paint a startling picture of the industry’s struggles with drug and alcohol abuse.

Unfortunately, the subject of substance abuse in restaurants and bars isn’t new. This has long been a pervasive, prevalent issue in the hospitality industry.

There are, as Restaurant Business authors point out, several reasons our industry continues to grapple with substance abuse.

Since we’re nearing Sober October, this topic’s importance seems particularly poignant. Of course, the health of hospitality industry professionals should always be a paramount operator concern every day. It shouldn’t take a specific month for us to address this issue, just to forget about it after 31 days of consideration.

Hospitality workers should feel supported by the business owners and operators for whom they work. Additionally, they should feel safe among the leadership team and their fellow team members. In part, this feeling of security and safety should manifest in being comfortable speaking about substance abuse in the workplace.

A significant element of creating a supportive, safe, and healthy culture is removing the stigma of struggling with substance abuse that persists today. How can operators, leadership, and team members help one another if they make peers feel shame for struggling with drugs or alcohol?

A crucial step toward addressing the issue of substance abuse is fostering a culture of respect, support, and safety. If anyone in any role—from ownership and leadership to front of house and back of house—feels as though they can’t speak with someone safely about their struggles, we can’t address this topic effectively. And if we can’t address it in a meaningful way, we can never effect real change that can improve and save lives.

Pervasive Struggles

A Restaurant Business article from last week addresses substance abuse and culture. “How Restaurants Feed a Culture of Substance Abuse” reveals disturbing statistics.

At the start of their article, editors Peter Romeo, Heather Lalley and Joe Guszkowski share a horrific story. In February of this year, Colorado law enforcement found six adults and a toddler in an apartment. The six adults had all overdosed on fentanyl-laced cocaine; five had died. All six adults worked in chain or independent restaurants.

Four years ago, Delaware officials investigated the state’s opioid crisis. They found 10 percent of Delaware residents who died due to opioid overdoses were foodservice workers. According to Restaurant Business, state officials concluded that foodservice experienced a higher rate of opioid deaths than any other industry.

Among the most-shocking revelations in the Restaurant Business article pertains to the US workforce as a whole. Frustratingly, the US government hasn’t researched illicit drug use in the workforce since 2015. So, for all we know, the numbers I’m about to share have either increased or decreased.

In a typical month in 2015, 8.6 percent of the US workforce was using illicit drugs. However, that number pales in comparison to the rate of illicit drug use among restaurant and hotel workers: 19.1 percent.

Examining Substance Use Disease (SUD), a term encompassing drug and alcohol abuse, the numbers expose the weight of our industry’s struggle. In 2015, 9.5 percent of the US workforce suffered from SUD. For restaurants and hotels? That number was nearly double: 16.9 percent, higher than any other industry.

Fentanyl Deaths

Restaurant Business Editor-in-Chief Jonathan Maze reveals how “restaurants are ground zero” for fentanyl overdoses.

Fentanyl is cheap to produce and transport. It doesn’t take much to be deadly. And most people who have the misfortune of consuming it do so unwittingly. As it turns out, drug dealers lace all manner of other drugs with it because it’s so powerful. So, cutting drugs with fentanyl is more “cost effective” for drug dealers.

This particular excerpt from Maze’s “As Fentanyl Deaths Soar, Restaurants Are Ground Zero” is startling: “Throughout the country, restaurants and bars are such common places for overdose deaths among customers that advocates are training bartenders and servers to administer Narcan, a medication used to treat opioid overdoses. They are also becoming sources for fentanyl test strips so customers can see if the drugs they’re taking are laced with the powerful drug.”

Further, this troubling excerpt: “The fentanyl epidemic is particularly troublesome in the restaurant industry given the generally high rate of drug use among workers. Restaurant work is notoriously intense. The hours are long and late, and employees are on their feet all day. They often get hurt on the job and can turn to painkillers, legal or otherwise.”

When I say that we need to address substance abuse in our industry to save lives, I’m not employing hyperbole. I mean it quite literally.

Please take the time to read these two Restaurant Business articles in their entirety. We need to take action today.

Image: cottonbro via Pexels

by David Klemt David Klemt No Comments

Swipe Fees Cost Over $77 Billion in 2021

Swipe Fees Cost Merchants Over $77 Billion in 2021

by David Klemt

Close up of stack of credit cards

A bill that intends to lower the credit card fees merchants pay by creating more competition within the industry is before Congress.

This bill, the Credit Card Competition Act of 2022, has bipartisan support. The two sponsors behind it are Sens. Richard Durbin (D-IL) and Richard Marshall (R-KS).

Of particular note, the bill seeks to amend the Electronic Fund Transfer Act. Specifically, the amendment targets the networks that merchants use to process electronic credit card transactions.

In short, banks that issue credit cards would have to merchants at least two processing networks. According to experts in this space, the bill prohibits banks from making those networks Visa and MasterCard.

Billions in Fees

So, why are Visa and MasterCard in the crosshairs of this bill?

According to the Merchants Payments Coalition (MPC), Visa and MasterCard control 87 percent of credit (and debit) card markets. Per the MPC, Visa and MasterCard account for about 576 million credit cards.

In the U.S. alone, transactions amounted to $3.49 trillion in 2021. Eye-wateringly, those transactions were accompanied by $77.48 billion in merchant fees for the two processing behemoths in the same year.

For additional context, Visa and MasterCard swipe fees totaled $61.6 billion in 2020. That represents an increase of 137 percent over the decade prior. Adding the merchant fees for all cards, the 2020 total was $110.3 billion, which is an increase of 70 percent from the previous ten years.

As veteran operators are well aware, swipe fees are among the highest costs for restaurants and bars.

Merchants Payments Coalition Sends Letter to Congress

Compellingly, the MPC is urging Congress to investigate the Visa-MasterCard duopoly. In their view, the two processors’ dominance is stifling competition; harming business owners and consumers; and contributing to inflation.

“The two giant card networks and their partner mega-banks routinely use their market power to stifle competition and charge merchants the highest swipe fees in the industrialized world,” reads the MPC’s letter to Congress.

Further, the letter states, “It is difficult to imagine any other market in the U.S. economy in which two entities set prices for thousands of businesses that should be competitors. That lack of competition or downward pricing pressure has resulted in out-of-control swipe fees and increases inflation throughout the economy.”

The MPC is urging Congress to act quickly and effectively: “It is crucial for Congress to act swiftly and implement real reforms to bring true competition, transparency and equity to the U.S. payments market.”

National Restaurant Association Supports the Bill

Interestingly, the National Restaurant Association says they’re working with the MPC.

The NRA is also working with other organizations to drum up support for the the Credit Card Competition Act of 2022.

You can read about their support for the bill on their website. Additionally, you can tell Congress to pass the bill here. As it stands currently, no action beyond the bill’s introduction to the Senate on July 28 has taken place.

Image: Pixabay

by David Klemt David Klemt No Comments

5 Books to Read this Month: September 2022

5 Books to Read this Month: September 2022

by David Klemt

Flipping through an open book

This month’s engaging and informative book selections will help you develop next-level leadership skills and dial in your drink menu.

To review August’s book recommendations, click here.

Let’s jump in!

Your Restaurant Culture Sucks!: Stop surviving. Start thriving. Escape mediocrity

Donald Burns, the Restaurant Coach and friend of KRG Hospitality, completes his Your Restaurant Sucks! trilogy. For the third book in the self-improvement and hospitality industry leadership series, Burns tackles culture.

In Your Restaurant Culture Sucks!, Burns helps owners, operators, and leadership team members understand the importance of workplace and company culture. Instead of complaining that “nobody wants to work anymore,” look inside and find out why perhaps nobody wants to work for you. That kind of honesty helps implement real change, change that sets you apart and improves recruitment, hiring, and retention.

“All restaurants can buy from the same vendors and hire from the same labor pool. What separates the good, from the great to the outstanding is culture!”

Subtract

Sometimes changing our outlook and improving our leadership skills is about streamlining.

“We pile on ‘to-dos’ but don’t consider ‘stop-doings.’ We create incentives for good behavior, but don’t get rid of obstacles to it. We collect new-and-improved ideas, but don’t prune the outdated ones. Every day, across challenges big and small, we neglect a basic way to make things better: we don’t subtract.”

With Subtract, Leidy Klotz explains how changing how we approach solutions can be life changing. Maybe we need to stop adding and start subtracting to improve our strategies.

Cure: New Orleans Drinks and How to Mix ’Em from the Award-Winning Bar

If you travel to New Orleans and you’re in this industry, you probably make sure to include Cure on your itinerary. For more than a decade this 2018 James Beard Award winner (Outstanding Bar Program) has been integral to the city’s craft cocktail scene.

Whether you’re after a deceptively simple beer and shot or a cocktail made with a rare, allocated bourbon, Cure is there to elevate your French Quarter visit. And soon you’ll be able to bring Cure home with you, and to your restaurant or bar as well. Available now for preorder, Cure includes 100 cocktail recipes that tell the tale of NOLA from past, present, and future.

Craft Beer Design: The Design, Illustration and Branding of Contemporary Breweries

Anyone who pauses to consider beer can design knows that it’s becoming nearly as important as the liquid. With thousands of breweries all over the US alone, how does a brewer stand out? How does a small, independent craft brewer grab a potential new customer’s attention in a sea of options? In part, through their can designs. Of course the beer itself is crucial and the most important element. However, a consumer has to be motivated to try a beer before they learn how good it tastes.

Craft Beer Design dives deep into craft beer design, featuring real-world examples and interviews with the designers themselves.

Think Again: The Power of Knowing What You Don’t Know

Curiosity keeps us learning. The pursuit of knowledge keeps us sharp. Learning helps us improve ourselves, our leadership, and our operations. The belief that we’ve learned all there is to know, however, prevents us from learning to our own detriment.

Much like Subtract teaches us how to remove rather than add, Think Again proposes a new approach: unlearning and rethinking. Why do we get defensive when we’re wrong? Why are we so afraid of challenges to long-held beliefs? Admitting when we’re wrong and seeking facts is a strength, not a weakness.

Image: Mikołaj on Unsplash

by David Klemt David Klemt No Comments

Date Night Desires and Dealbreakers

Date Night Desires and Dealbreakers

by David Klemt

Reserved seats at a bar

Focusing on date night, guest experience and retention tech platform SevenRooms is sharing their latest data-driven report.

Their “Date Night Diner Report” is another successful collaboration with YouGov. Previous reports from this partnership include:

One of the reasons we at KRG Hospitality appreciate and recommend SevenRooms is their dedication to data. The platform’s commitment to sharing the data they collect to the benefit of operators is impressive.

“A resurgence of the American date night is here, and these date night diners are flipping the script on what that experience should look and feel like,” says Allison Page, co-founder and chief product officer at SevenRooms.

So, operators who want to succeed with date night should review this new report. In fact, all operators would be wise to read this report. After all, it addresses reservations, waitlists, walk-ins, and much more.

Released today, this brand-new report can be downloaded here. Read the press release here.

Date Night Details

A lot has changed over the past two-plus years. What hasn’t changed are the two most popular date nights in the US: Friday and Saturday.

Both Friday and Saturday night are preferred by 26 percent of the 763 survey respondents who go on dates. In total, SevenRooms and YouGov surveyed 1,153 individuals.

Generally speaking, these dates are return visits. People who go on dates tend to make reservations at restaurants they’ve dined at previously.

However, 46 percent of such guests are open to reserving a table at a restaurant they haven’t visited before. And speaking of those tables reservations, 53 percent are for two people.

Looking at two major populations, tables for two are the most popular reservations. In New York, they account for 50 percent of reservations. That number increases to 56 percent in Los Angeles.

Interestingly, however, is this bit of date: 53 percent of Americans don’t make reservations for date night. Rather, they’re walk-in guests, meaning they’ll likely become waitlist guests.

Date Night Desires

So, now operators know that the majority of today’s date-night reservations are for two. That doesn’t mean setting aside two-tops and side-by-side seats at the bar is enough for success.

No, there are also guest expectations to consider. SevenRooms identifies the following as the top date-night desires:

  1. A complimentary cocktail or dessert. (33 percent)
  2. Ability to earn extra rewards (24 percent), highlighting the value of loyalty programs.
  3. Incentives that encourage repeat date-night visits. (23 percent)

Furthermore, personalization continues to be a key factor in the dining decision. One-third of guests consider the ability to personalize their dining experience more important than factors such as menu variety or receiving their order quickly.

Date Night Dealbreakers

Of course, if there are desires there are also dealbreakers.

According to SevenRooms, the following are the dealbreakers operators must avoid:

  1. People on a date receiving their meals at different times. In this case, more than ten to 15 minutes apart. (45 percent)
  2. The restaurant being so loud the guests on their date can’t hold a conversation. (43 percent)
  3. A restaurant not having the menu items the guests were looking forward to ordering. (31 percent)
  4. Being sat too close to another table. (31 percent)
  5. Sitting next to a table speaking “too loudly.” (26 percent)
  6. The restaurant being so crowded that a guest can’t find their date. (24 percent)

How important is it to avoid these dealbreakers? Well, the survey respondents say they won’t return to a restaurant if they experience any of them.

To read the full report, click here. And to learn more about SevenRooms, listen to Bar Hacks episode 24, featuring SevenRooms CEO Joel Montaniel.

Image: Dmitri Nesteruk on Unsplash

by David Klemt David Klemt No Comments

Are You Surveying Your Team?

Are You Surveying Your Team?

by David Klemt

Interesting "Information" typography

Successful recruitment is only one element of overcoming the current labor shortage—retention is another crucial element.

In fact, employee turnover can be incredibly costly. According to the Center for Hospitality Research at Cornell, employee turnover costs nearly $6,000 per hourly team member.

Now, consider what it costs to hire a single employee. On average, it costs $3,500 to hire that worker in the first place. So, the math is simple: Losing an employee costs an operator more than hiring one.

Unsurprisingly, turnover cost more than doubles—nearly $14,000—for a restaurant manager. In short, employee retention is arguably more important than recruitment and hiring.

Labor Shortage

Per Datassential, 33 percent of 801 survey respondents say the labor shortage is their greatest challenge in 2022. More than 70 percent of those respondents are independent operators.

However, independent, chain, and franchise operators appear to agree on one particular element of the challenge. Across segments, hiring hourly back-of-house employees is the most difficult.

In fact, Datassential’s latest FoodBytes report states that restaurants are coming up short in the kitchen. Two-thirds of restaurants are struggling to fill open hourly cook positions.

So, what’s the solution? Higher starting wages? Bonuses for remaining in role for 90 days? Benefits like health insurance and a 401K?

Each of those does work—for recruitment and hiring. What keeps a new hire from leaving after 90 days with their bonus cash, heading down the road to the next restaurant or bar?

It’s commonly agreed that the first 90 days of a new hire’s employment are the most crucial. Wages and benefits keep them in role for roughly three months. During that time, they’re deciding if their role and the employer’s culture are for them.

Employee Engagement

If you’re an owner, operator, or member of the leadership team, you know the importance of data. In fact, you should be obsessed with data collection and analysis.

Truly, the best way to make decisions that will impact the business is with information. Guesswork just doesn’t cut it. Yes, you should pay close attention to your “gut.” However, you should avoid acting on gut instincts before analysing the relevant data.

Wisely, many operators encourage their guests to complete satisfaction surveys. After all, their feedback is crucial to the success of any business. But what about employee surveys? Your team is equally as important as your guests.

Unhappy team members, unhappy guests. Unhappy guests, reduction in traffic. Team members fleeing your business? Your guests pick up on turnover. Eventually, you won’t have a business.

Now, you can assume your team is happy. You can feel like your leadership team is ensuring employee satisfaction and engagement. Or, you can know.

How do you know? You ask.

Satisfaction Surveys

Call it a satisfaction survey, call it a happiness survey… Either way, you’re asking your team members how happy they are with you and their role.

Operators will likely want to keep these surveys anonymous. Several sources that address employee surveys claim most employees prefer anonymity. Unfortunately, this is due to a fear of retribution from ownership or the leadership team.

Even with a healthy workplace culture, anonymity is probably the best for these surveys. Of course, if you’re implementing a 90-day happiness survey for new hires, anonymity doesn’t make much sense.

As far as company-wide survey frequency, there are several options. Once per year is obviously the bare minimum. Therefore, it’s not very effective. Every six months is better but is checking in on your team’s happiness twice per year enough?

The sweet spot appears to be quarterly surveys. More than that—monthly or bi-monthly—will likely get annoying.

Survey Questions

Below are a few questions to consider for your surveys. You’ll have to decide if you want to use multiple-choice, yes or no, matrix, or open-ended questions, or a mix of each type.

Another consideration is how your team will access the survey. The process needs to be as painless as possible. So, consider pushing a link via your scheduling platform, text, or QR code.

  • How happy are you working here?
  • How happy are you in your current role?
  • Would you recommend us to friends and family as a good place to work?
  • Does the leadership team make you feel valuable?
  • Do you see yourself working here a year from now?
  • Are we helping you succeed in your role?
  • Are we giving you what you need to progress in your career?

Image: Roman Kraft on Unsplash

by David Klemt David Klemt No Comments

Datassential’s State of the Operator 2022

Datassential’s State of the Operator 2022

by David Klemt

Guests sitting at the bar inside a restaurant

The latest addition to the Datassential FoodBytes research series shares insights into the top three challenges most—if not all—operators are facing.

Now, some of what the report reveals paints a bleak picture. Inflation, the labor shortage, and supply chain issues persist even past the midway point of 2022.

However, operators are a tenacious and innovative group of business owners. Of course, that tenacity seems to manifest in people thinking this industry can weather any storm. That perception can come at operators’ detriment. Exhibit A: The Inflation Reduction Act of 2022 not including replenishing of the RRF. But, I digress.

“The State of the Operator & the Road Ahead,” which you can download here, is helpful and informative. As you may be aware, we’re fans of Datassential and their FoodBytes reports. In fact, you can find our synopses of FoodBytes reports here and here.

Below are some key points that operators should be aware for consideration. I strongly urge you to download this free report today.

Operator Outlook

First, let’s take a look at traffic. As Datassential points out, some hospitality business segments are performing better than others currently.

In large part, this is due to two factors: People working from home, and people returning to travel. So, operators who rely heavily on commuters and in-person workers are struggling. On the other hand, operators inside or around hotels are, per Datassential, performing the strongest at the moment.

Interestingly, though, nearly half of operators (47 percent) are seeing an increase in traffic in comparison to pre-Covid levels. Fourteen percent of operators are reporting no change in traffic. Unfortunately, traffic is lower for 39 percent of operators.

Next, sales. In comparison to pre-Covid times, more than half (51 percent) of operators report an increase. Again, 14 percent of operators are experiencing no change. But 35 percent of operators are experiencing a decrease in sales.

Finally, profit margins. Half of operators may be seeing increases in traffic in sales, but profit margins are taking a hit. On average, the industry’s profit margin is now hovering at 13 percent. That’s an eight-percent drop in comparison to pre-Covid levels.

Segment Performance

The findings regarding profit margins are likely to be the most alarming to operators. Historically, our industry has operated on razor-thin margins for decades. Dropping from an average of 21 percent to 13 is concerning.

However, context is important. The segments seeing the lowest profit margins in 2022 are: Business & Industry (B&I), Healthcare, and Colleges & Universities (C&U). Again, remote work (and learning) are largely responsible for those particular segments watching their profit margins tumble.

The strongest performers are: Quick-Service Restaurants (QSR) at 17 percent; Fast Casual at 15 percent); and Midscale, Casual Dining, and Fine Dining, each at 13 percent. Lodging is just below the current average at 12 percent.

Operator Adaptation

Inflation, rising food costs, supply chain issues, labor shortages… Operators are finding ways to cope, and in some situation, thrive.

Unsurprisingly, the vast majority of operators are increasing menu prices. In the past 12 months, 77 percent of operators have raised menu prices at least once.

These increases range from one percent a staggering 30 percent. However, the majority have kept these increases to one to ten percent. Most (31 percent) have implemented increases of no more than five percent. Just one percent of operators boosted prices between 25 to 30 percent.

Of course, raising prices isn’t the only strategy operators have at their disposal. Forty percent of operators are streamlining their menu, reducing the sizes of their menus. However, it’s wise for operators to review their menus at least every three months to eliminate poor performers.

Other strategies include focusing on value for guests (27 percent); utilizing LTOs and launching new menu items (26 percent); eliminating a specific daypart or portion of the menu (25 percent); and making portion sizes small, or “shrinkflation” (18 percent).

There’s much more revealed in Datassential’s latest FoodBytes report. Download your copy today.

Image: Luca Bravo on Unsplash

Top