Ultra lounge

by David Klemt David Klemt No Comments

Swipe Fees Cost Over $77 Billion in 2021

Swipe Fees Cost Merchants Over $77 Billion in 2021

by David Klemt

Close up of stack of credit cards

A bill that intends to lower the credit card fees merchants pay by creating more competition within the industry is before Congress.

This bill, the Credit Card Competition Act of 2022, has bipartisan support. The two sponsors behind it are Sens. Richard Durbin (D-IL) and Richard Marshall (R-KS).

Of particular note, the bill seeks to amend the Electronic Fund Transfer Act. Specifically, the amendment targets the networks that merchants use to process electronic credit card transactions.

In short, banks that issue credit cards would have to merchants at least two processing networks. According to experts in this space, the bill prohibits banks from making those networks Visa and MasterCard.

Billions in Fees

So, why are Visa and MasterCard in the crosshairs of this bill?

According to the Merchants Payments Coalition (MPC), Visa and MasterCard control 87 percent of credit (and debit) card markets. Per the MPC, Visa and MasterCard account for about 576 million credit cards.

In the U.S. alone, transactions amounted to $3.49 trillion in 2021. Eye-wateringly, those transactions were accompanied by $77.48 billion in merchant fees for the two processing behemoths in the same year.

For additional context, Visa and MasterCard swipe fees totaled $61.6 billion in 2020. That represents an increase of 137 percent over the decade prior. Adding the merchant fees for all cards, the 2020 total was $110.3 billion, which is an increase of 70 percent from the previous ten years.

As veteran operators are well aware, swipe fees are among the highest costs for restaurants and bars.

Merchants Payments Coalition Sends Letter to Congress

Compellingly, the MPC is urging Congress to investigate the Visa-MasterCard duopoly. In their view, the two processors’ dominance is stifling competition; harming business owners and consumers; and contributing to inflation.

“The two giant card networks and their partner mega-banks routinely use their market power to stifle competition and charge merchants the highest swipe fees in the industrialized world,” reads the MPC’s letter to Congress.

Further, the letter states, “It is difficult to imagine any other market in the U.S. economy in which two entities set prices for thousands of businesses that should be competitors. That lack of competition or downward pricing pressure has resulted in out-of-control swipe fees and increases inflation throughout the economy.”

The MPC is urging Congress to act quickly and effectively: “It is crucial for Congress to act swiftly and implement real reforms to bring true competition, transparency and equity to the U.S. payments market.”

National Restaurant Association Supports the Bill

Interestingly, the National Restaurant Association says they’re working with the MPC.

The NRA is also working with other organizations to drum up support for the the Credit Card Competition Act of 2022.

You can read about their support for the bill on their website. Additionally, you can tell Congress to pass the bill here. As it stands currently, no action beyond the bill’s introduction to the Senate on July 28 has taken place.

Image: Pixabay

by David Klemt David Klemt No Comments

5 Books to Read this Month: September 2022

5 Books to Read this Month: September 2022

by David Klemt

Flipping through an open book

This month’s engaging and informative book selections will help you develop next-level leadership skills and dial in your drink menu.

To review August’s book recommendations, click here.

Let’s jump in!

Your Restaurant Culture Sucks!: Stop surviving. Start thriving. Escape mediocrity

Donald Burns, the Restaurant Coach and friend of KRG Hospitality, completes his Your Restaurant Sucks! trilogy. For the third book in the self-improvement and hospitality industry leadership series, Burns tackles culture.

In Your Restaurant Culture Sucks!, Burns helps owners, operators, and leadership team members understand the importance of workplace and company culture. Instead of complaining that “nobody wants to work anymore,” look inside and find out why perhaps nobody wants to work for you. That kind of honesty helps implement real change, change that sets you apart and improves recruitment, hiring, and retention.

“All restaurants can buy from the same vendors and hire from the same labor pool. What separates the good, from the great to the outstanding is culture!”

Subtract

Sometimes changing our outlook and improving our leadership skills is about streamlining.

“We pile on ‘to-dos’ but don’t consider ‘stop-doings.’ We create incentives for good behavior, but don’t get rid of obstacles to it. We collect new-and-improved ideas, but don’t prune the outdated ones. Every day, across challenges big and small, we neglect a basic way to make things better: we don’t subtract.”

With Subtract, Leidy Klotz explains how changing how we approach solutions can be life changing. Maybe we need to stop adding and start subtracting to improve our strategies.

Cure: New Orleans Drinks and How to Mix ’Em from the Award-Winning Bar

If you travel to New Orleans and you’re in this industry, you probably make sure to include Cure on your itinerary. For more than a decade this 2018 James Beard Award winner (Outstanding Bar Program) has been integral to the city’s craft cocktail scene.

Whether you’re after a deceptively simple beer and shot or a cocktail made with a rare, allocated bourbon, Cure is there to elevate your French Quarter visit. And soon you’ll be able to bring Cure home with you, and to your restaurant or bar as well. Available now for preorder, Cure includes 100 cocktail recipes that tell the tale of NOLA from past, present, and future.

Craft Beer Design: The Design, Illustration and Branding of Contemporary Breweries

Anyone who pauses to consider beer can design knows that it’s becoming nearly as important as the liquid. With thousands of breweries all over the US alone, how does a brewer stand out? How does a small, independent craft brewer grab a potential new customer’s attention in a sea of options? In part, through their can designs. Of course the beer itself is crucial and the most important element. However, a consumer has to be motivated to try a beer before they learn how good it tastes.

Craft Beer Design dives deep into craft beer design, featuring real-world examples and interviews with the designers themselves.

Think Again: The Power of Knowing What You Don’t Know

Curiosity keeps us learning. The pursuit of knowledge keeps us sharp. Learning helps us improve ourselves, our leadership, and our operations. The belief that we’ve learned all there is to know, however, prevents us from learning to our own detriment.

Much like Subtract teaches us how to remove rather than add, Think Again proposes a new approach: unlearning and rethinking. Why do we get defensive when we’re wrong? Why are we so afraid of challenges to long-held beliefs? Admitting when we’re wrong and seeking facts is a strength, not a weakness.

Image: Mikołaj on Unsplash

by David Klemt David Klemt No Comments

Date Night Desires and Dealbreakers

Date Night Desires and Dealbreakers

by David Klemt

Reserved seats at a bar

Focusing on date night, guest experience and retention tech platform SevenRooms is sharing their latest data-driven report.

Their “Date Night Diner Report” is another successful collaboration with YouGov. Previous reports from this partnership include:

One of the reasons we at KRG Hospitality appreciate and recommend SevenRooms is their dedication to data. The platform’s commitment to sharing the data they collect to the benefit of operators is impressive.

“A resurgence of the American date night is here, and these date night diners are flipping the script on what that experience should look and feel like,” says Allison Page, co-founder and chief product officer at SevenRooms.

So, operators who want to succeed with date night should review this new report. In fact, all operators would be wise to read this report. After all, it addresses reservations, waitlists, walk-ins, and much more.

Released today, this brand-new report can be downloaded here. Read the press release here.

Date Night Details

A lot has changed over the past two-plus years. What hasn’t changed are the two most popular date nights in the US: Friday and Saturday.

Both Friday and Saturday night are preferred by 26 percent of the 763 survey respondents who go on dates. In total, SevenRooms and YouGov surveyed 1,153 individuals.

Generally speaking, these dates are return visits. People who go on dates tend to make reservations at restaurants they’ve dined at previously.

However, 46 percent of such guests are open to reserving a table at a restaurant they haven’t visited before. And speaking of those tables reservations, 53 percent are for two people.

Looking at two major populations, tables for two are the most popular reservations. In New York, they account for 50 percent of reservations. That number increases to 56 percent in Los Angeles.

Interestingly, however, is this bit of date: 53 percent of Americans don’t make reservations for date night. Rather, they’re walk-in guests, meaning they’ll likely become waitlist guests.

Date Night Desires

So, now operators know that the majority of today’s date-night reservations are for two. That doesn’t mean setting aside two-tops and side-by-side seats at the bar is enough for success.

No, there are also guest expectations to consider. SevenRooms identifies the following as the top date-night desires:

  1. A complimentary cocktail or dessert. (33 percent)
  2. Ability to earn extra rewards (24 percent), highlighting the value of loyalty programs.
  3. Incentives that encourage repeat date-night visits. (23 percent)

Furthermore, personalization continues to be a key factor in the dining decision. One-third of guests consider the ability to personalize their dining experience more important than factors such as menu variety or receiving their order quickly.

Date Night Dealbreakers

Of course, if there are desires there are also dealbreakers.

According to SevenRooms, the following are the dealbreakers operators must avoid:

  1. People on a date receiving their meals at different times. In this case, more than ten to 15 minutes apart. (45 percent)
  2. The restaurant being so loud the guests on their date can’t hold a conversation. (43 percent)
  3. A restaurant not having the menu items the guests were looking forward to ordering. (31 percent)
  4. Being sat too close to another table. (31 percent)
  5. Sitting next to a table speaking “too loudly.” (26 percent)
  6. The restaurant being so crowded that a guest can’t find their date. (24 percent)

How important is it to avoid these dealbreakers? Well, the survey respondents say they won’t return to a restaurant if they experience any of them.

To read the full report, click here. And to learn more about SevenRooms, listen to Bar Hacks episode 24, featuring SevenRooms CEO Joel Montaniel.

Image: Dmitri Nesteruk on Unsplash

by David Klemt David Klemt No Comments

Are You Surveying Your Team?

Are You Surveying Your Team?

by David Klemt

Interesting "Information" typography

Successful recruitment is only one element of overcoming the current labor shortage—retention is another crucial element.

In fact, employee turnover can be incredibly costly. According to the Center for Hospitality Research at Cornell, employee turnover costs nearly $6,000 per hourly team member.

Now, consider what it costs to hire a single employee. On average, it costs $3,500 to hire that worker in the first place. So, the math is simple: Losing an employee costs an operator more than hiring one.

Unsurprisingly, turnover cost more than doubles—nearly $14,000—for a restaurant manager. In short, employee retention is arguably more important than recruitment and hiring.

Labor Shortage

Per Datassential, 33 percent of 801 survey respondents say the labor shortage is their greatest challenge in 2022. More than 70 percent of those respondents are independent operators.

However, independent, chain, and franchise operators appear to agree on one particular element of the challenge. Across segments, hiring hourly back-of-house employees is the most difficult.

In fact, Datassential’s latest FoodBytes report states that restaurants are coming up short in the kitchen. Two-thirds of restaurants are struggling to fill open hourly cook positions.

So, what’s the solution? Higher starting wages? Bonuses for remaining in role for 90 days? Benefits like health insurance and a 401K?

Each of those does work—for recruitment and hiring. What keeps a new hire from leaving after 90 days with their bonus cash, heading down the road to the next restaurant or bar?

It’s commonly agreed that the first 90 days of a new hire’s employment are the most crucial. Wages and benefits keep them in role for roughly three months. During that time, they’re deciding if their role and the employer’s culture are for them.

Employee Engagement

If you’re an owner, operator, or member of the leadership team, you know the importance of data. In fact, you should be obsessed with data collection and analysis.

Truly, the best way to make decisions that will impact the business is with information. Guesswork just doesn’t cut it. Yes, you should pay close attention to your “gut.” However, you should avoid acting on gut instincts before analysing the relevant data.

Wisely, many operators encourage their guests to complete satisfaction surveys. After all, their feedback is crucial to the success of any business. But what about employee surveys? Your team is equally as important as your guests.

Unhappy team members, unhappy guests. Unhappy guests, reduction in traffic. Team members fleeing your business? Your guests pick up on turnover. Eventually, you won’t have a business.

Now, you can assume your team is happy. You can feel like your leadership team is ensuring employee satisfaction and engagement. Or, you can know.

How do you know? You ask.

Satisfaction Surveys

Call it a satisfaction survey, call it a happiness survey… Either way, you’re asking your team members how happy they are with you and their role.

Operators will likely want to keep these surveys anonymous. Several sources that address employee surveys claim most employees prefer anonymity. Unfortunately, this is due to a fear of retribution from ownership or the leadership team.

Even with a healthy workplace culture, anonymity is probably the best for these surveys. Of course, if you’re implementing a 90-day happiness survey for new hires, anonymity doesn’t make much sense.

As far as company-wide survey frequency, there are several options. Once per year is obviously the bare minimum. Therefore, it’s not very effective. Every six months is better but is checking in on your team’s happiness twice per year enough?

The sweet spot appears to be quarterly surveys. More than that—monthly or bi-monthly—will likely get annoying.

Survey Questions

Below are a few questions to consider for your surveys. You’ll have to decide if you want to use multiple-choice, yes or no, matrix, or open-ended questions, or a mix of each type.

Another consideration is how your team will access the survey. The process needs to be as painless as possible. So, consider pushing a link via your scheduling platform, text, or QR code.

  • How happy are you working here?
  • How happy are you in your current role?
  • Would you recommend us to friends and family as a good place to work?
  • Does the leadership team make you feel valuable?
  • Do you see yourself working here a year from now?
  • Are we helping you succeed in your role?
  • Are we giving you what you need to progress in your career?

Image: Roman Kraft on Unsplash

by David Klemt David Klemt No Comments

Datassential’s State of the Operator 2022

Datassential’s State of the Operator 2022

by David Klemt

Guests sitting at the bar inside a restaurant

The latest addition to the Datassential FoodBytes research series shares insights into the top three challenges most—if not all—operators are facing.

Now, some of what the report reveals paints a bleak picture. Inflation, the labor shortage, and supply chain issues persist even past the midway point of 2022.

However, operators are a tenacious and innovative group of business owners. Of course, that tenacity seems to manifest in people thinking this industry can weather any storm. That perception can come at operators’ detriment. Exhibit A: The Inflation Reduction Act of 2022 not including replenishing of the RRF. But, I digress.

“The State of the Operator & the Road Ahead,” which you can download here, is helpful and informative. As you may be aware, we’re fans of Datassential and their FoodBytes reports. In fact, you can find our synopses of FoodBytes reports here and here.

Below are some key points that operators should be aware for consideration. I strongly urge you to download this free report today.

Operator Outlook

First, let’s take a look at traffic. As Datassential points out, some hospitality business segments are performing better than others currently.

In large part, this is due to two factors: People working from home, and people returning to travel. So, operators who rely heavily on commuters and in-person workers are struggling. On the other hand, operators inside or around hotels are, per Datassential, performing the strongest at the moment.

Interestingly, though, nearly half of operators (47 percent) are seeing an increase in traffic in comparison to pre-Covid levels. Fourteen percent of operators are reporting no change in traffic. Unfortunately, traffic is lower for 39 percent of operators.

Next, sales. In comparison to pre-Covid times, more than half (51 percent) of operators report an increase. Again, 14 percent of operators are experiencing no change. But 35 percent of operators are experiencing a decrease in sales.

Finally, profit margins. Half of operators may be seeing increases in traffic in sales, but profit margins are taking a hit. On average, the industry’s profit margin is now hovering at 13 percent. That’s an eight-percent drop in comparison to pre-Covid levels.

Segment Performance

The findings regarding profit margins are likely to be the most alarming to operators. Historically, our industry has operated on razor-thin margins for decades. Dropping from an average of 21 percent to 13 is concerning.

However, context is important. The segments seeing the lowest profit margins in 2022 are: Business & Industry (B&I), Healthcare, and Colleges & Universities (C&U). Again, remote work (and learning) are largely responsible for those particular segments watching their profit margins tumble.

The strongest performers are: Quick-Service Restaurants (QSR) at 17 percent; Fast Casual at 15 percent); and Midscale, Casual Dining, and Fine Dining, each at 13 percent. Lodging is just below the current average at 12 percent.

Operator Adaptation

Inflation, rising food costs, supply chain issues, labor shortages… Operators are finding ways to cope, and in some situation, thrive.

Unsurprisingly, the vast majority of operators are increasing menu prices. In the past 12 months, 77 percent of operators have raised menu prices at least once.

These increases range from one percent a staggering 30 percent. However, the majority have kept these increases to one to ten percent. Most (31 percent) have implemented increases of no more than five percent. Just one percent of operators boosted prices between 25 to 30 percent.

Of course, raising prices isn’t the only strategy operators have at their disposal. Forty percent of operators are streamlining their menu, reducing the sizes of their menus. However, it’s wise for operators to review their menus at least every three months to eliminate poor performers.

Other strategies include focusing on value for guests (27 percent); utilizing LTOs and launching new menu items (26 percent); eliminating a specific daypart or portion of the menu (25 percent); and making portion sizes small, or “shrinkflation” (18 percent).

There’s much more revealed in Datassential’s latest FoodBytes report. Download your copy today.

Image: Luca Bravo on Unsplash

by David Klemt David Klemt No Comments

Members of Congress Send Letter to SBA

Members of Congress Send Letter to SBA Regarding $180 Million

by David Klemt

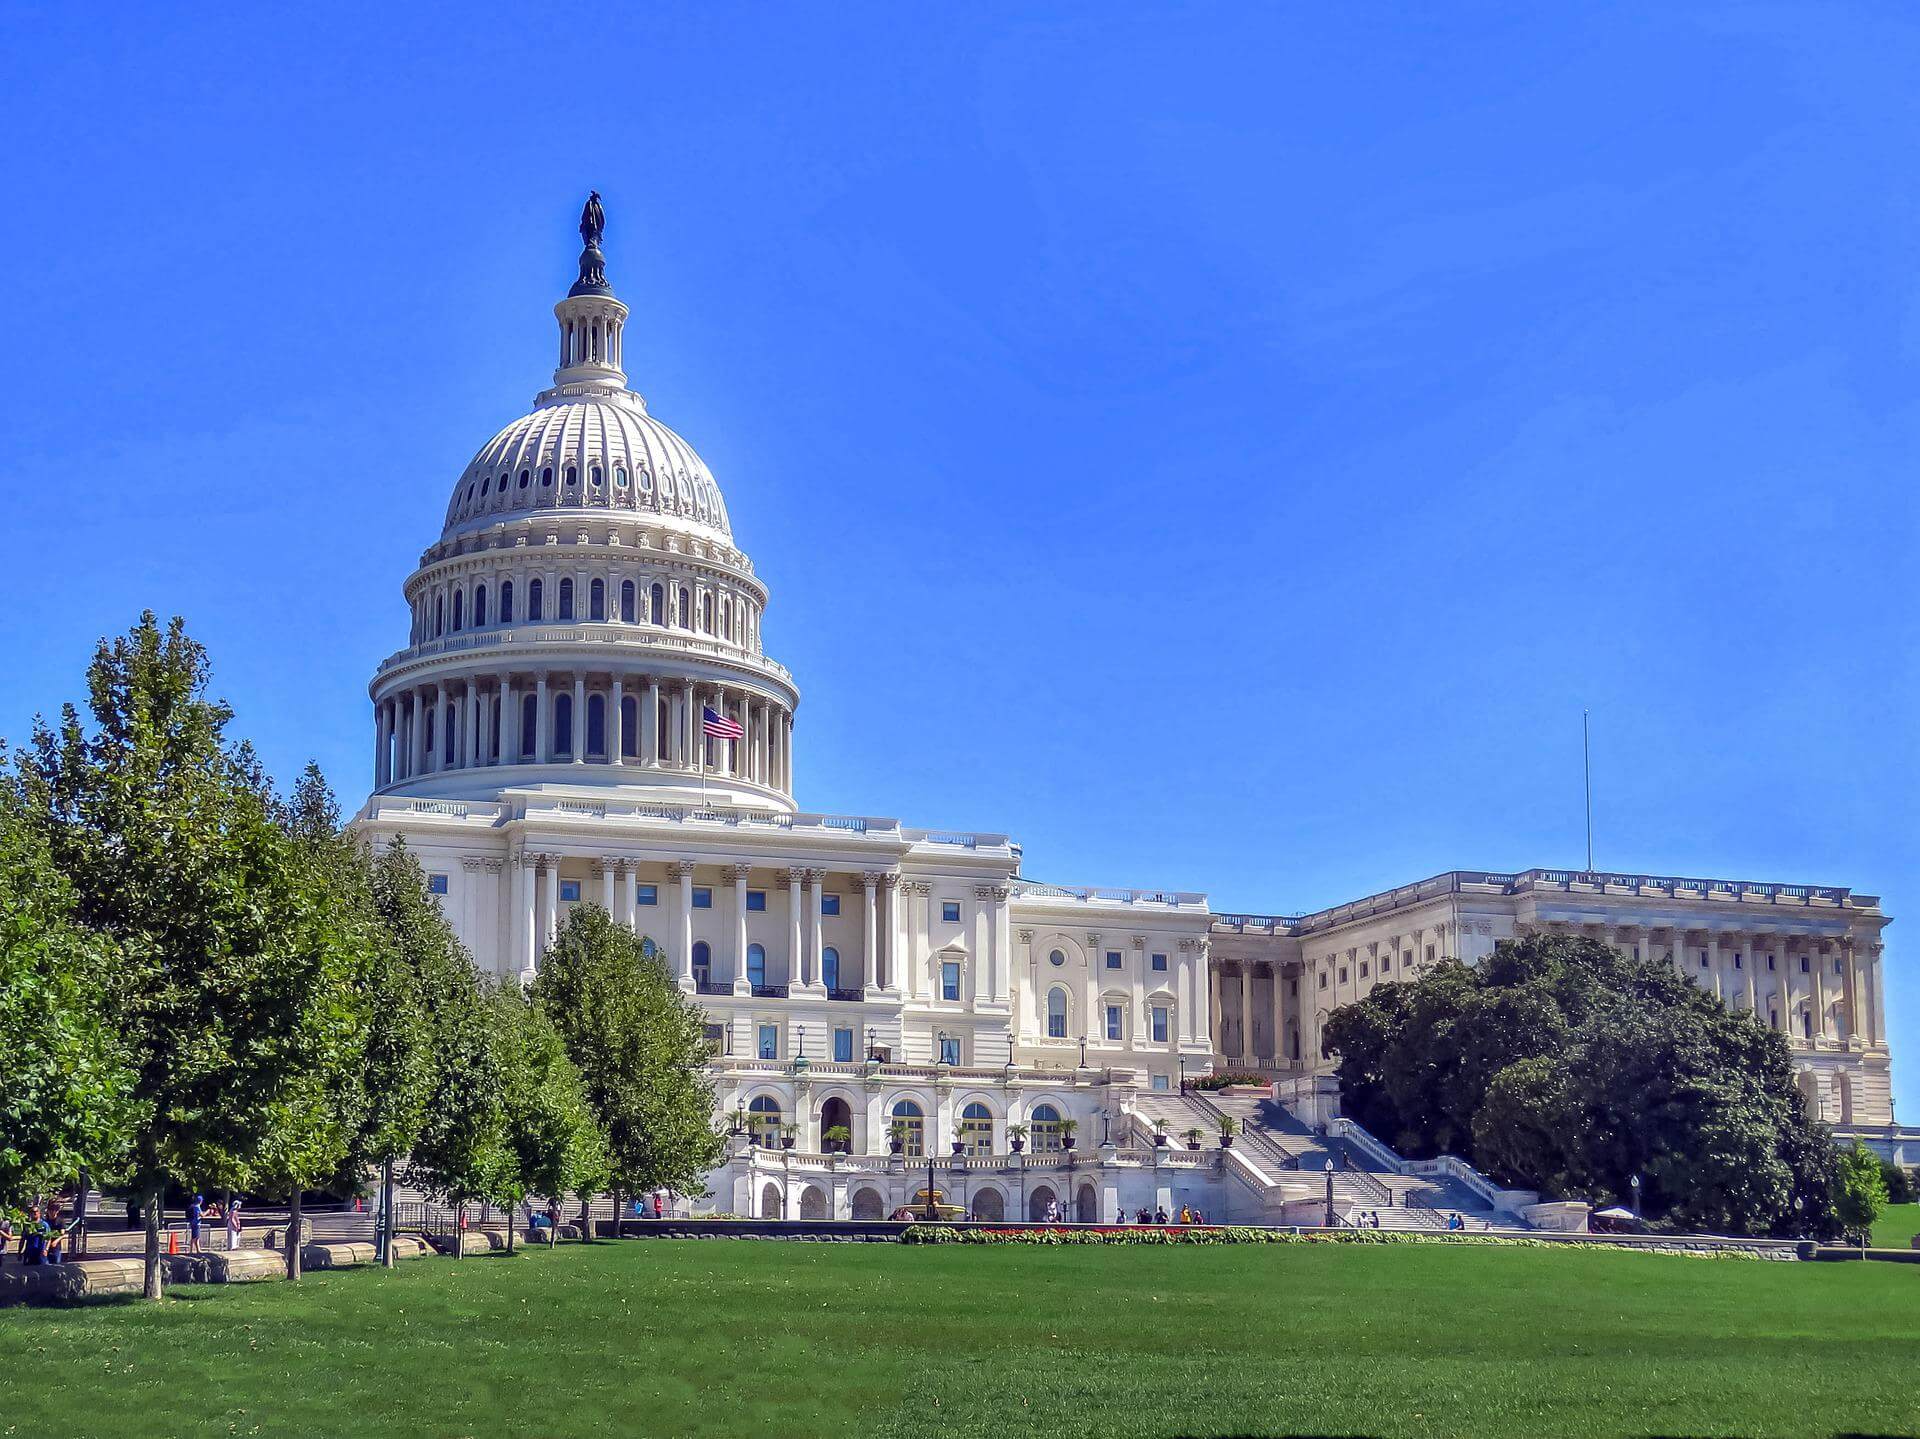
United States Capitol Building and Capitol Grounds

More than 70 members of Congress are urging the Small Business Administration to act quickly to fund eligible RRF applicants.

This news comes on the heels of the findings of the Government Accountability Office’s investigation into the RRF. As you may recall, the GAO discovered $180 million in unobligated funds.

In response, 73 representatives and senators sent the SBA a letter. Sen. Catherine Cortez Masto (D-NV) and Rep. Earl Blumenauer (D-OR) are leading the effort to quickly and fairly distribute the $180 million.

At the start, members of Congress ask that the SBA take immediately action. Also, that the SBA give priority consideration to RRF applicants who didn’t receive funds even though they were awarded grants.

By the way, that’s about 7,000 applicants.

Unfortunately, the recently passed Inflation Reduction Act of 2022 doesn’t include funds to replenish the RRF. And while $180 million is nowhere near the $42-43 billion our industry needs and deserves, it’s something. In fact, it’s a reason to keep pushing Congress to do the right and responsible thing.

Interestingly, the letter sent to the SBA also urges the clawing back of funds for various reasons. One social media user, in response to the letter, suggested auditing the recipients. Presumably, this would also lead to a clawback and, in turn, the further awarding of grants.

Key Segments of the Letter

“Last month, the Government Accountability Office (GAO) released a report titled Restaurant Revitalization Fund: Opportunities Exist to Improve Oversight that stated that as of as of June 2022, $180 million of RRF funding was unobligated. As you know, about 177,000 restaurants that applied to the program did not receive awards. While we understand the remainder of the funding will not reach every business that applied, it is imperative that the SBA distribute every dollar to help as many struggling restaurants as is feasible.

“In addition to these actions, we are also urging that SBA take action to recover funds that have been awarded to ineligible applicants, were found to be accepted fraudulently, or could otherwise be returned. For example, the aforementioned GAO report states that SBA does not require recipients to report their operating status, despite the statute requiring that businesses that permanently close to return the unused funds to SBA. SBA has itself identified potentially ineligible recipients, such as clubs and hotels that failed to meet statutory eligibility criteria. Money recovered from fraudulent and ineligible businesses can subsequently be used to help
fund the many businesses who were unable to receive grants. We urge you to take action on this matter and provide us with detailed information on the amount of funding that may be recovered as well as SBA’s progress in doing so.”

Image: Francine Sreca from Pixabay

by David Klemt David Klemt No Comments

5 Self-serve Beverage Brands to Know

5 Self-serve Beverage Brands to Know

by David Klemt

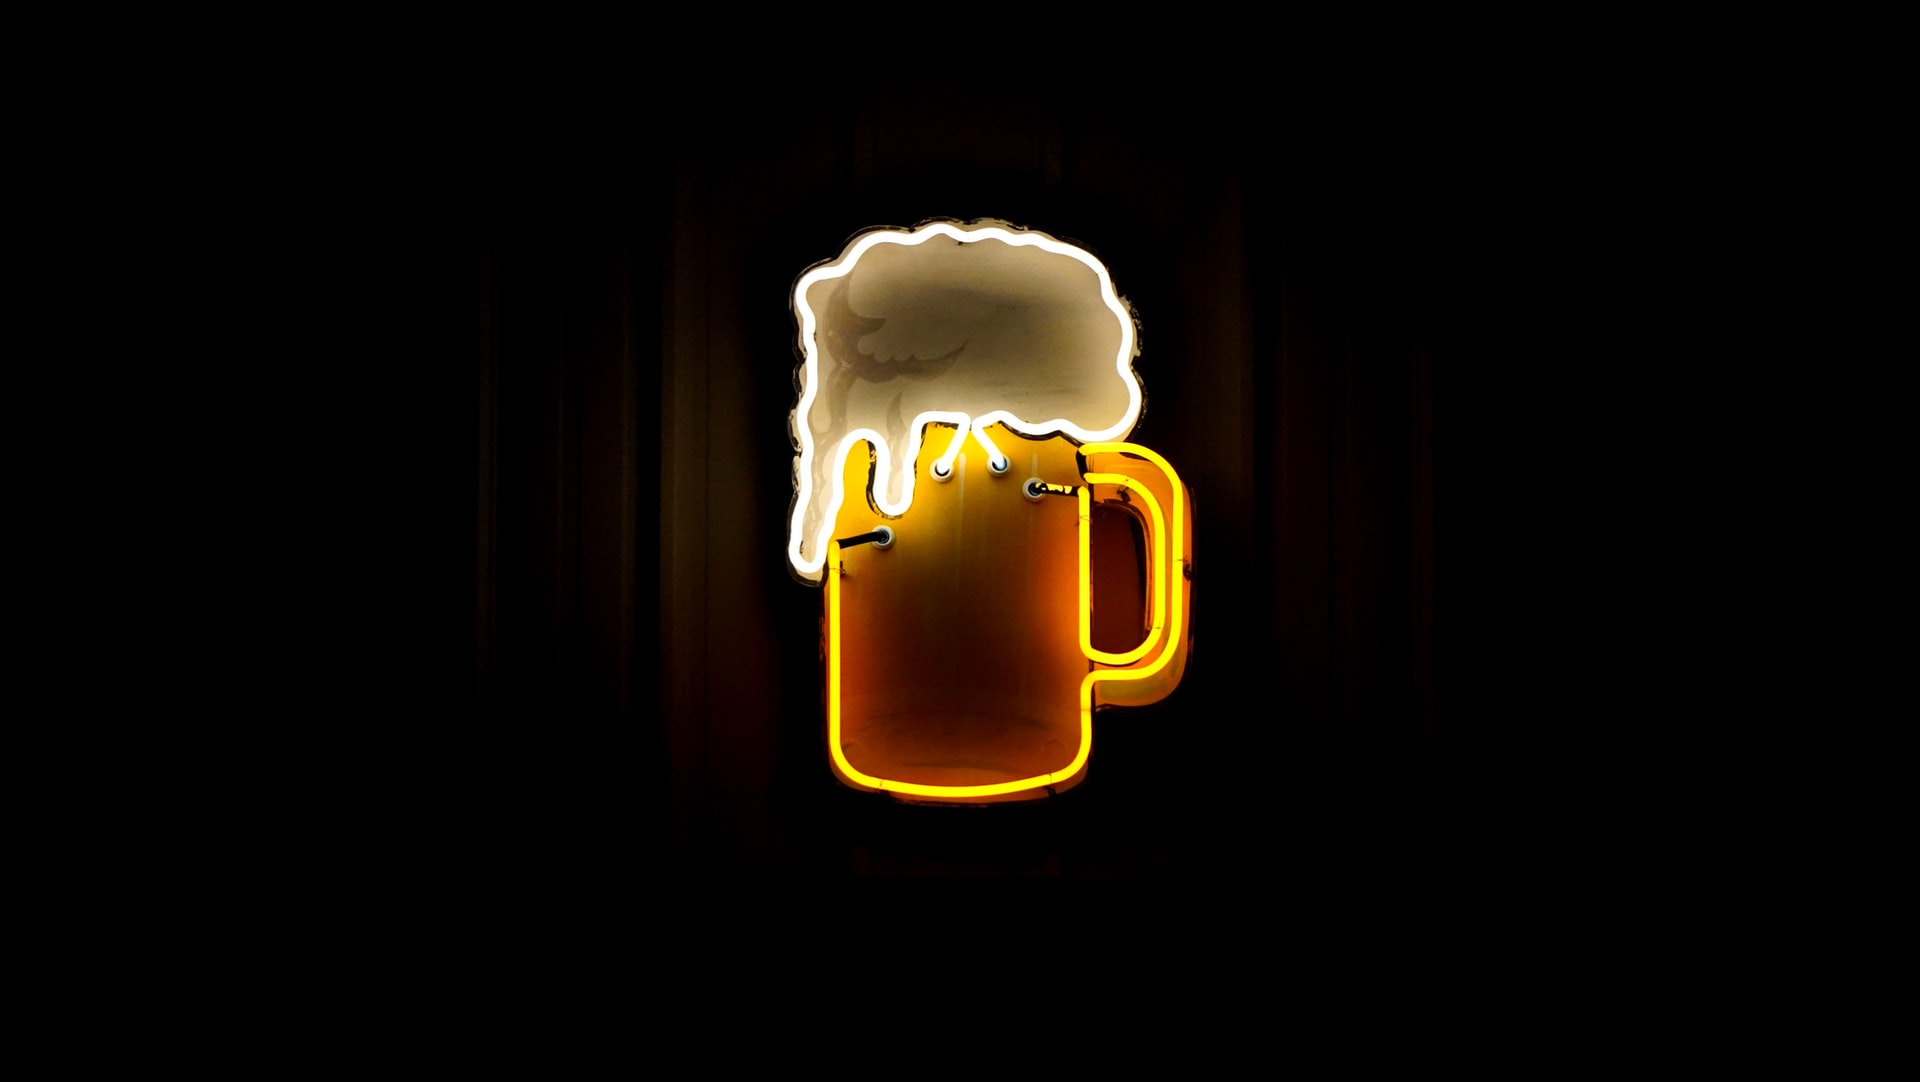
Neon beer mug sign

If you’re an operator who wants to leverage the popularity of self-serve beverages, these are the brands you should consider.

There are several reasons to invest in self-serve beverage solutions:

  • Reducing costs
  • Reduction in waste
  • Guest convenience
  • Guest experience
  • System customization
  • Real-time system management and reports
  • Security

Truthfully, had I been told ten years ago that guests would want to serve themselves beer, wine, and other drinks, I would have raised an eyebrow. It’s possible, sure, but I would’ve been skeptical.

Well, it turns out that I would’ve been wrong. Indeed, today’s guest seems to enjoy pouring their own drinks from self-serve systems.

From convenience to control over their experience, these platforms are proving popular with consumers. An appealing factor appears to be the ability to sample a range of beverages to discover new favorites. And, of course, they can do so without having to purchase full drinks or asking a bartender or server for a sample.

So, below are some of the brands in the self-serve beverage world that operators need to know and consider.

Operator Benefits

In terms of P&L, your bottom line will thank you for embracing self-serve solutions.

First, the popularity of these systems increases sales. Guests can sample an array of drinks easily, choose a favorite or two, and serve themselves at their convenience. Additionally, guests tend to view self-serve systems in a positive light due to perceived value.

Second, an impressive self-serve beverage wall can be a sight to behold. There are venues with 100 self-serve taps and screens, which is an impressive sight. There are also all manner of designs not dependent on a wall. One great example is the rotating self-serve beer system at the Famous Foods Center Bar inside Resort World Las Vegas.

In other words, self-serve beverage systems help concepts stand out among competitors.

Third, self-serve systems allow operators to streamline operations and reduce costs. For example, labor costs can be reduced, as can waste.

And fourth, these solutions can lead to improvements in the guest experience. Not having to wait in line and being able to engage more with front-of-house staff aids in guest perception.

iPourIt

According to the brand itself, iPourIt installed the world’s very first beer wall. Since then, the platform has worked tirelessly to improve their solutions.

One way they’ve improved involves the security and usability of their system. As you’ll see with most self-serve brands that pour alcohol, guests are locked out of these systems without RFID access.

IPourIt offers several types of RFID solutions, from bracelets to fobs. Of course, other systems use similar tech. However, iPourIt prides themselves in offering touch-free RFID access and eschewing the need to leave cards in slots when pouring.

Another benefit is that as long as the beverage isn’t meant to be poured hot or doesn’t have pulp/sediment, iPourIt can handle it.

PourMyBeer

This company is iPourIt’s main rival. When you review how they can improve an operators’s bottom line, it’s not hard to see why.

PourMyBeer claims some impressive stats:

  • 45 percent sales increase
  • 50 percent increase in profits
  • 20 percent reduction to labor costs
  • Less than three percent waste

Like other systems, PourMyBeer can help operators leverage wall space. In addition, a single PourMyBeer screen can control four taps, so a wall doesn’t haven’t to be overloaded with screens.

Impressively, this platform also boasts the most POS integrations among the self-serve systems. Obviously, this is beneficial to the vast array of operators.

Table Tap

For operators looking for both a pioneer in the self-serve space, Table Tap may be the perfect partner. In particular, the use of “underage cards” by underage guests to access non-alcohol drinks is a nice feature. So, children up to early college-age students can get in on the fun.

Standing out from other platforms, Table Tap offers wall systems and table-mounted systems. Truly, offering a self-serve wall and a number of tables with the same tech is impressive.

In fact, if I were to install both solutions I would consider the tables a self-service take on VIP seating. And, I’d charge accordingly. Just something operators may want to consider.

Another cool feature relates to Table Tap’s software. While not the most mind-blowing functionality, guests can control an operator’s sound system via the TableTab ordering platform. Better yet, if an operator charges fees to select songs on their jukebox, TabelTab adds them to guest tabs.

To learn more about Table Tap, give episode 22 of Bar Hacks a listen.

Drink Command

“We do everything self pour, and more,” proclaims the Drink Command website.

Is an operator looking for a killer self-pour wall? Done. Table-mounted taps? Check. What about a self-serve tower, self-serve mobile kegerator, or a heavy-duty, mobile, self-serve counter? Drink Command has all three.

In other words, Drink Command makes it easy for operators to get creative and implement a range of self-pour solutions. Additionally, with mobile solutions, operators who want to expand into catering, pop-ups, and special events can do so easily.

For a list of other benefits—including foam-free beer pours, advertising interstitials, and consumption limits—click here.

Napa Technology

Makers of the TapStation, Napa Technology promises a boost to the guest experience. In part, this is because guests don’t have to wait in long lines at the bar.

Additionally, as stated prior, today’s guest enjoys using self-serve beverage systems.

Unlike other platforms, the Napa Technology TapStation doesn’t rely on wall installations. Instead, TapStation dispensers are available in two- and four-keg systems. These stations can be placed anywhere on the floor rather than a wall.

The TapStation can serve beer, wine, kombucha, and cold-brew coffee, ensuring it’s as versatile as the systems above.

Image: Brad on Unsplash

by David Klemt David Klemt No Comments

Top 10 States Attracting High Earners

Top 10 States Attracting High Earners

by David Klemt

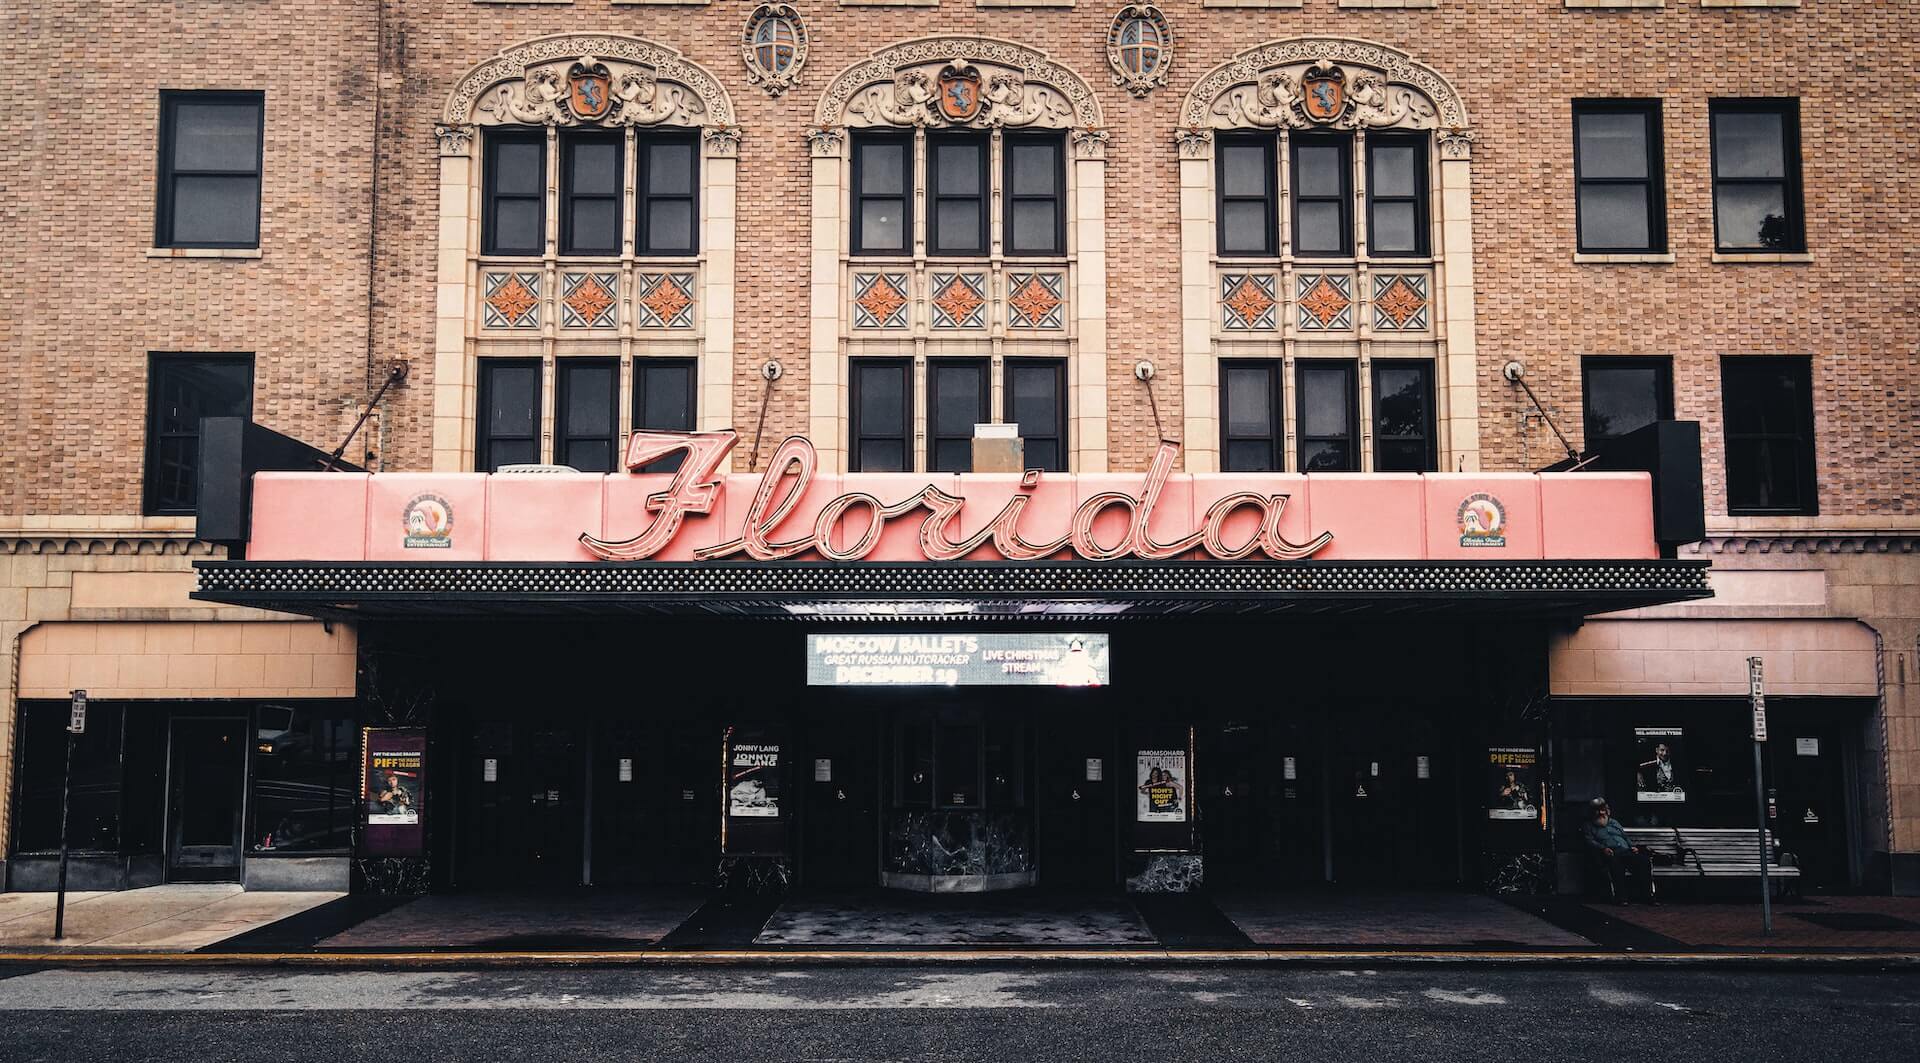
The Florida Theater in Jacksonville, Florida

Using the inflow and outflow data of tax filers earning $200,000 or more, SmartAsset identifies the top ten states attracting high earners.

When it comes to the number-one state, “it’s not even close,” says SmartAsset Advisors. Not surprisingly, several top inflow cities (according to Redfin data) line up with SmartAsset’s top inflow state list.

So, why should this information matter to operators? Plainly, it’s important market information. Population, household income, and age information are crucial considerations when opening any business.

In fact, KRG Hospitality includes such data (and much, much more) when conducting research for our proprietary feasibility, business, and concept plans. Among many elements of opening a restaurant, bar, hotel, or entertainment venue, the income of one’s target audience is crucial.

Knowing where high-income households are leaving and moving to can inform many operator decisions. Where should one open their first concept? Which markets should one consider for expansion? What type of concept will work in a market? What are the threshold price points for menu items? How will this information help inform design choices?

Operators need to recoup their outlay. The income of a concept’s ideal guest should be as important to an operator as knowing their costs.

Top Ten Inflow States

Interestingly, the top state on this list did experience significant outflow in 2020. In fact, the state lost 11,756 high-earning households in 2020.

However, the state also added 32,019 such households, netting 20,263 high earners.

  1. Utah
  2. Idaho
  3. Nevada
  4. Colorado
  5. Tennessee
  6. South Carolina
  7. North Carolina
  8. Arizona
  9. Texas
  10. Florida

Another compelling detail of the states on this list pertains to income tax. In short, three of the states don’t levy personal income tax.

Above, they’re the states in bold: Florida, Nevada, and Texas.

Top 10 Outflow States

So, above are the ten states are seeing the greatest an inflow of high-earning households. Which means, of course, there’s an inverse.

Below, the ten states experiencing the greatest outflow of high earners. Unsurprisingly, SmartAsset deems several entries on the list high-tax states. Also, Washington, DC, is a high-tax area.

Moreover, the list below includes five of the top ten high personal income tax jurisdictions (in bold).

  1. Ohio
  2. Minnesota
  3. Washington, DC
  4. Maryland
  5. New Jersey
  6. Virigina
  7. Massachusetts
  8. Illinois
  9. California
  10. New York

However, it’s not as though these states are seeing a massive exodus of high-earning households. In fact, per SmartAsset, these states have more high-income households than the national average.

Nationally, high-earning households account for less than seven percent of all tax filers. According to SmartAsset, nearly nine percent of tax filers are high-income households in the top ten outflow states.

Image: Trevor Neely on Unsplash

Top