Foodservice

by David Klemt David Klemt No Comments

Canada’s Restaurant Labor by the Numbers

Canada’s Restaurant Labor by the Numbers

by David Klemt
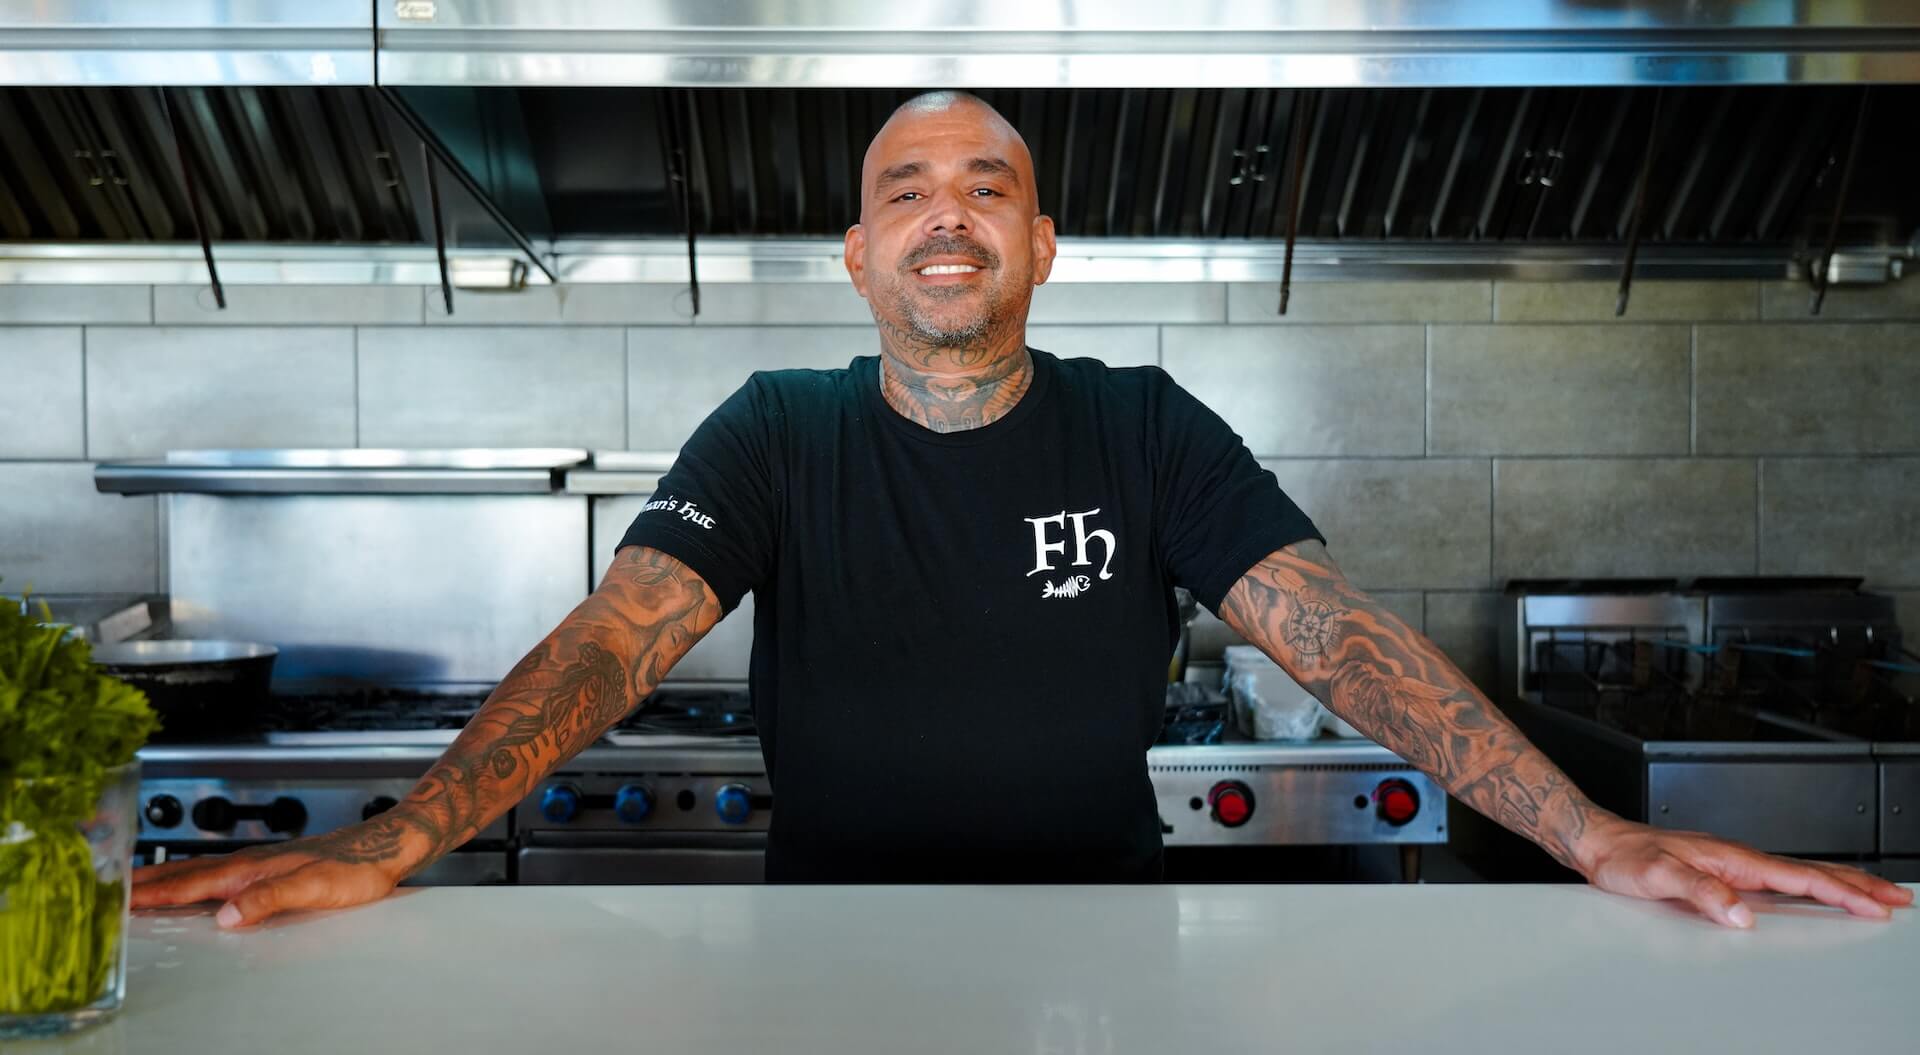
Chef inside commercial kitchen

While there are positive signs for Canada’s foodservice industry, recruiting and retaining labor continues to be a challenge.

Unfortunately, this isn’t a challenge unique to Canada. Operators throughout North America and indeed across the globe are facing labor shortages.

Restaurants Canada addresses this topic in their 2022 Foodservice Facts report. The non-profit research and advocacy group predicts sales will reach pre-pandemic levels by Q4 of this year.

However, restaurants, bars, and nightclubs may have to achieve traffic and revenue growth despite a significant labor deficit.

Please click here to access the 2022 Foodservice Facts report yourself.

Labor Shortage by Category

In their latest report, Restaurants Canada crunches the numbers for three distinct venue categories. These are quick-serve restaurants, full-service restaurants, and bars and nightclubs.

The organization finds that QSRs and FSRs are facing the greatest shortages. In fact, in response to a survey from May of this year, at least half of QSRs and FSRs aren’t operating with fulls staffs.

For QSRs, 52 percent of respondents say they perceive restaurants and bars they’ve visited to be understaffed. A bit over a third (36 percent) think staffing is “about right.” Unhelpfully, 12 percent “don’t know” if restaurants and bars have enough staff.

So, let’s switch gears to FSRs. Precisely half of survey respondends say restaurants and bars don’t have enough staff. Just like their QSR counterparts, 36 percent say that staffing seems to be at the ideal level. Fourteen percent respond that they “don’t know,” which doesn’t tell us much.

Per Canadians who responded to Restaurants Canada’s survey, bars and nightclubs are fairing better…at first. Frustratingly, a staggering 37 percent of respondents “don’t know” if bars or nightclubs have appropriate levels of staffing. Thirty-two percent think they’re understaffed, 31 percent think staffing levels are “about right.”

Industry professionals are probably already putting two and two together here. As long as guests receive the level of service they expect, from greeting to speed of service, to closing out their check, they think things are fine. If they’re made to wait longer than they want, they’ll likely say a restaurant, bar or nightclub doesn’t have enough people on shift.

Labor Shortage by Role

Okay, so the May 2022 Restaurants Canada wasn’t entirely helpful. It still provides interesting insight. That is, we know how guests perceive staffing in at least most instances.

So, let’s get down to hard numbers: shortages in specific roles throughout the industry.

Here, Restaurants Canada provides compelling information, even if it’s not what we want to see. In comparison to 2019, every role is down by thousands of people. In some cases, tens of thousands.

Below you’ll find the deficits by role:

  • Foodservice supervisors: -3,100
  • Chefs: -10,900
  • Bartenders: -17,600
  • Maîtres d’hôtel and hosts/hostesses: -21,100
  • Restaurant and foodservice managers: -22,400
  • Food counter attendants, kitchen helpers, and related support occupations: -43,200
  • Cooks: -44,400
  • F&B servers: -89,500
  • Other: -18,800

Add that up and that’s a shortage of 271,000 people throughout Canada’s foodservice industry. For further context, the industry boasted 1,265,700 workers. In 2021, the industry was down to 994,700.

Unfortunately, from 2020 to 2021, just 4,100 jobs were recovered, according to Restaurants Canada. This situation clearly shows that operators need to change their approach to staffing.

Now, more than ever, operators must focus on effective recruitment, onboarding, and retention. For tips on making improvements, click here. To learn how to implement employee surveys to boost retention and avoid costly turnover, click here.

Image: Brian Tromp on Unsplash

by David Klemt David Klemt No Comments

Will Virtual Kitchens Persist?

Will Virtual Kitchens Persist or Go Brick-and-Mortar?

by David Klemt

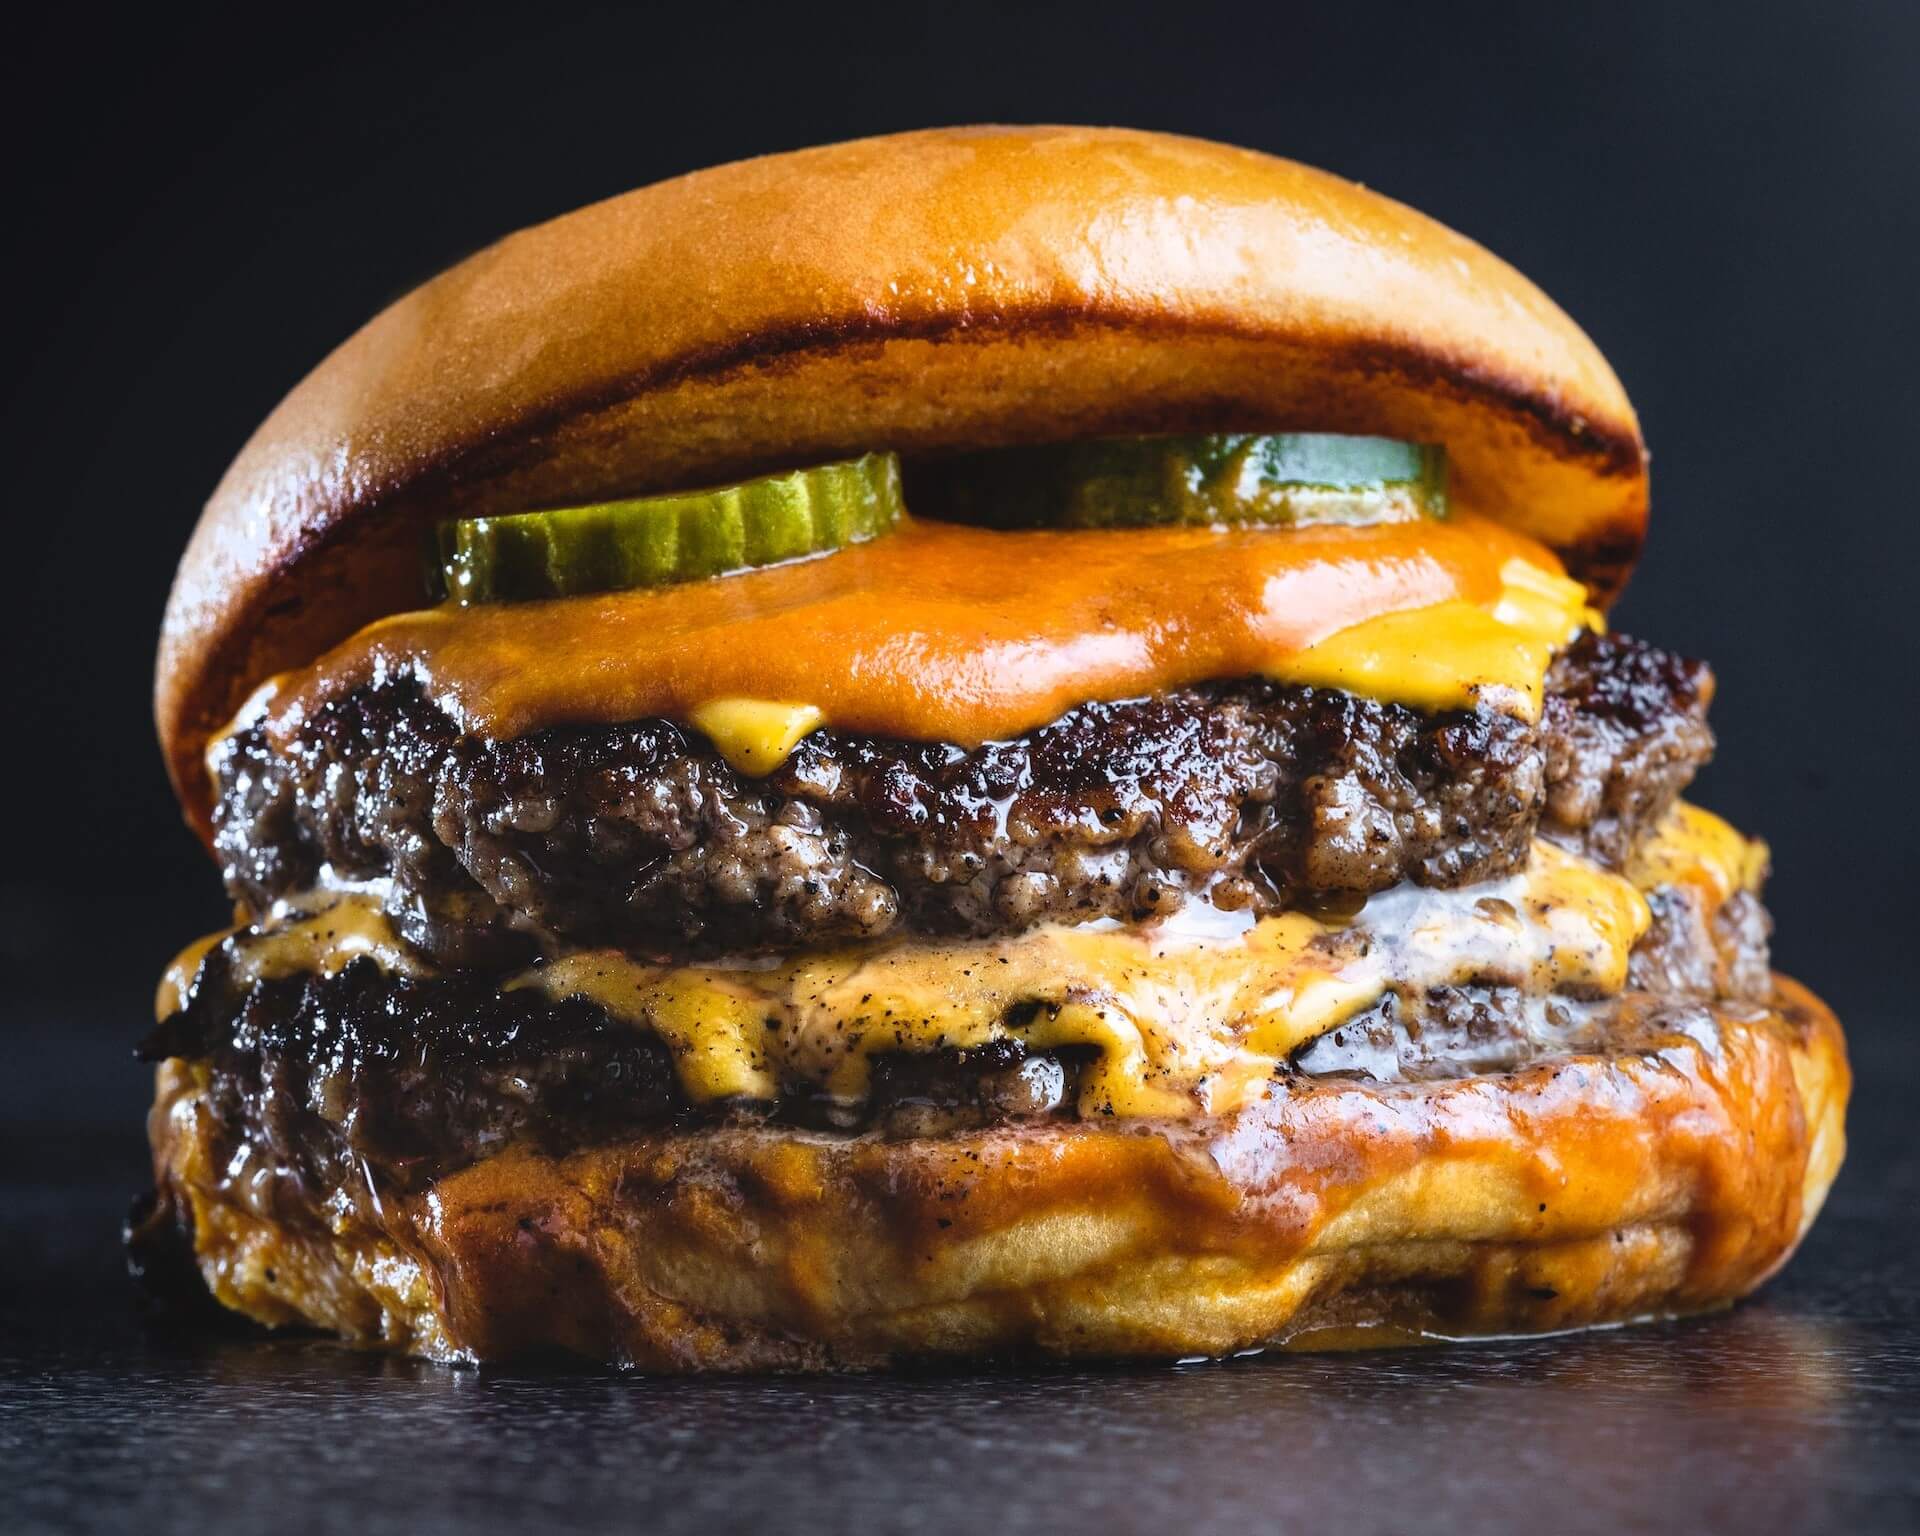
Closeup shot of double cheeseburger

Virtual kitchens and virtual brands are back in the headlines after a record-setting grand opening in Rutherford, New Jersey.

Well, I should clarify: A restaurant may now hold a specific record.

The restaurant in question is the first brick-and-mortar MrBeast Burger location. And the record it may hold claim to is most burgers sold in a single day by a single restaurant.


View this post on Instagram


A post shared by MrBeast Burger (@mrbeastburger)

Now, if you don’t spend much time on YouTube, you may not know MrBeast. So, here’s a quick rundown: He’s Jimmy Donaldson, a YouTube personality known for “expensive stunts.” In fact, he may be the pioneer of that type of content.

Right about now you may be wondering what this all has to do with virtual kitchens and brands. It’s quite simple, really. MrBeast was among the highest-profile virtual brands to launch during the pandemic.

Incredibly, MrBeast Burger boasts more than 1,700 virtual kitchen locations. And now, one brick-and-mortar MrBeast restaurant.

Leveraging Demand and Popularity

So, you’re an influential YouTube content creator with tens of millions of subscribers. Obviously, your channel is monetized. What else can you do to leverage your popularity?

Well, if there’s a pandemic crippling the globe and people are stuck at home, maybe you notice the demand for takeout and delivery. And perhaps you learn about something known as a “virtual kitchen.”

If you’re a foodie or maybe just a savvy businessperson, maybe you’d jump into the virtual space. It is, it goes without saying, much less expensive than opening your own restaurant. And if you perform well, that’s an excellent way to collect data and guest feedback.

Also, an efficient way to hone your brand without a lease, buildout or the overhead of a physical restaurant. In a way, a virtual brand is akin to a pop-up restaurant, only you can test hundreds of markets simultaneously.

Okay, so now let’s say you reach a rare milestone in the creator space: 100 million subscribers. MrBeast did just that in July of this year. Do you think you’d want to leverage the support of millions of fans willing to support you and your brand?

The first physical MrBeast Burger opened last week at the American Dream mall in New Jersey. Reports claim that over 10,000 people waited in line for the grand opening.

Oh, and that’s when the location may have claimed the aforementioned record: 5,500 burgers sold in one day. After just one day of operation, MrBeast wondered if the brand should franchise:

Virtual to Physical

This (potential) record-setting event brings virtual kitchens and brands back into the spotlight.

Of course, most virtual brands don’t have the same origin story as MrBeast. One hundred million supporters? That’s rarified air.

At any rate, virtual kitchens do offer potential physical restaurant operators a less expensive method of testing their concepts. Couple data collection and feedback with an accurate feasibility study and taking the next step may make sense. And it may make a tidy profit.

It’s possible we’ll see MrBeast franchise off the success of two years of operating virtually and opening a physical location. And it’s possible we’ll see other virtual brands expand beyond the virtual kitchen.

However, it’s important that virtual brand owners keep a few things in mind. One, online success doesn’t always translate to brick-and-mortar success. Two, the restaurant space doesn’t care about your subscriber count—the KPIs are entirely different here. Three, potential operators need to perform the proper studies—or retain an agency with experience performing them—rather than rushing into the restaurant space.

It’s highly likely we’ll see more virtual brands enter the physical restaurant world. How many will do so successfully remains to be seen.

Image: Eiliv-Sonas Aceron on Unsplash

by David Klemt David Klemt No Comments

2022 World Beer Cup Winners

2022 World Beer Cup Winners

by David Klemt

Person pouring draught beer

The Brewers Association‘s 2022 World Beer Cup identifies the top three beers across a staggering 103 separate categories.

If you enjoy multiplication, that’s 309 medals in a single competition. And that’s just the winners; there can be more than 200 entries in a single category.

So, yes—I envy the World Beer Cup judges. I mean, what beer fan wouldn’t want to taste all the entries into the Olympics of Beer?

This competition, developed by the Brewers Association, has been going strong since 1996. Next year’s competition, if you happen to brew beer and want to enter it, will take place in Nashville in May.

Okay, you may be wondering why I’m talking about this beer competition. The reason is simple: To get your ready for September.

There are three beer holidays to program for and celebrate next month:

  • National Beer Lover’s Day (September 7)
  • National Crush a Can Day (September 27)
  • Drink Beer Day (September 28)

Oh, and there’s this little event—Oktoberfest—that takes place from September 17 to October 3.

Below you’ll find 48 medal winners from 16 categories to give you a taste of the 2022 World Beer Cup results. For the full list, click here, then click the “2022 Winners” button.

Cheers!

Category 1: American Wheat Beer (68 entries)

  • Gold: For-scythe, Cherry Street Brewpub at Halcyon (Alpharetta, GA)
  • Silver: Hefe, Widmer Brothers Brewing (Portland, OR)
  • Bronze: American Wheat, Cerveceria Principia (Monterrey, Nuevo León, Mexico)

Category 2: Fruit Beer (134 entries)

  • Gold: Yuzu KSA, Fort Point Beer Co. (San Francisco, CA)
  • Silver: Berry, Berry, Quite Contrary, Territorial Brewing Co. (Springfield, MI)
  • Bronze: Grape Fruit Session IPA, Mahanine Brewing (Hohhot, People’s Republic of China)

Category 5: Pumpkin Beer (40 entries)

  • Gold: 5 Phantoms, Philipsburg Brewing Co. (Philipsburg, MT)
  • Silver: Ryes of the Pumpkin King, Sound2Summit Brewery (Snohomish, WA)
  • Bronze: Pumpkin Paddy, Launch Pad Brewery (Aurora, CO)

Category 9: Coffee Beer (79 entries)

  • Gold: Gusto Crema Coffee Ale, Georgetown Brewing Co. (Seattle, WA)
  • Silver: Daybreak, Wolf’s Ridge Brewing – Production Operations (Columbus, OH)
  • Bronze: Double Cream Coffee Dream, Dangerous Man Brewing Co. (Minneapolis, MN)

Category 10: Coffee Stout or Porter (112 entries)

  • Gold: Dusk til Dawn, Pizza Port San Clemente (San Clemente, CA)
  • Silver: Mocha Porter, Bend Brewing Co. (Bend, OR)
  • Bronze: Mocha Machine, Beachwood Brewing (Huntington Beach, CA)

Category 11: Specialty Beer (56 entries)

  • Gold: KURI KURO – Dark Chestnuts Ale, Miyazaki Hideji-Beer Co. (Nobeoka, Japan)
  • Silver: Agavemente, SouthNorte Beer Co. (Chula Vista, CA)
  • Bronze: Graham Cracker Porter, Denver Beer Co. (Denver, CO)

Category 14: Non-Alcohol Beer (123 entries)

  • Gold: Golden Lager, Grüvi (Denver, CO)
  • Silver: Non-Alcoholic Black Butte, Deschutes Brewery (Bend, OR)
  • Bronze: Parallel, Southern Grist Brewing Co. (Nashville, TN)

Category 15: Session Beer (43 entries)

  • Gold: Swift Half, Station 26 Brewing Co. (Denver, CO)
  • Silver: Peacekeeper, Launch Pad Brewery (Aurora, CO)
  • Bronze: Bucketty’s Pale Ale No. 2, Bucketty’s Brewing Co. (Brookvale, New South Wales, Australia)

Category 16: Session India Pale Ale (107 entries)

  • Gold: Trump Hands, Cannonball Creek Brewing Co. (Golden, CO)
  • Silver: Moon Rocks, Mickey Finn’s Brewery (Libertyville, IL)
  • Bronze: Tiny Juicy IPA, Five Boroughs Brewing Co. (Brooklyn, NY)

Category 22: Gluten-Free Beer (66 entries)

  • Gold: La Gosa Rita, Lakefront Brewery (Milwaukee, WI)
  • Silver: Little Brown Job, Lucky Pigeon Brewing Co. (Biddeford, ME)
  • Bronze: Glutenberg Session IPA, Glutenberg (Montréal, Québec, Canada)

Category 91: American-Style Pale Ale (160 entries)

  • Gold: Figueroa Mountain Mosaic, Figueroa Mountain Brewing Co. (Santa Barbara, Santa Barbara, CA)
  • Silver: Cruisin’, Pizza Port Bressi Ranch (Carlsbad, CA)
  • Bronze: Somewhere Golden, Institution Ale Co. (Camarillo, CA)

Category 92: Juicy or Hazy Pale Ale (141 entries)

  • Gold: Hazealicious, Reuben’s Brews – The Taproom (Seattle, WA)
  • Silver: Baby Azacca, 33 Brewing Experiment (Vancouver, British Columbia, Canada)
  • Bronze: Haze in the Park, Kings & Convicts Brewing Co. (San Diego, CA)

Category 95: Imperial India Pale Ale (174 entries)

  • Gold: Space Lettuce, Monday Night Brewing (Atlanta, GA)
  • Silver: Cali Boy, No Label Brewing Co. (Katy, TX)
  • Bronze: Devil’s Pool, Wissahickon Brewing Co. (Philadelphia, PA)

Category 96: Juicy or Hazy Imperial India Pale Ale (171 entries)

  • Gold: Pantless Thunder Goose, Mast Landing Brewing Co. (Westbrook, ME)
  • Silver: Houblon Deluxe, Pure Project (Vista, CA)
  • Bronze: Citra Powered Jetpack, Barebottle Brewing Co. (San Francisco, CA)

Category 102: American-Style India Pale Ale (384 entries)

  • Gold: Hop-Fu!, North Park Beer Co. (San Diego, CA)
  • Silver: Super Slap, Brewery X (Anaheim, CA)
  • Bronze: Aurora Hoppyalis IPA, Karl Strauss Brewing Co. (San Diego, CA)

Category 103: Juicy or Hazy India Pale Ale (343 entries)

  • Gold: Rhymes Like Dimes, Xül Beer Co. (Knoxville, TN)
  • Silver: Blue Comet, Widowmaker Brewing (Braintree, MA)
  • Bronze: Tasty Jams, Brix City Brewing (Little Ferry, NJ)

Image: Josh Olalde on Unsplash

by David Klemt David Klemt No Comments

Datassential’s State of the Operator 2022

Datassential’s State of the Operator 2022

by David Klemt

Guests sitting at the bar inside a restaurant

The latest addition to the Datassential FoodBytes research series shares insights into the top three challenges most—if not all—operators are facing.

Now, some of what the report reveals paints a bleak picture. Inflation, the labor shortage, and supply chain issues persist even past the midway point of 2022.

However, operators are a tenacious and innovative group of business owners. Of course, that tenacity seems to manifest in people thinking this industry can weather any storm. That perception can come at operators’ detriment. Exhibit A: The Inflation Reduction Act of 2022 not including replenishing of the RRF. But, I digress.

“The State of the Operator & the Road Ahead,” which you can download here, is helpful and informative. As you may be aware, we’re fans of Datassential and their FoodBytes reports. In fact, you can find our synopses of FoodBytes reports here and here.

Below are some key points that operators should be aware for consideration. I strongly urge you to download this free report today.

Operator Outlook

First, let’s take a look at traffic. As Datassential points out, some hospitality business segments are performing better than others currently.

In large part, this is due to two factors: People working from home, and people returning to travel. So, operators who rely heavily on commuters and in-person workers are struggling. On the other hand, operators inside or around hotels are, per Datassential, performing the strongest at the moment.

Interestingly, though, nearly half of operators (47 percent) are seeing an increase in traffic in comparison to pre-Covid levels. Fourteen percent of operators are reporting no change in traffic. Unfortunately, traffic is lower for 39 percent of operators.

Next, sales. In comparison to pre-Covid times, more than half (51 percent) of operators report an increase. Again, 14 percent of operators are experiencing no change. But 35 percent of operators are experiencing a decrease in sales.

Finally, profit margins. Half of operators may be seeing increases in traffic in sales, but profit margins are taking a hit. On average, the industry’s profit margin is now hovering at 13 percent. That’s an eight-percent drop in comparison to pre-Covid levels.

Segment Performance

The findings regarding profit margins are likely to be the most alarming to operators. Historically, our industry has operated on razor-thin margins for decades. Dropping from an average of 21 percent to 13 is concerning.

However, context is important. The segments seeing the lowest profit margins in 2022 are: Business & Industry (B&I), Healthcare, and Colleges & Universities (C&U). Again, remote work (and learning) are largely responsible for those particular segments watching their profit margins tumble.

The strongest performers are: Quick-Service Restaurants (QSR) at 17 percent; Fast Casual at 15 percent); and Midscale, Casual Dining, and Fine Dining, each at 13 percent. Lodging is just below the current average at 12 percent.

Operator Adaptation

Inflation, rising food costs, supply chain issues, labor shortages… Operators are finding ways to cope, and in some situation, thrive.

Unsurprisingly, the vast majority of operators are increasing menu prices. In the past 12 months, 77 percent of operators have raised menu prices at least once.

These increases range from one percent a staggering 30 percent. However, the majority have kept these increases to one to ten percent. Most (31 percent) have implemented increases of no more than five percent. Just one percent of operators boosted prices between 25 to 30 percent.

Of course, raising prices isn’t the only strategy operators have at their disposal. Forty percent of operators are streamlining their menu, reducing the sizes of their menus. However, it’s wise for operators to review their menus at least every three months to eliminate poor performers.

Other strategies include focusing on value for guests (27 percent); utilizing LTOs and launching new menu items (26 percent); eliminating a specific daypart or portion of the menu (25 percent); and making portion sizes small, or “shrinkflation” (18 percent).

There’s much more revealed in Datassential’s latest FoodBytes report. Download your copy today.

Image: Luca Bravo on Unsplash

by David Klemt David Klemt No Comments

2022 World’s 50 Best Restaurants: 1-50

2022 World’s 50 Best Restaurants: 1-50

by David Klemt

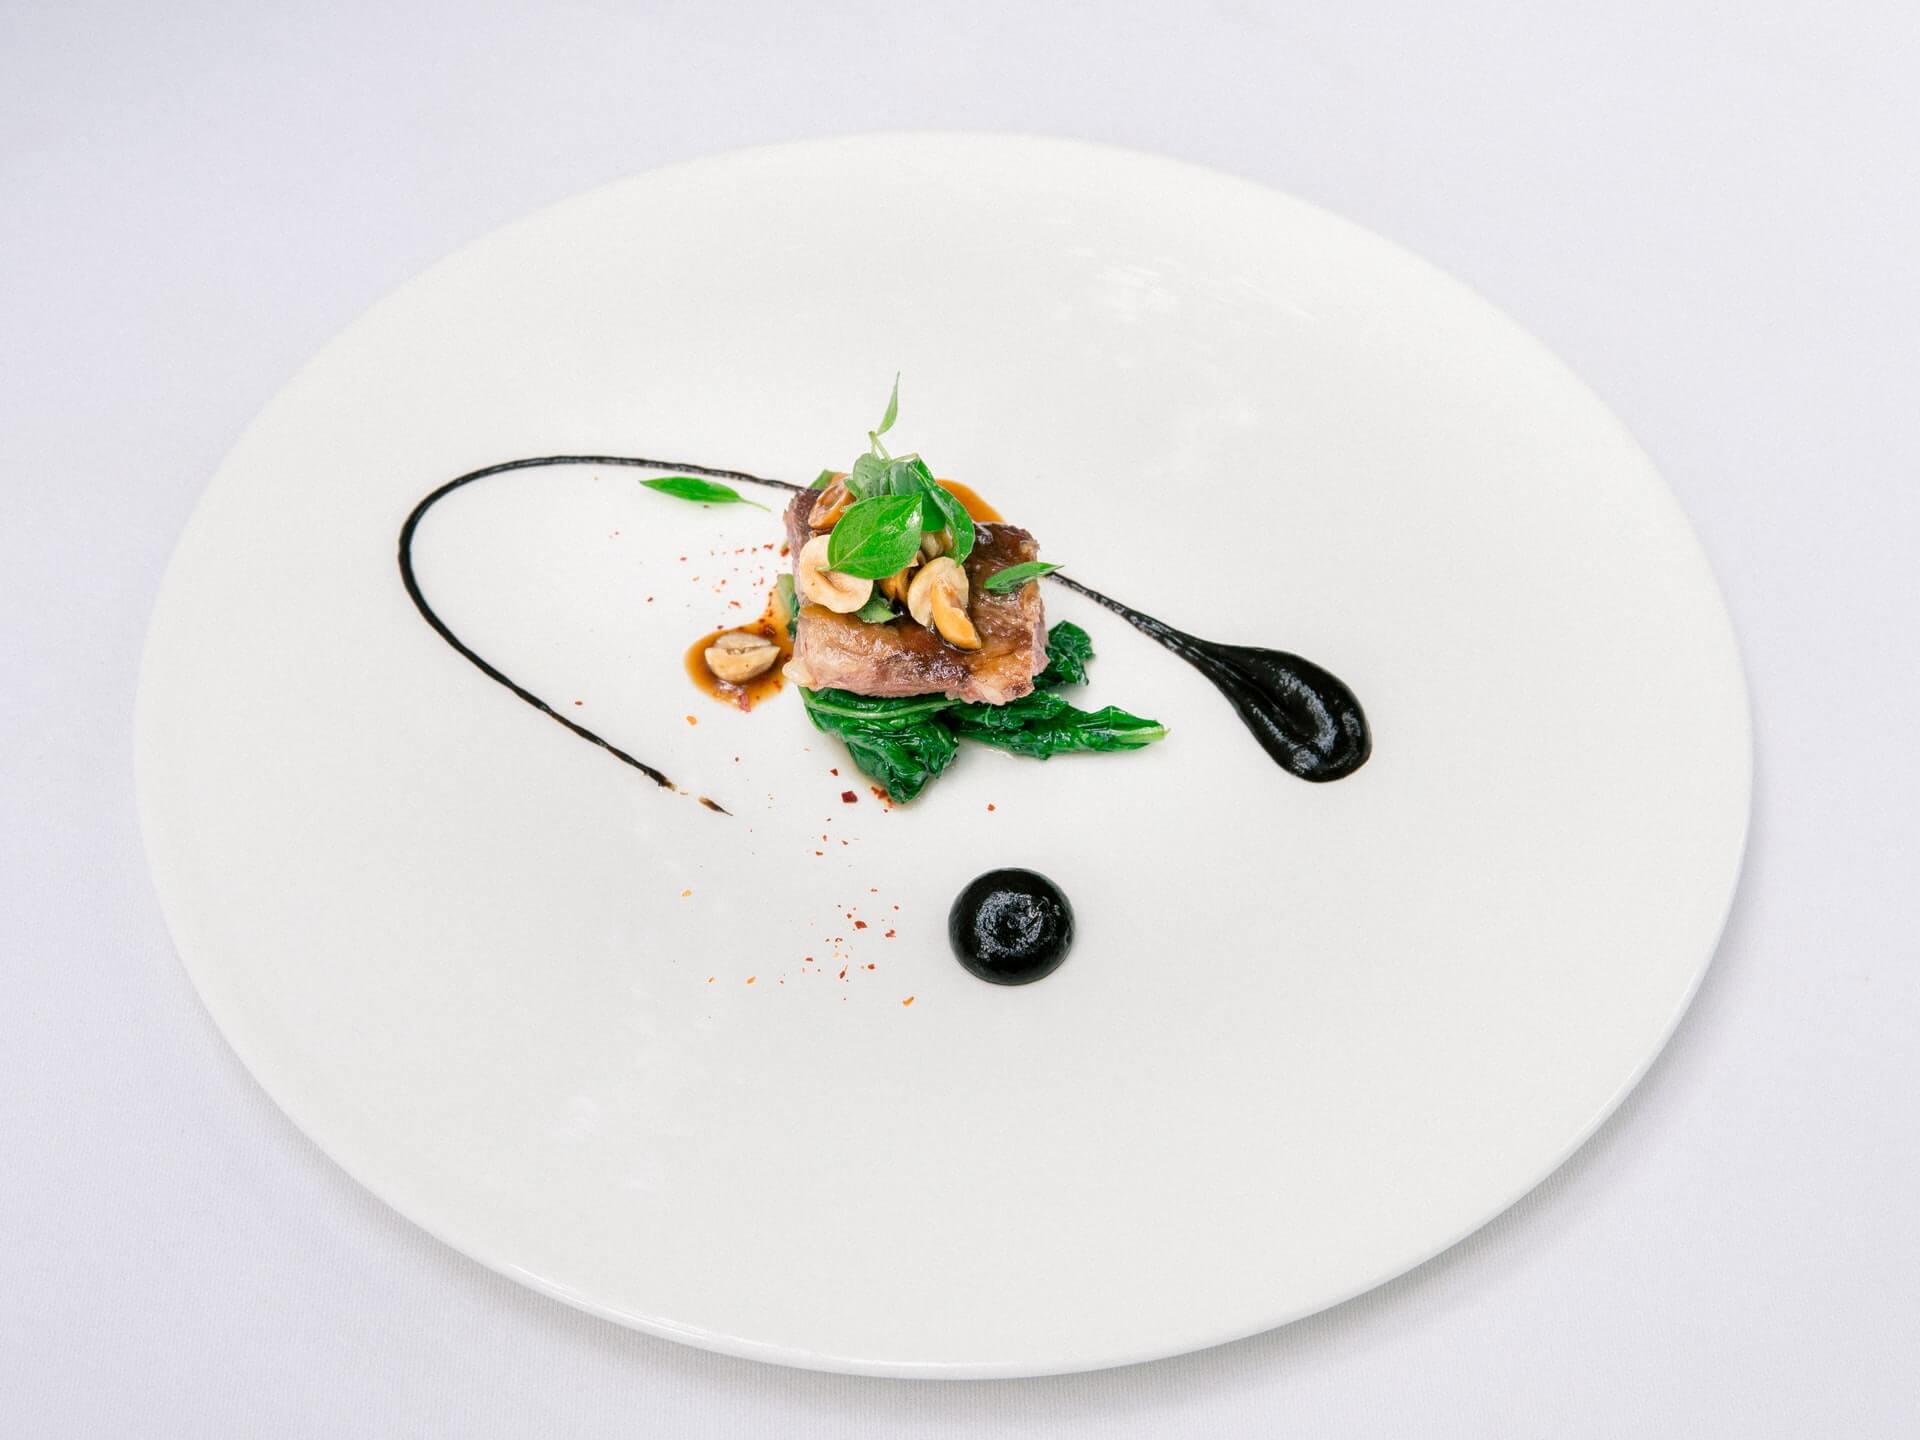
Gourmet dish on white background

Finally, the World’s 50 Best announces the World’s 50 Best Restaurants, an impressive list of the finest places to dine across the globe.

Of course, this highly anticipated news comes on the heels of the World’s 50 Best Restaurants, 51 to 100. Last night, host Stanley Tucci and special guest co-hosts announced the winners in London.

Perhaps not too surprisingly, only three American restaurants are among this year’s top fifty. Of those three, one is in Healdsburg, California, which is the wine-producing region of Sonoma County. The other two American restaurants are in New York City, which isn’t exactly a surprise. And of those two restaurants, one, number 33 on this year’s list, is the winner of the Gin Mre Art of Hospitality Award.

Unfortunately, there are no Canadian restaurants on the World’s 50 Best Restaurants 2022 list. That applies to the back half of the list, numbers 51 to 100, as well.

Interestingly, the restaurant taking home the title of World’s Best Restaurant 2022 took the number two spot in 2021. Another hint: This year’s number one, by clinching the top slot, is also the Best Restaurant in Europe 2022.

So, do you think you know what restaurant is the best in the world? Scroll down to see if you’re right.

The World’s 50 Best Restaurants 2022: 50 to 1

  1. Single Thread (Healdsburg, California, USA)
  2. Ikoyi (London, England)
  3. Leo (Bogotá, Colombia)
  4. Oteque (Rio de Janeiro, Brazil)
  5. Belcanto (Lisbon, Portugal)
  6. Narisawa (Tokyo, Japan)
  7. Le Bernardin (New York, New York, USA)
  8. Boragó (Santiago, Chile)
  9. Quique Dacosta (Dénia, Spain)
  10. La Cime (Osaka, Japan)
  11. Schloss Schauenstein (Fürstenau, Switzerland)
  12. Sorn (Bangkok, Thailand)
  13. Jordnær (Copenhagen, Denmark)
  14. Fyn (Cape Town, South Africa)
  15. Odette (Singapore)
  16. The Clove Club (London, England)
  17. Hiša Franko (Kobarid, Slovenia)
  18. Atomix (New York, New York, USA)(Gin Mare Art of Hospitality Award 2022)
  19. Mayta (Lima, Peru)
  20. Arpège (Paris, France)
  21. Florilège (Tokyo, Japan)
  22. St. Hubertus (San Cassiano, Italy)
  23. Le Clarence (Paris, France)
  24. Hof Van Cleve (Kruishoutem, Belgium)
  25. Restaurant Tim Raue (Berlin, Germany)
  26. Frantzén (Stockholm, Sweden)
  27. The Chairman (Hong Kong)
  28. The Jane (Antwerp, Belgium)
  29. Septime (Paris, France)
  30. Mugaritz (San Sebastian, Spain)
  31. Den (Tokyo, Japan)
  32. Piazza Duomo (Alba, Italy)
  33. The Alchemist (Copenhagen, Denmark)
  34. Nobelhart & Schmutzig (Berlin, Germany)(Villa Massa Highest Climber Award 2022)
  35. Elkano (Getaria, Spain)
  36. Reale (Castel di Sangro, Italy)
  37. Don Julio (Buenos Aires, Argentina)
  38. Steirereck (Vienna, Austria)
  39. Uliassi (Senigallia, Italy)(Highest New Entry Award 2022)
  40. Maido (Lima, Peru)
  41. Le Calandre (Rubano, Italy)
  42. Quintonil (Ciudad de México, México)(Estrella Damm Chef’s Choice Award: Chef Jorge Vallejo)
  43. Lido 84 (Gardone Riviera, Italy)
  44.  A Casa do Porco (São Paulo, Brazil)
  45. Asador Etxebarri (Atxondo, Spain)
  46. Pujol (Ciudad de México, México)
  47. Diverxo (Madrid, Spain)
  48. Disfrutar (Barcelona, Spain)
  49. Central (Lima, Peru)
  50. Geranium (Copenhagen, Denmark)

Image: Delightin Dee on Unsplash

by David Klemt David Klemt No Comments

Is Your Business in a Top Time Out City?

Is Your Business in a Top Time Out City?

by David Klemt

The Bean aka Cloud Gate in Chicago

Hot off the presses, Time Out is now revealing the results of their Time Out Index 2022, an annual list identifying the world’s top cities.

The global publication, founded in the late 1960s, surveyed 20,000 “city dwellers.” Time Out focuses on cities’ restaurant, bar, nightlife, entertainment, and art scenes.

For 2020 and 2021, Time Out put emphasis on the pandemic and how cities maintained resiliency and kept communities together. In 2022, priority is given to flourishing nightlife, dining, and drinking, along with culture.

Additionally, Time Out gives weight to a city’s sustainability, safety, walkability, and affordability. To learn more about how Time Out analyzes data, click here.

Compelling Rankings

Below, you’ll find Time Out’s ranking of the best 53 cities in the world for 2022. I’ve broken the list into sections: 53 to 11, and ten to number one.

Interestingly, the 20,000 survey respondents note the dining, drinking, and nightlife of the top five cities. In fact, the nightlife scene of number three is “the world’s best.”

And city number two? Survey takers think it’s the most fun—”funnest,” according to Time Out—in the world.

Now, I know our audience is largely American and Canadian, so I’ll get to how both rank. Six cities—the usual suspects, basically—in the US are on the list. Only one American city is in the top ten, and it’s likely not the one you think. As for Canada, one city claims the 27 spot, another is number nine.

You’ll find the Canadian and American cities in bold below. Champing at the bit to see the results? Scroll down!

Time Out Cities 53 to 11

  1. Doha, Qatar
  2. Hong Kong
  3. Bangkok, Thailand
  4. Istanbul, Turkey
  5. Johannesburg, South Africa
  6. Rio de Janeiro, Brazil
  7. Auckland, New Zealand
  8. Sydney, Australia
  9. Abu Dhabi, United Arab Emirates
  10. Singapore
  11. Accra, Ghana
  12. Los Angeles, California, USA
  13. Rome, Italy
  14. Dubai, United Arab Emirates
  15. Barcelona, Spain
  16. Miami, Florida, USA
  17. São Paulo, Brazil
  18. Dublin, Ireland
  19. Athens, Greece
  20. Manila, Philippines
  21. Kuala Lumpur, Malaysia
  22. Paris, France
  23. Tel Aviv, Israel
  24. Mexico City, Mexico
  25. Boston, Massachusetts, USA
  26. Lisbon, Portugal
  27. Toronto, Ontario, Canada
  28. Delhi, India
  29. San Francisco, California, USA
  30. Tokyo, Japan
  31. Stockholm, Sweden
  32. Birmingham, England
  33. Buenos Aires, Argentina
  34. New York, New York, USA
  35. Lyon, France
  36. Porto, Portugal
  37. London, England
  38. Taipei, Taiwan
  39. Melbourne, Victoria, Australia
  40. Mumbai, India
  41. Manchester, England
  42. Madrid, Spain
  43. Cape Town, South Africa

The Top Ten Time Out Cities

  1. Copenhagen, Denmark
  2. Montréal, Québec, Canada
  3. Berlin, Germany
  4. Marrakech, Morocco
  5. Prague, Czech Republic
  6. Amsterdam, Netherlands
  7. Glasgow, Scotland
  8. Medellín, Colombia
  9. Chicago, Illinois, USA
  10. Edinburgh, Scotland

Congratulations to the top 53 cities in the world! We expect big things from their dining, drinking, and nightlife moving forward.

Image: Christopher Alvarenga on Unsplash

by David Klemt David Klemt No Comments

What’s Up with Meat, Poultry and Seafood?

What’s Up with Meat, Poultry and Seafood?

by David Klemt

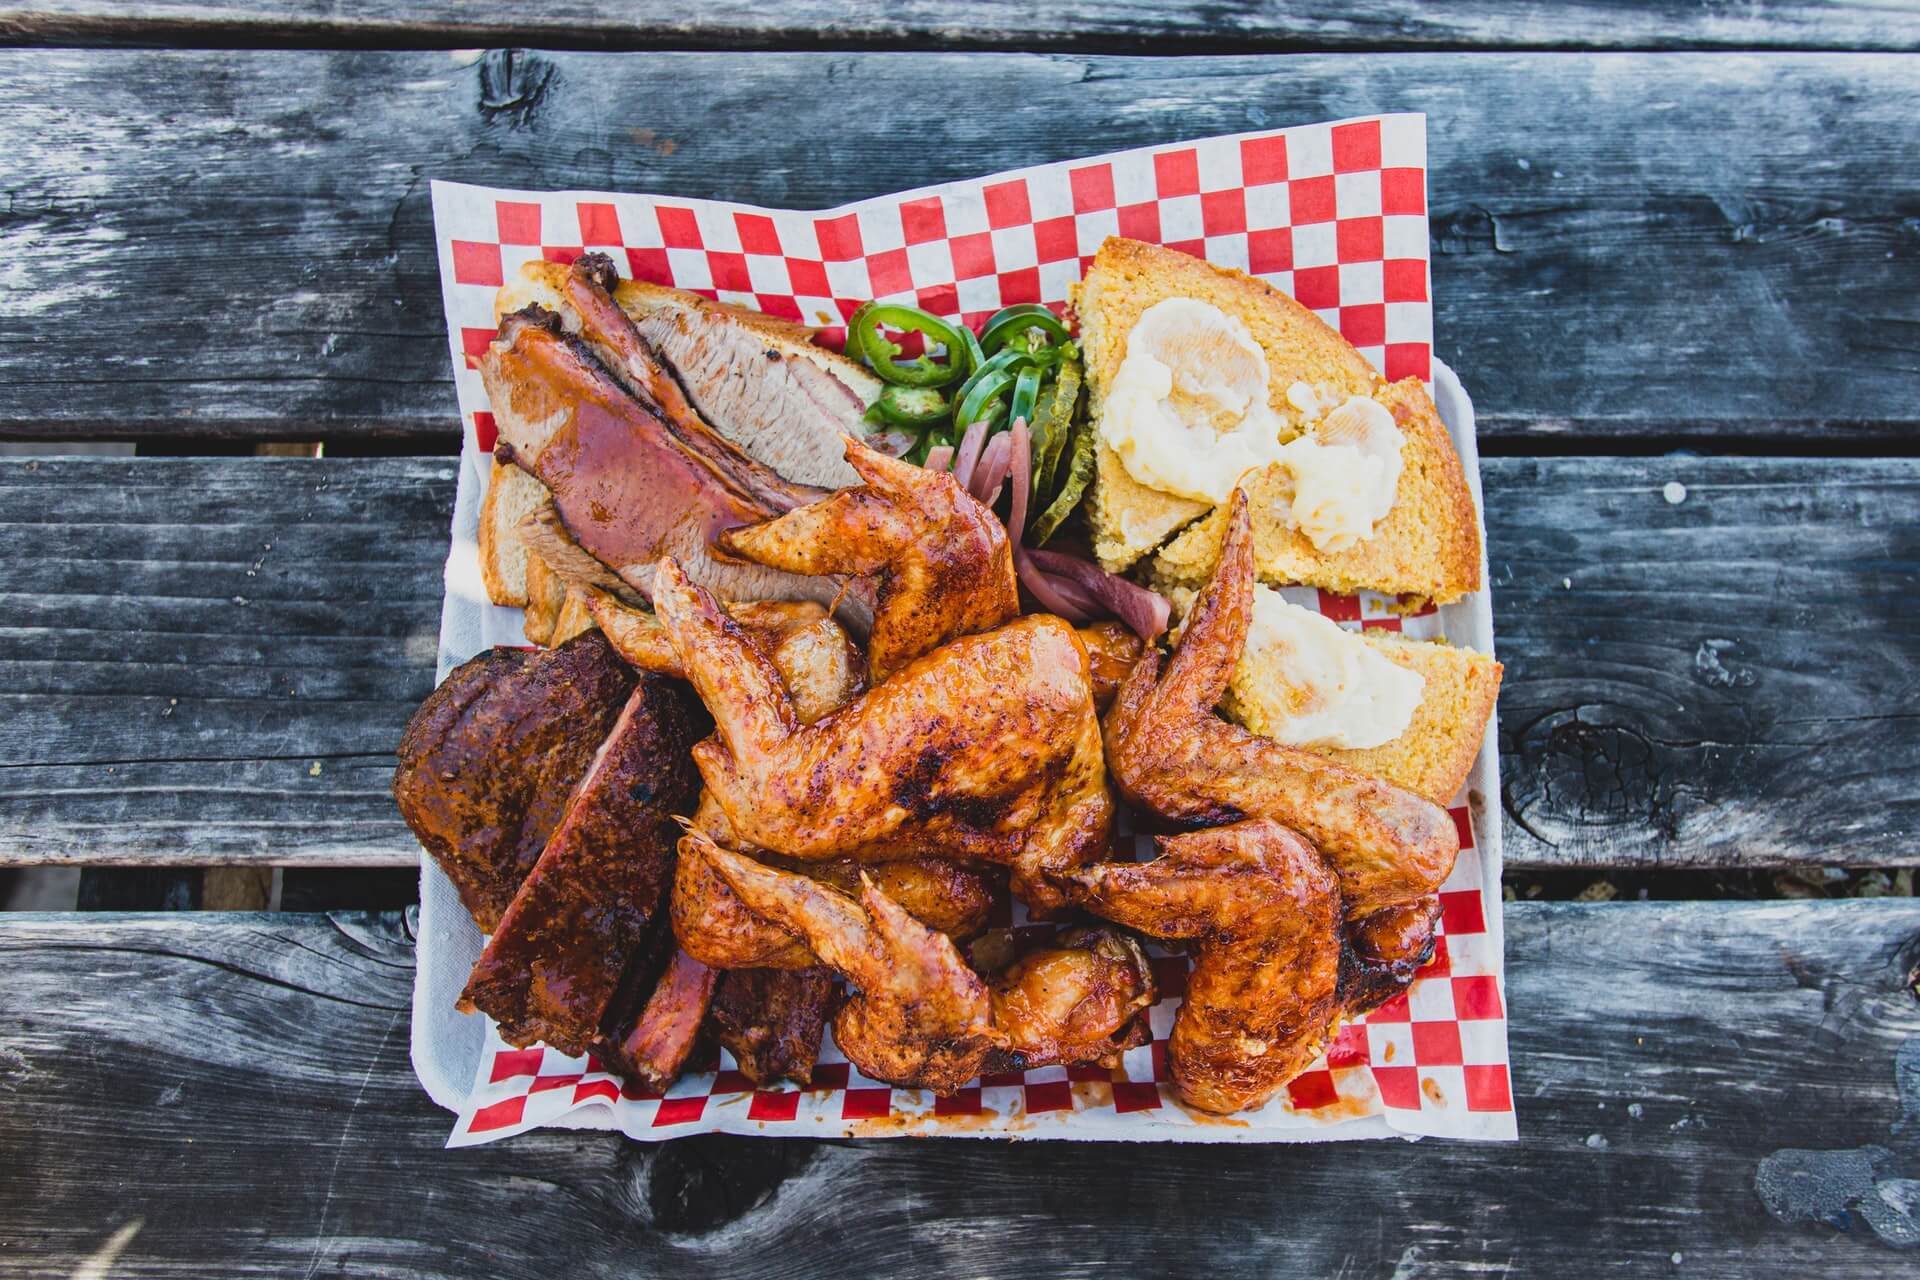
Barbecue food plate on wooden table

We know how plant proteins are performing with consumers but what do we know about how meat, poultry, and seafood are doing?

Well, because of a recent report from Datassential, we know many consumers are “meat-limiters.” And research from the World Resources Institute shows that plant-based performance is nuanced.

Interestingly, the performance of animal proteins on-premise appears to be following a beverage trend: Moderation. According to Datassential, more consumers are reducing their consumption of meat and poultry than increasing it in comparison with 2021.

So, meat-limiters may be indicative of the future of meat consumption.

Consumer Shifts

As the name implies, meat-limiters are limiting or otherwise reducing their consumption of animal proteins. Importantly, it doesn’t appear that a significant percentage of consumers are eliminating animal proteins from their diets.

Rather, many people are simply increasing the amount of plant-based items they’re eating. However, that increase is more aspirational than real in some cases.

Per Datassential’s survey of 1,500 consumers in the US, just over 70 percent of people are meat eaters. In contrast, nearly 25 percent are “flexitarian.” Just two percent are vegan or pescatarian, and only three percent are vegetarian.

So, the vast majority of Americans are still consuming meat, poultry, and seafood. We just now have reason to believe that more consumers may be leaning toward a flexitarian diet.

A bit over a quarter of consumers consume meat every day. Still, many people aspire to eat more vegetables, fruits, and whole grains, per Datassential.

However, there are more pescatarians, vegans, and vegetarians among Gen Z than the overall population. According to Datassential, this could indicate a shift away from animal proteins in the future.

Meat Performance is Nuanced

Just like plant-based performance, meat performance is nuanced. There are many factors at play.

Shifts in what consumers value are driving changes to the performance of proteins. Health, sustainability, the climate, taste, and affordability have an effect on all proteins, animal and plant.

Undeniably, inflation and shaken consumer confidence are impacting protein performance. Everything, it seems, is more expensive at the moment. Generally speaking, animal proteins are pricier than plant-based items.

It makes sense, then, that some consumers are reducing their intake of animal proteins and filling that void with fruits, veggies, and legumes.

Of particular note are shifts in daily and weekly consumption of animal proteins in 2022. Meat consumption once or more per week—beef, lamb, pork, veal—is up three percent. However, there’s a ten-percent increase in consumers eating poultry once or more per week.

Interestingly, daily poultry consumption is down seven percent in comparison with 2021. Likewise, daily consumption of seafood is also down seven percent, and fewer people are consuming it less than once per week.

Plant-based is Down

Despite what some would think, meat-limiters don’t appear to be driving up plant proteins significantly.

In fact, according to Datassential, the daily consumption of plant-based proteins is down. Per the research firm, seitan, tempeh, and tofu are the experiencing the greatest drop in daily consumption.

The fact is that across generations, more consumers eat animal proteins on a daily basis than their plant-based counterparts. Gen Z, per Datassential, consumes more animal proteins on a daily basis than other generations.

So, how does it make sense that people are reducing their meat intake but plant-based isn’t seeing a sizable jump in consumption?

In part, the answer is the growing popularity of plant-forward dishes. These are items, like bowls, that offer a small amount of meat, poultry, seafood or dairy. The majority of these menu items consists of plants but are not free of animal proteins completely.

The path forward may indeed be a plant-forward menu. Of course, this is heavily reliant on a specific concept or brand. Still, it’s likely many restaurants can do well offering mixed dishes, those heavier on plant proteins than animal proteins.

Image: Peter Pham on Unsplash

Note: This article is based on information from Datassential’s “2022 Plant-Forward Opportunity” report. To access a number of free reports, sign up with Datassential today.

by David Klemt David Klemt No Comments

2022 World’s 50 Best Restaurants: 51-100

’22 World’s 50 Best Restaurants: 51-100

by David Klemt

High-end plate of food

Just a week away from their big 2022 reveal, numbers 51 through 100 of the World’s 50 Best Restaurants is now available.

As one expects, these restaurants represent the pinnacle of dining. The 2022 list also represents a number of changes in comparison to 2021.

For example, a number of restaurants in the Middle East are among this year’s 51 to 100 rankings. Notably, these restaurants were not included on last year’s list. In fact, nearly half of the restaurants are new entries on the 51 to 100 list.

Additionally, the 2022 list represents six continents. This year, four “new” countries and a sovereign island city-state make the 51 to 100 rankings:

  • Argentina
  • China
  • Germany
  • Singapore
  • UAE

The regional breakdown is as follows:

  • Asia: 14 restaurants
  • Europe: 13 venues
  • North America: 11 concepts
  • Middle East: 2 restaurants
  • Africa: 2 concepts
  • Oceania: 1 venue
  • South America: 7 restaurants

Just six American restaurants are on the list. Three are in New York, two in San Francisco, and one is in Chicago. Disappointingly, zero Canadian restaurants are among the 51 to 100 rankings.

Restaurants one through 50 will be revealed on Monday, July 18. Numbers 51 to 100 of the World’s 50 Best Bars will be revealed Tuesday, September 27.

The World’s 50 Best Restaurants 2022: 51 to 100

  1. Alcalde (Guadalajara, Jalisco, México)
  2. Sud 777 (Ciudad de México, México)
  3. D.O.M. (São Paulo, SP, Brazil)
  4. Lyle’s (London, England)
  5. Azurmendi (Larrabetzu, Biscay, Spain)
  6. La Colombe (Cape Town, Western Cape, South Africa)
  7. Trèsind Studio (Dubai, UAE)
  8. Alléno Paris au Pavillon Ledoyen (Paris, France)
  9. Sazenka (Tokyo, Japan)
  10. Rosetta (Ciudad de México, México)
  11. La Grenouillère (La Madelaine-sous-Montreuil, France)
  12. Ernst (Berlin, Germany)
  13. Chef’s Table at Brooklyn Fare (New York, NY, USA)
  14. Fu He Hui (Shanghai, People’s Republic of China)
  15. Le Du (Bangkok, Thailand)
  16. Sühring (Bangkok, Thailand)
  17. Evvai (São Paulo, SP, Brazil)
  18. Kjolle (Barranco, Lima, Perú)
  19. Cosme (New York, NY, USA)
  20. Zén (Singapore)
  21. Mingles (Seoul, South Korea)
  22. Atelier Crenn (San Francisco, CA, USA)
  23. Kol (London, England)
  24. Blue Hill at Stone Barns (Pocantico Hills, Mount Pleasant, NY, USA)
  25. Samrub Samrub (Bangkok, Thailand)
  26. Neighborhood (Hong Kong)
  27. Table by Bruno Verjus (Paris, France)
  28. Lasai (Rio de Janeiro, RJ, Brazil)
  29. Estela (New York, NY, USA)
  30. AM par Alexandre Mazzia (Marseille, France)
  31. Brat (London, England)
  32. Sézanne (Tokyo, Japan)
  33. El Chato (Bogotá, DC, Colombia)
  34. Gimlet at Cavendish House (Melbourne, Victoria, Australia)
  35. Raan Jay Fai (Bangkok, Thailand)
  36. Mikla (Beyoğlu/İstanbul, Turkey)
  37. Orfali Bros Bistro (Dubai, UAE)
  38. Mishiguene (Buenos Aires, Argentina)
  39. Máximo Bistrot (Ciudad de México, México)
  40. Wolfgat (Paternoster, Western Cape, South Africa)
  41. Oriole (Chicago, IL, USA)
  42. Indian Accent (New Delhi, Delhi, India)
  43. Hertog Jan at Botanic Sanctuary (Antwerp, Belgium)
  44. Burnt Ends (Singapore)
  45. Meta (Singapore)
  46. Maní (São Paulo, SP, Brazil)
  47. Benu, San Francisco, CA, USA)
  48. Tantris (München, Germany)
  49. Flocons de Sel (Megève, France)
  50. Wing (Hong Kong)

*Bold denotes new entry

Image: Delightin Dee on Unsplash

by David Klemt David Klemt No Comments

Meat-limiters Driving Change

Meat-limiters Driving Change

by David Klemt

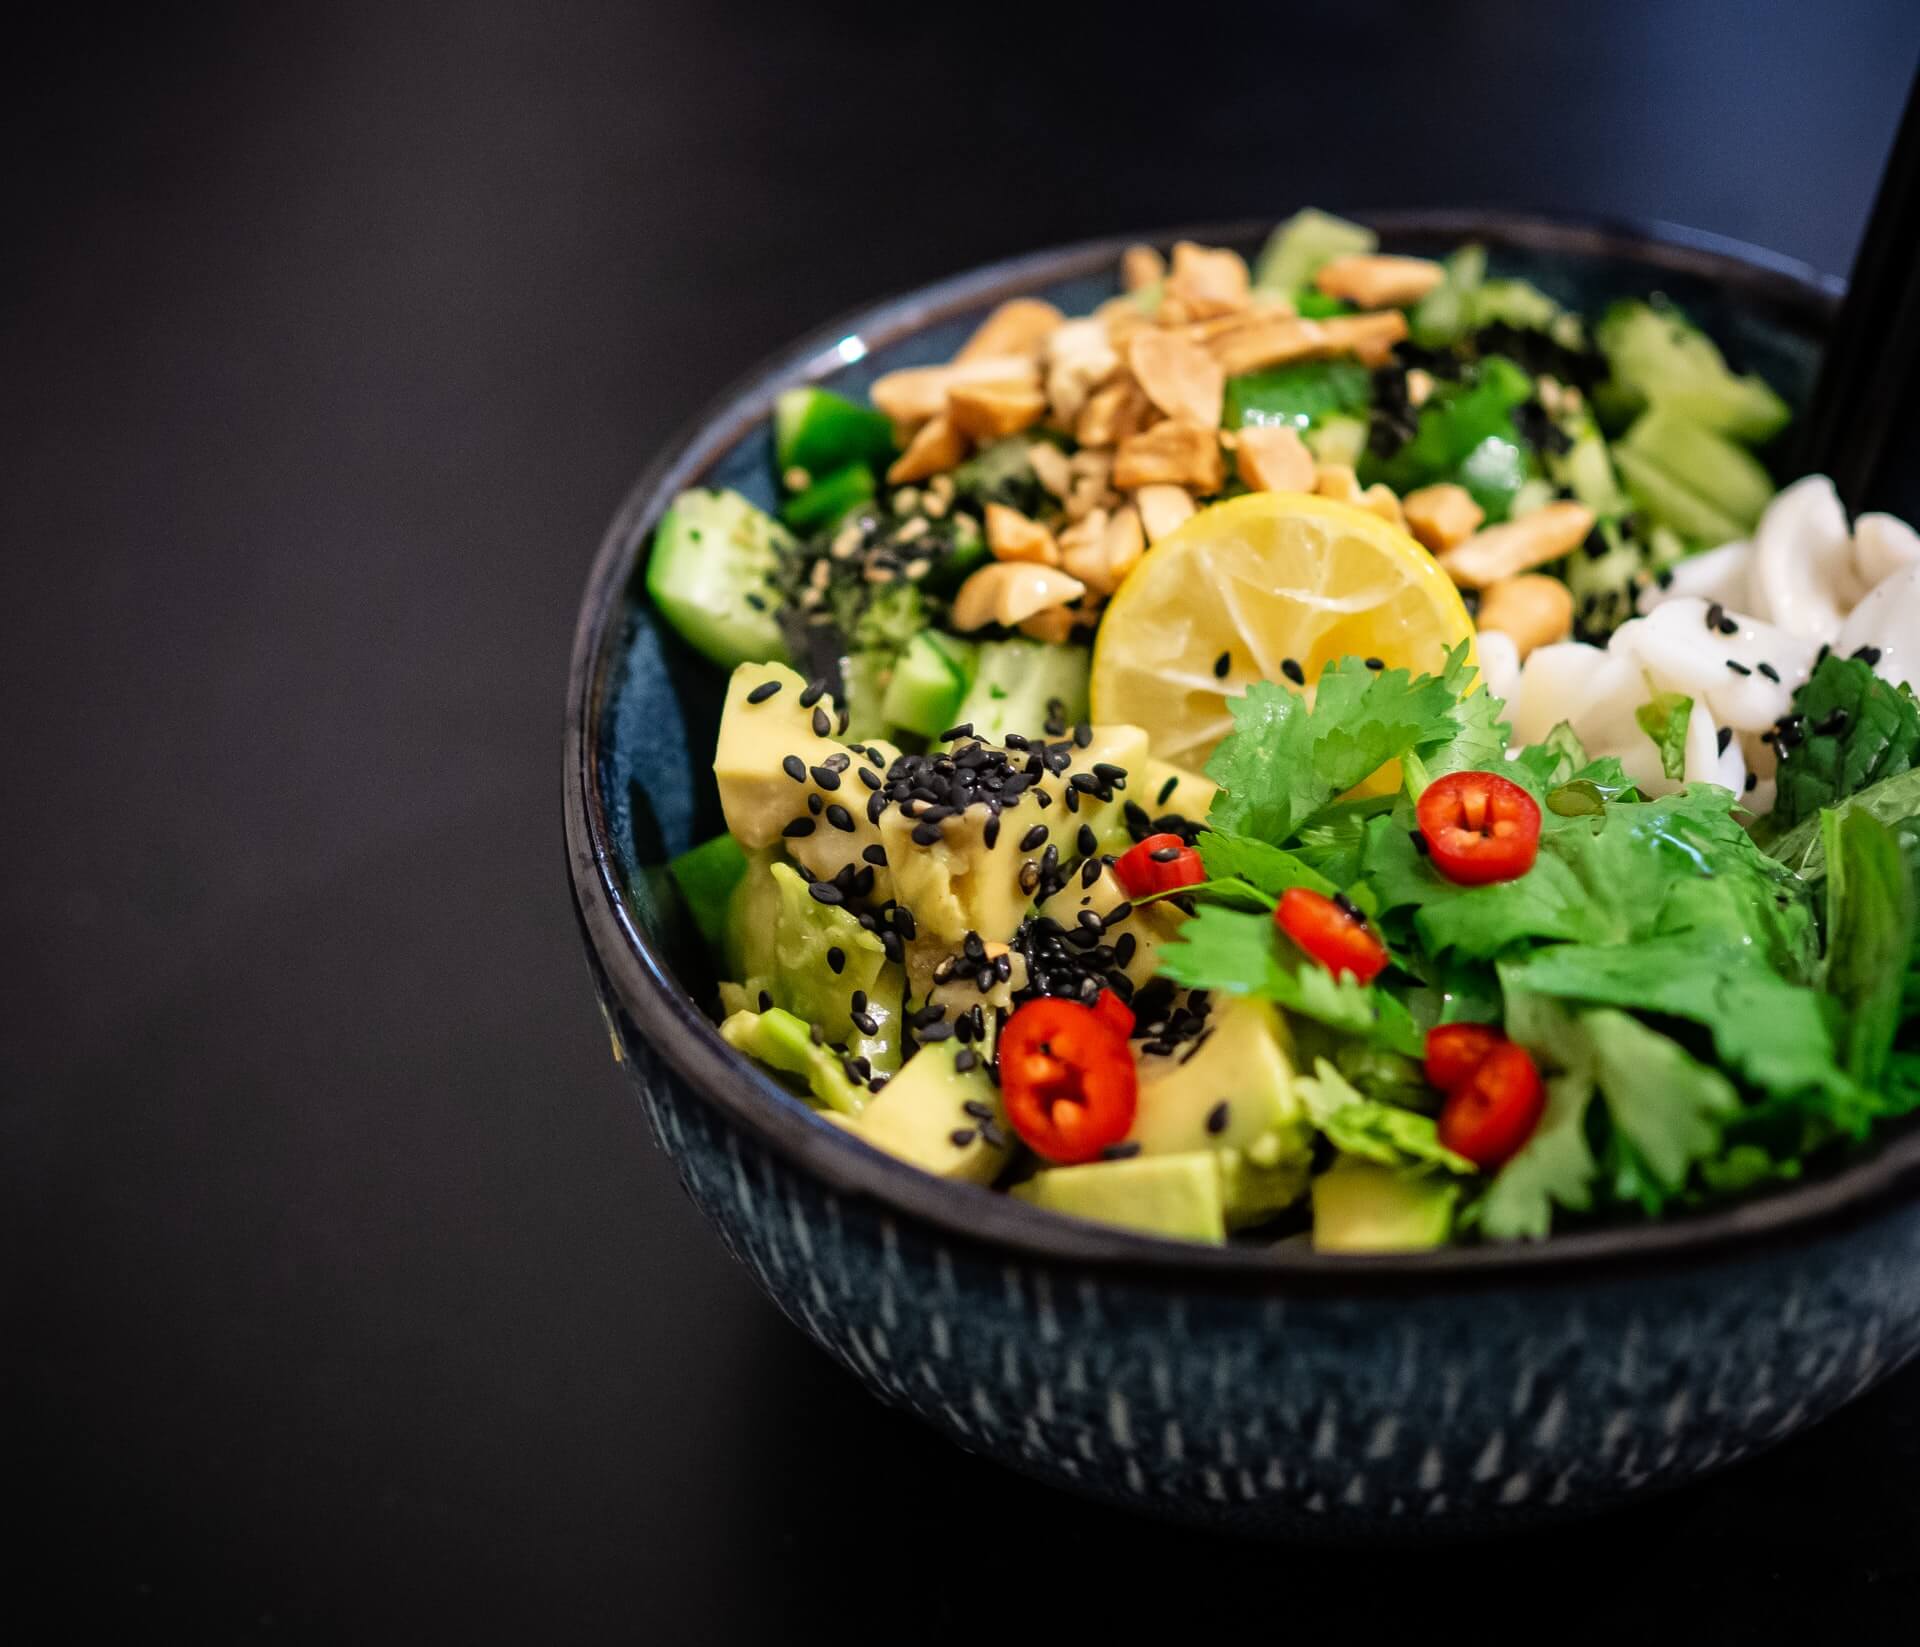
Plant-based food bowl

You’re likely familiar with dietary terms like vegetarian, vegan, pescatarian, and even flexitarian, but what about meat-limiter?

As the name implies, a meat-limiter is a person actively choosing to reduce their meat intake. It’s also an umbrella term that includes vegan, vegetarian, pescatarian, or flexitarian diets.

Earlier this year, Datassential took a look at plant-based opportunities. Over the course of a week, 1,500 Americans ages 18 to 88 were surveyed online.

Datassential conducted their research with three partners:

  • The Culinary Institute of America
  • Food for Climate League
  • Menus of Change University Research Collaborative

The results are revealed within Datassential’s “2022 Plant-Forward Opportunity” report. To access a number of free reports, sign up with Datassential today.

Meat-limiter Guests

Just over a quarter of Americans—29 percent—are meat-limiters in some way. That number climbs to 36 percent for Gen Z, per this Datassential survey.

Of four major diets (vegetarian, vegan, pescatarian, flexitarian), vegetarian and vegan are the least common. The overall US population consists overwhelmingly of meat eaters (71 percent). Nearly a quarter, 22 percent, are flexitarian.

For Gen Z, those same numbers are 65 percent and 19 percent, respectively. Interestingly, Gen Z has more vegetarians and vegans than other generations.

But then there’s this: When it comes to the daily consumption of animal proteins, Gen Z is at the top. It’s Millennials who consume the most plant-based proteins on a daily basis.

Animal proteins are still at the top across generations. However, people are consciously reducing their meat intake and seeking plant-based alternatives.

What’s Driving Meat-limiters?

In comparison to 2021, Datassential hit on a compelling finding. A mere six percent of the US population was actively reducing meat intake last year.

That number has skyrocketed in 2022. This year, per Datassential, 21 percent of consumers can be considered meat-limiters.

Given the pandemic, it makes sense to assume this dietary change is due to personal health. However, climate change is a major driver.

Overall, 55 percent of consumers feel climate change is important. That number climbs to 71 percent for meat-limiters, 69 percent of students.

Half of consumers also feel that plant-based foods, in general, are better for the planet. Nearly half (47 percent) feel these foods are also more sustainable. Again, the number increases for meat-limiters and students (and Millennials, as well).

Interestingly, two-thirds of consumers feel traditional plant-based food items are healthier than new plant-based meat alternatives. However, a little over 60 percent of consumers find both plant-based food categories healthy.

Takeaway

Before proceeding, it’s important to recognize that a survey of just 1,500 people comes with a margin of error.

Still, the results are compelling and provide insight into today’s consumer. Among the top insights:

  • Consumers are trying more plant-based menu items.
  • Climate change and sustainability are driving consumer decisions.
  • More consumers are concerned with their health.

Per Datassential, one way to appeal to a wide range of guests is offering “mixed dishes.” These are menu items that combine animal and plant proteins. Another way forward is menuing plant-forward dishes that include a small amount of meat, poultry, fish, or dairy.

If we accept that only a tiny fraction of the US population is vegetarian or vegan, targeting flexitarians and daily meat eaters in this way makes sense.

Image: Yoav Aziz on Unsplash

by David Klemt David Klemt No Comments

Stand Out with Weird Holidays: November

Stand Out with Weird Holidays: November

by David Klemt

Stay Weird neon sign with purple background

Want to stand out from from other restaurants and bars in your area? Then commit to keeping it weird.

Several “holidays” are set against every date on the calendar, and November is no exception. These holidays range from mainstream—Thanksgiving Eve and Thanksgiving, anyone?—to food-centric to weird.

Pay attention to the latter to raise eyebrows, carve out a niche for your restaurant or bar, and attract more guests. Why do what everyone else is already doing?

Of course, you shouldn’t try to celebrate every holiday, weird or otherwise. And this month’s list in no way includes every odd holiday.

Focus on the days that are authentic to your brand; resonate with your guests; and help you grab attention on social media.

For October’s list, click here.

November 1: World Vegan Day

Obviously, this holiday isn’t weird for vegans or vegetarians. There are, however, those who still find this particular diet odd. Well, this is the perfect holiday to learn more about vegan cooking and eating. Pass on that knowledge by adding delicious vegan dishes to your menu.

November 4: National Candy Day

Do you have a surplus of candy now that Halloween is over? Trying to fight the temptation to eat it all yourself? Various candies perform well as garnishes for cocktails. There’s also another way to approach this holiday, like featuring starters such as candied bacon.

November 6: National Nacho Day

So, this holiday is more fun than weird, really. However, you can probably see the potential to deviate from the standard nacho builds. Instead, ask your kitchen staff to get creative and come up with intriguing takes on nachos that will grab the attention of your guests.

November 9: National Scrapple Day

One of the best ways to cut back on food waste in restaurants, bars, and hotels is to utilize as much of a given ingredient as possible. Scrapple, of which our Philadelphia audience will no doubt be very well aware, consists of pork scraps. Guests outside of Pennsylvania may have never tried scrapple before, so this holiday is the perfect time to tempt them with a new taste sensation.

November 12: National Pizza with the Works Except Anchovies Day

It’s not this pizza that’s weird, of course. It’s the very specific pizza this holiday is celebrating. I’m guessing that you know exactly what to do to celebrate this holiday with your guests.

November 14: Pickle Day

The (in)famous Pickleback. Bloody Mary made with pickle juice. A Dill Pickle Martini. Pickle appetizers and starters. If you’ve got pickles and some degree of creativity, it’s pretty clear what needs to be done on November 14.

National 15: National Spicy Hermit Cookie Day

This is another very specific holiday. This cookie, the Spicy Hermit, features flavors that couldn’t be any more perfect for fall: cinnamon, clove, allspice, and nutmeg. You can Google a recipe, of course, but we found this one and it seems delicious.

November 17: National Take a Hike Day

We’re big fans of encouraging guests and staff to get outside. There are thousands of trails throughout the United States and Canada, ranging from the easy-peasy to the truly treacherous, so the sky’s the limit. Encourage guests to take a hike and grab a bite and drink at your establishment to rest and recover. Have them tag your spot and their meal, of course.

November 28: Red Planet Day

It seems like billionaires and millionaires can’t get enough of Mars. Over the past few years, space travel has focused almost exclusively on the idea of reaching the Red Planet and figuring out how to live on it. So, if you’ve got dishes and drinks that are predominantly red in color, put them at the forefront on November 28.

Image: Dan Parlante on Unsplash

Top