Consumer trends

by David Klemt David Klemt No Comments

af&co. x Carbonate: 2024 Trends to Watch

af&co. x Carbonate: 2024 Trends to Watch

by David Klemt

Paddle and ball on pickleball court

Marketing and creative agencies af&co. and Carbonate Group‘s 16th annual Hospitality Trends Report provides in-depth insight across several categories.

This is an in-depth, insightful report operators should review in its entirety. The “Sweet Sixteen” edition of this yearly report is available for download here.

There are two interesting details toward the end of af&co. and Carbonate’s report. First, a list of 2023 clients. Second, an explanation for the design of the report itself.

This makes sense: Carbonate is a creative agency that works in the hospitality space, after all. Further, af&co. is a hospitality industry marketing agency.

Now, I won’t be sharing every trend or insight found in these two agencies’ report. Rather, I’m highlighting a number of items across four of the report’s six categories. Again, I think operators and leadership team members should download the report for themselves.

Food

While af&co. and Carbonate identify specific cuisines and items that are trending, it’s their 10,000-foot view of food that I find most compelling. In terms of the big picture, “rigid” adherence to authentic cuisine is falling out of favor.

Chefs, in the agencies’ opinions, are taking a more modern approach to menus. Instead of following the “rules” of certain cuisines, they’re creating dishes and programs that defy labels. Of course, for those who feel the need to label, one could call this approach “contemporary fusion.”

Examples given are Good Luck Gato’s Okonomiyaki Baked Potato, and the Birria Dumplings at Little Bull.

Cuisine Trends

Of course, af& co. and Carbonate also zoom in on food. Their Cuisine of the Year goes to Korean.

Dessert of the Year goes to the Pavlova or Eton Mess. So, one can argue that operators should connect with their back-of-house teams about meringue-based desserts.

Other food trends include making pastries with buckwheat; getting inventive with mortadella; serving borek in snack and entree size; and Brazilian-style pizza.

However, it’s a presentation trend that stood out the most to me. Accompanied by a timeline complete with images, the agencies state confidently that we’re in the “Crescent Moon” era of plating.

Visualize a plate, then place all of the food along the edge, with roughly two-thirds of the space open. That’s the crescent moon presentation.

Beverage

A number of the trends in this section aren’t exactly new. That tells me that some are likely on the brink of moving from trend to ubiquity.

That, or they’re at risk of bumping against their expiration date.

Two trends that have been popping their fins out of the sea of cocktails for a bit make it into the af&co. and Carbonate report. One is clarified cocktails.

Spend a bit of time looking up cocktails on social media and you’ll see these are a bit divisive. Some bartenders are all for them, some appear to absolutely despise this trend. Guests, however, seem to like the novelty of well-known, opaque or translucent classic turning transparent.

Another drink trend? Culinary cocktails. For food-driven concepts, it makes perfect sense to encourage the bar team to work closely with the kitchen team. Offering culinary cocktails is one method of pulling a concept’s threads tighter, telling a more complete story.

Along those lines, the agencies identify another divisive cocktail trend: cheese.

Personally, cocktails that feature cheese aren’t my thing. However, these drinks are, at the minimum, going to grab a guest’s attention. And those who order these drinks aren’t likely to forget the experience any time soon, good or bad.

That last point is important for operators and their teams to remember. A negative experience can be more powerful and stick with a guest longer than a positive one. So, pursue trends with caution.

Hotel

One of the biggest hotel developments the Hospitality Trends Report identifies is the dual-brand hotel. This is also a trend with which KRG Hospitality is well acquainted, both through industry research and client projects.

So far, the most common approach tends to include two towers, a shared lobby and fitness center, and shared F&B concepts. However, there are properties that incorporate not only brand-specific design for each tower but separate the bars and restaurants as well.

Notably, Marriott opened the first-ever tri-brand hotel in Nashville in 2019. The hotel and resort colossus combined an AC Hotel, a Residence Inn, and a SpringHill Suites.

Another interesting hotel trend? Eco-friendly, pre-fab construction. An excellent example of this approach is Moliving. To learn more about this brand, check out Bar Hacks podcast episode 68 with Jordan and Hanna Bem.

Interest by consumers in supporting eco-friendly brands informs two other trends identified by af&co. and Carbonate. One of these is hotels and resorts including e-bikes among their amenities.

Another is rewarding guests for engaging in a number of green initiatives. For example, cleaning up the beach in front of a hotel, or helping to plant trees on or near the property.

Speaking further of amenities, hotel and resort operators are likely aware that if they have courts for racquet sports, they need to include pickleball.

Design

Operators considering a refresh or starting from a clean slate for a new space may want to work with a designer on the following approach: maximalism.

According to the 16th annual Hospitality Trends Report, this bold, playful design language is on the rise. Following this trend, af&co. and Carbonate think that maximalism is working particularly well for “concept-driven, design-forward” bars.

As far as colors and materials operators may want to ask designers about, the agencies suggest pink, bronze, gold, and velvet. These colors are warm and welcoming, exactly what a hospitality venue should be.

To download the Hospitality Trends Report, click here. Two categories not covered in this article are Marketing Ideas and Social Media Trends, so follow that link!

Image: Mason Tuttle on Pexels

Bar Nightclub Pub Brewery Menu Development Drinks Food

by David Klemt David Klemt No Comments

DoorDash Names 2023 Global F&B Trends

DoorDash Names 2023 Global F&B Trends

by David Klemt

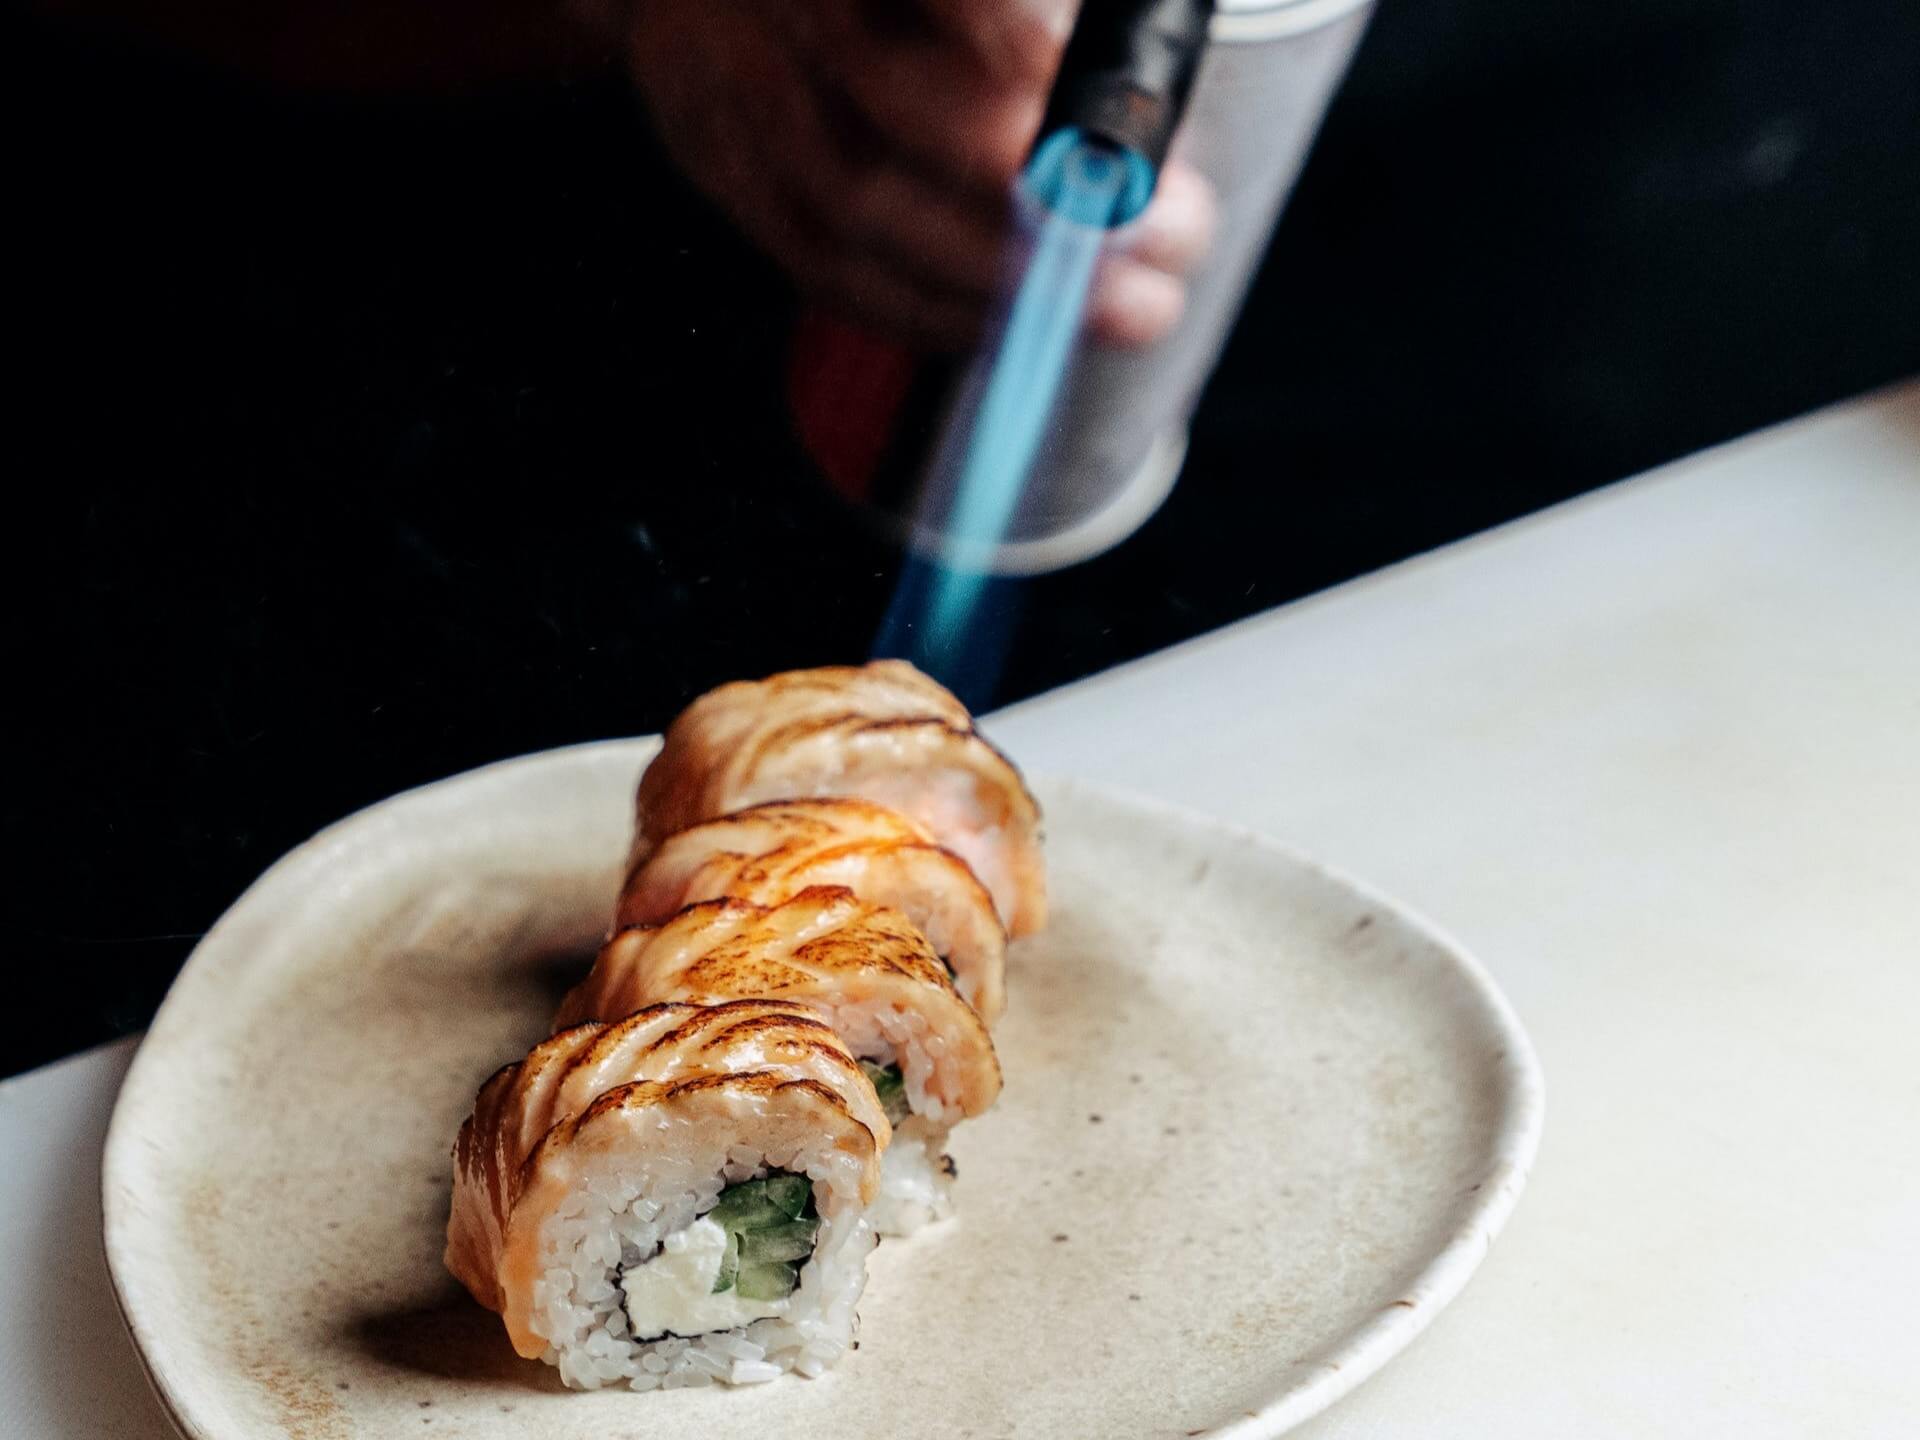
Chef torching salmon sushi

As we get close to winding down 2023 and welcoming 2024, DoorDash takes a shot at identifying the global F&B trends to watch.

This is an exciting and insightful time of year for our industry. In the last quarter, different sources start publishing their data-backed F&B predictions for the year ahead.

Take, for example, Technomic’s Global, Canadian, and American trend predictions for 2023. Oh, and don’t worry—we’ll be taking a look at their predictions for 2024 soon.

Today, however, we’re checking in on DoorDash. Admittedly, I’m not the biggest fan of third-party delivery. It’s no secret I favor direct delivery for operators.

There’s no denying, though, that third-party delivery companies have access to valuable data. From the top food and drink orders to the dayparts seeing the most delivery and pickup order growth, they can help operators see shifts in consumer behavior.

So, I’m happy to take a look at what food trends DoorDash thinks operators should watch moving forward.

Before we jump in, I’m happy that DoorDash includes this cautionary statement in their article: “Finally, always consider whether or not a trend actually fits in at your restaurant.”

At KRG Hospitality, we couldn’t agree more. Jumping on every trend, as tempting as that may be, is unwise and can do harm than good. So, while the lists below identify trends that are gaining traction currently, operators need to be discerning.

Food Trends

Let’s start with a trend multiple sources identified toward the end of 2022 that appears to still be on an upward trajectory: pickles.

Seriously, it seems that people can’t get enough pickles. Pickle pizza appears to the current darling when it comes to this food trend. Speaking of pizza, DoorDash sees square pizzas as a trend to watch.

Another trend that multiple sources have been keeping tabs on is chimichurri. According to DoorDash, this condiment is finding its way onto all manner of food item.

Other food trends that operators should be aware of are bowls (deconstruct a sandwich, burrito, etc., and you have a bowl); oyster mushrooms subbing in for meat; higher-end tinned fish; and gluten-free menu options.

To be honest, I don’t think that last one is just a trend. At this point, offering gluten-free options or entire menus is mainstream.

Now, there are two more food trends I want to address separately. One, smaller menus. This is a trend I believe most operators can and should get behind. Shrinking a menu can result in lower food and labor costs, and a happier team. Making a menu smaller can also make a restaurant more nimble and engaging as LTOs may have more impact.

And then there’s aburi sushi, which is presented after the top of the fish is torched. This gives sushi a smoky flavor and brings in a different texture element.

To be fair, I’ve expected this to take off for the past several years. Now, it appears it’s taking hold and moving from fad to trend.

TikTok Trends

Yes, we have to talk about TikTok. There’s no question that the platform is a trend-producing powerhouse.

Clearly, TikTok has an influence on food trends. If you want to know what your younger guests want to try, check TikTok. The same goes for your guests who are highly engaged with social media influencers.

Below, the trends DoorDash sees taking hold.

  • Chopped sandwiches. Do you have sandwiches on your menu? Can your guests watch as your team makes them? You may want to create a chopped version of your signature or best-selling sandwich.
  • Pasta salad summer. Apparently, this summer was the Summer of Pasta Salad. Specifically, pasta salads made with fresh ingredients, and made without ingredients like mayonnaise.
  • Cottage cheese. According to DoorDash, TikTokers are putting cottage cheese in scrambled eggs, adding it to pasta sauce, and using it to make cheese toasts. I’ve personally tried the TikTok trend of using cottage cheese to make nacho cheese sauce.

One word of caution: TikTok trends come and go in the blink of an eye. So, operators need to hop on trends that work with their restaurant or bar before they’re already out of favor. It’s a daunting task.

To review this DoorDash report in its entirety, including beverage and grocery trends, follow this link.

Image: Ivan Samkov on Pexels

Bar Nightclub Pub Brewery Menu Development Drinks Food

by David Klemt David Klemt No Comments

2023 DoorDash Ordering Trends

2023 DoorDash Ordering Trends: Canada & US

by David Klemt

Canada and the United States of America on a globe

After checking out this year’s annual Cravings Report we’re turning our attention to the 2023 DoorDash restaurant ordering trends reports.

Luckily, there are two reports available from DoorDash: one that focuses on Canada, and one for the US.

These two countries are, of course, KRG Hospitality’s primary markets. So, the data in these DoorDash reports is relevant and compelling for our current and future clients.

Perhaps unsurprisingly, Canadian and American DoorDash users are somewhat similar by a few metrics. However, where there are differences they’re fairly glaring.

For example, 78 percent of Canadian DoorDash survey respondents picked up a takeout order from a restaurant in the month prior to being surveyed. That number is 76 percent for American survey respondents.

Regarding in-person restaurant dining, 62 percent of respondents had done so the month prior. Among American survey respondents that number is 61 percent.

But when it comes to placing an order for delivery we see a notable difference. For Canada, 58 percent of survey respondents had ordered delivery. That number jumps to 77 percent among Americans.

This tells me a few (fairly obvious) things. Generally speaking, it appears consumers in Canada and America—according to DoorDash—prefer delivery and takeout to in-person dining. Going further, it seems that overall, Canadians prefer pickup or takeout to delivery. However, Americans seem to place delivery and pickup orders at nearly identical rates.

If it’s true that consumers favor delivery or takeout to in-person dining currently, there could be a couple of simple reasons. First, convenience.

Second, fees. It’s possible that today’s consumer perceives delivery fees are lower than in-person dining fees, unfortunately. If that’s the case, third-party delivery services can exploit this perception.

More Similar than Different

In comparing both DoorDash reports, I find that Canadian and American consumers who use DoorDash are rather similar.

Survey respondents in both countries indicate that Friday is the most popular day of the week to order food. Further, 6:00 PM is the most common local time to place orders in both countries.

And when it comes to the fastest-growing dayparts for order placement? In both Canada and the US it’s late-night and breakfast. Although, I most note that both dayparts are growing faster in Canada.

Nearly half of American respondents and a little over half of Canadian respondents indicate they want to try new restaurants and dishes.

Definitely not surprisingly, consumers in both countries primarily focus on menu selection and pricing when seeking a new restaurant to try. In fact, these numbers are identical for Canadians and Americans, at 55 percent and 51 percent, respectively.

Top Canadian Food Orders

When we look at the top items ordered via DoorDash, we don’t find anything out of the ordinary.

  1. Burgers
  2. Fries
  3. Pizza
  4. Salad
  5. Sandwiches

Looks like standard fare and comfort foods to me. This tells me that operators who have these items on their menus need to ensure they’re of the highest quality to stand out from other restaurants and bars.

Top American Food Orders

Interestingly but not too surprisingly, the list below is quite similar to the list above.

  1. French fries
  2. Burgers
  3. Tacos
  4. Salad
  5. Pizza

With the exception of tacos and sandwiches, the list is nearly identical.

Hey, who wants to debate whether tacos and sandwiches are in the same food family?

I encourage you to review both reports in their entirety for yourself. For the Canadian Edition of DoorDash’s report, click here. And click here for the US edition.

Image: Lara Jameson on Pexels

Bar Pub Brewery Nightclub Club Nightlife Technology Plan Tech Stack

by David Klemt David Klemt No Comments

2023 Cravings Report: “The Most” Orders

2023 Uber Eats Cravings Report: “The Most…” Orders

by David Klemt

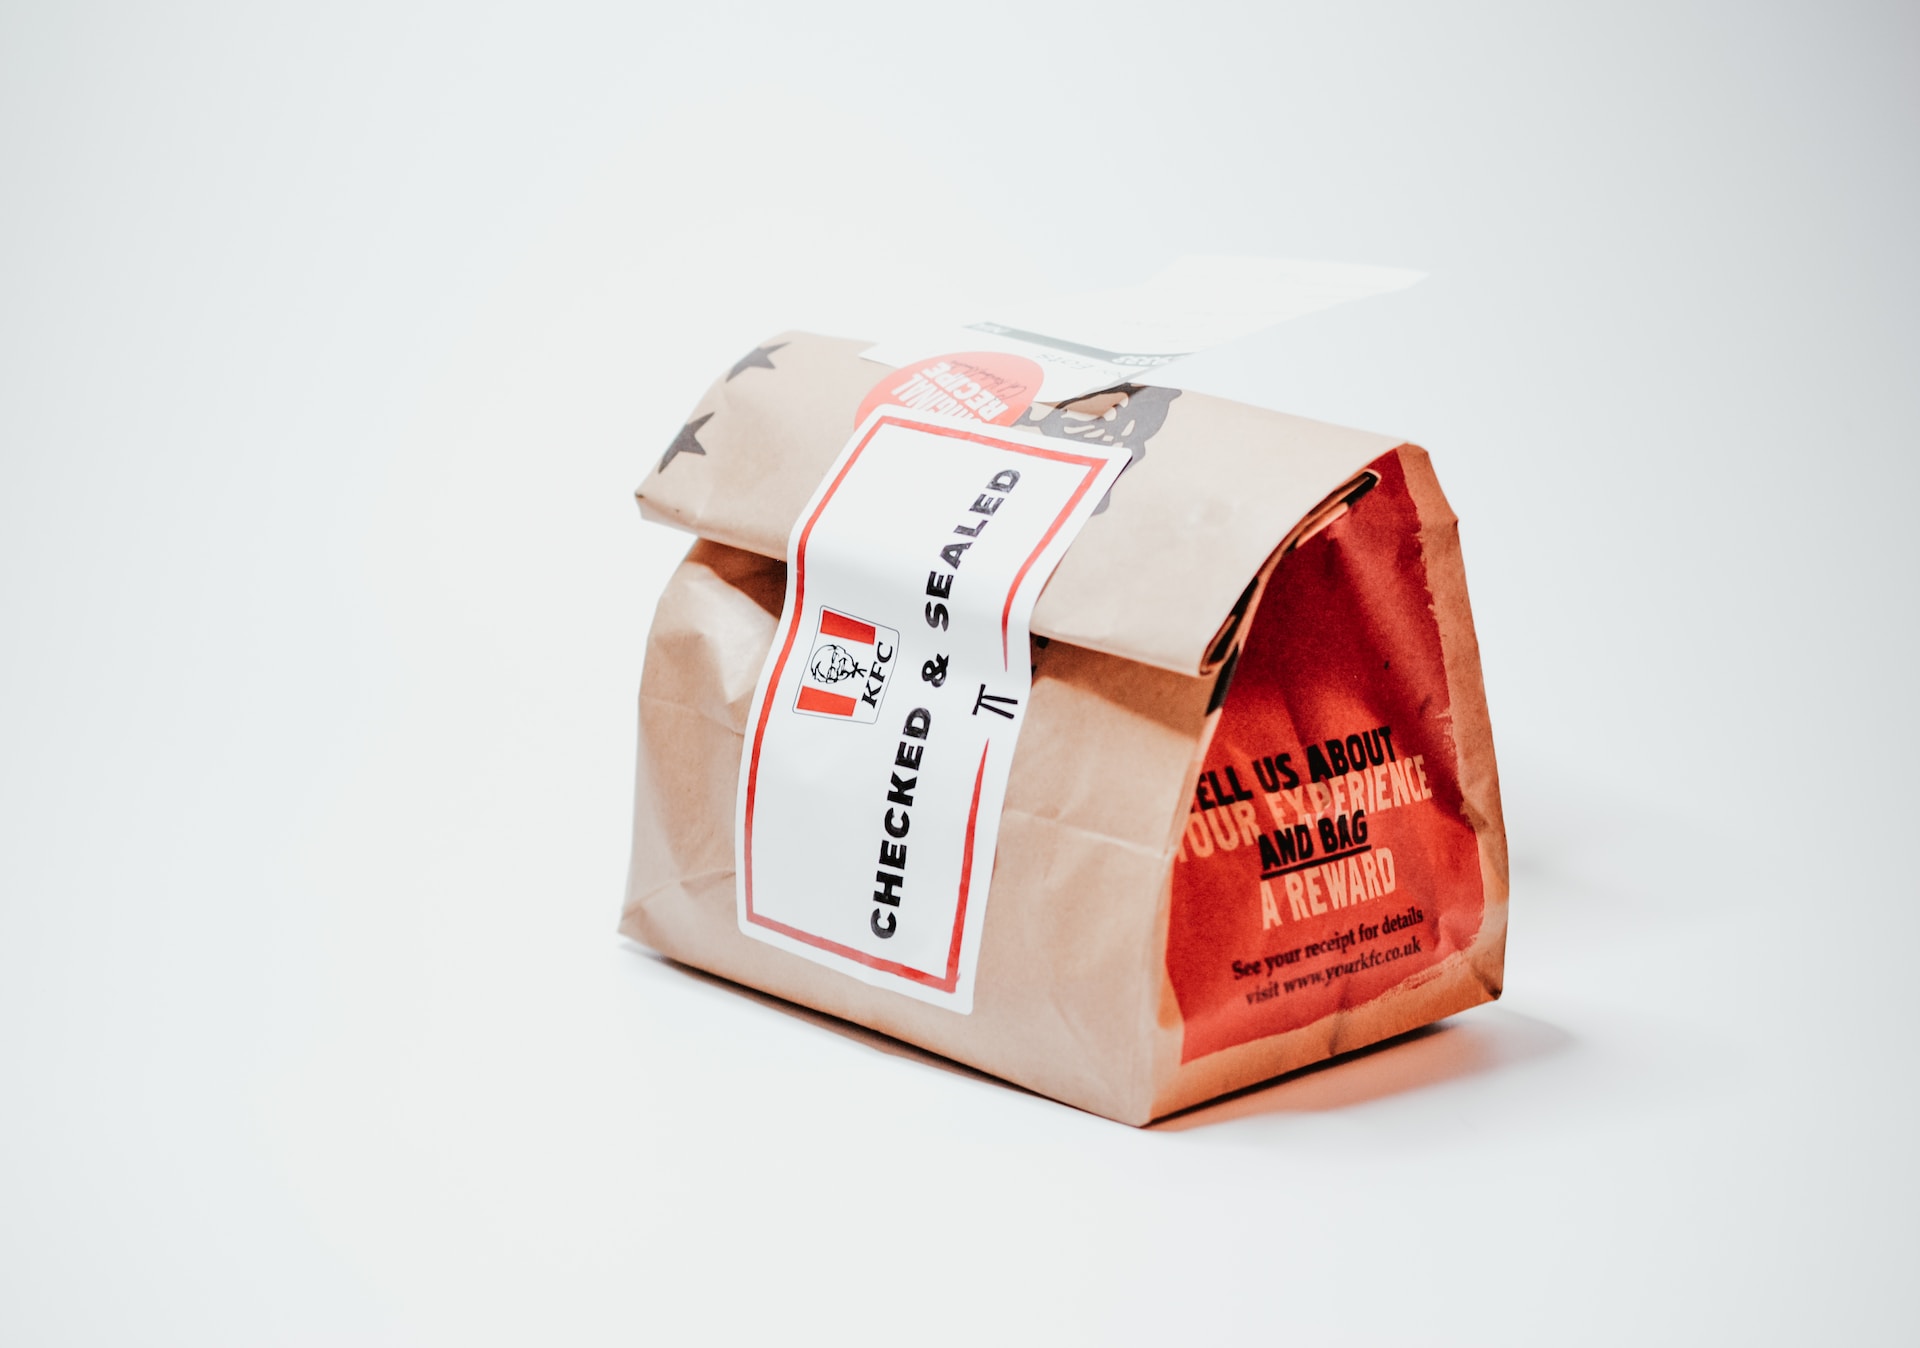
Kentucky Fried Chicken packaged for delivery or pickup

Let’s take a look at the top orders, delivery requests, order combinations, surprising pairings, and more from the 2023 Uber Eats Cravings Report.

It appears that the chicken sandwich dominance we’ve seen over the years is winding down. At least, that seems to be the case among Uber Eats users.

As you’ll see below, not only is the chicken sandwich not the most popular item, it’s not even among the top five. It does edge out the cheeseburger and wings among the most popular combos, but it doesn’t outperform French fries and salt as a combo.

Another eyebrow-raising detail? Pizza doesn’t show up anywhere among the most ordered items, most popular combos, or even the most surprising combos.

Now, if you’re curious about the 2022 Uber Eats Cravings Report, you’re in luck. You can click here for the top food orders from that report, and here for the top beverage orders.

The Most…Ordered Items

  • French fries
  • Garlic naan
  • Pad Thai
  • Miso soup
  • California roll

Am I the only one who expected to see burgers, chicken sandwiches, and pizza on this list?

The Most…Popular Combos

  1. Burrito bowl + cheese
  2. French fries + salt
  3. Chicken sandwich + shredded lettuce
  4. Cheeseburger + mustard
  5. Wings + ranch

Fairly standard, really. Every one of these orders makes complete sense. Now, the category coming up next…it’s a different story.

However, before we move on, let’s compare these items to those found on the 2022 Uber Eats Cravings Report.

Interestingly, the number-one item is nearly identical: burrito + cheese. And French fries + salt is the second most-popular item on both lists.

The Most…Surprising Combos

  1. Steak + jelly
  2. Cottage cheese + mustard
  3. Condensed milk + avocado
  4. Seaweed + pasta sauce
  5. Butter + pickled onions

I really have nothing to say after reviewing this short list. I mean…hey, do your thing, everyone. Make your order yours.

To the operators out there, be ready for some odd order combos.

The Most…Popular Requests

  1. No onions
  2. Dressing on the side
  3. Ranch
  4. Extra soy sauce
  5. Spicy
  6. Sauce on the side
  7. No lettuce
  8. No jalapenos
  9. Extra gravy
  10. No slaw

Looking at the top request, Uber Eats has a theory as to what’s driving it: the return to the office.

People, it appears, are self-conscious about their breath in an in-person, face-to-face setting.

The Most…Popular Food and Alcohol Combos

  1. Ribeye + Vodka
  2. Cheeseburger + Frozen Margarita
  3. Chicken + Frozen Piña Colada
  4. Lobster tail + Apple whiskey
  5. Tamales + Daiquiris

Last year’s report reveals the following combos:

  1. Steak + Margaritas
  2. Pizza + White Claw
  3. Burritos + Margaritas
  4. Chicken + Sangria
  5. Wings + Beer

Overall, a lot of change from the 2022 Cravings Report to this year’s report.

Image: Nik on Unsplash

Bar Nightclub Pub Brewery Menu Development Drinks Food

by David Klemt David Klemt No Comments

Top-performing Menu Items in the US

Top-performing Menu Items in the US (So Far)

by David Klemt

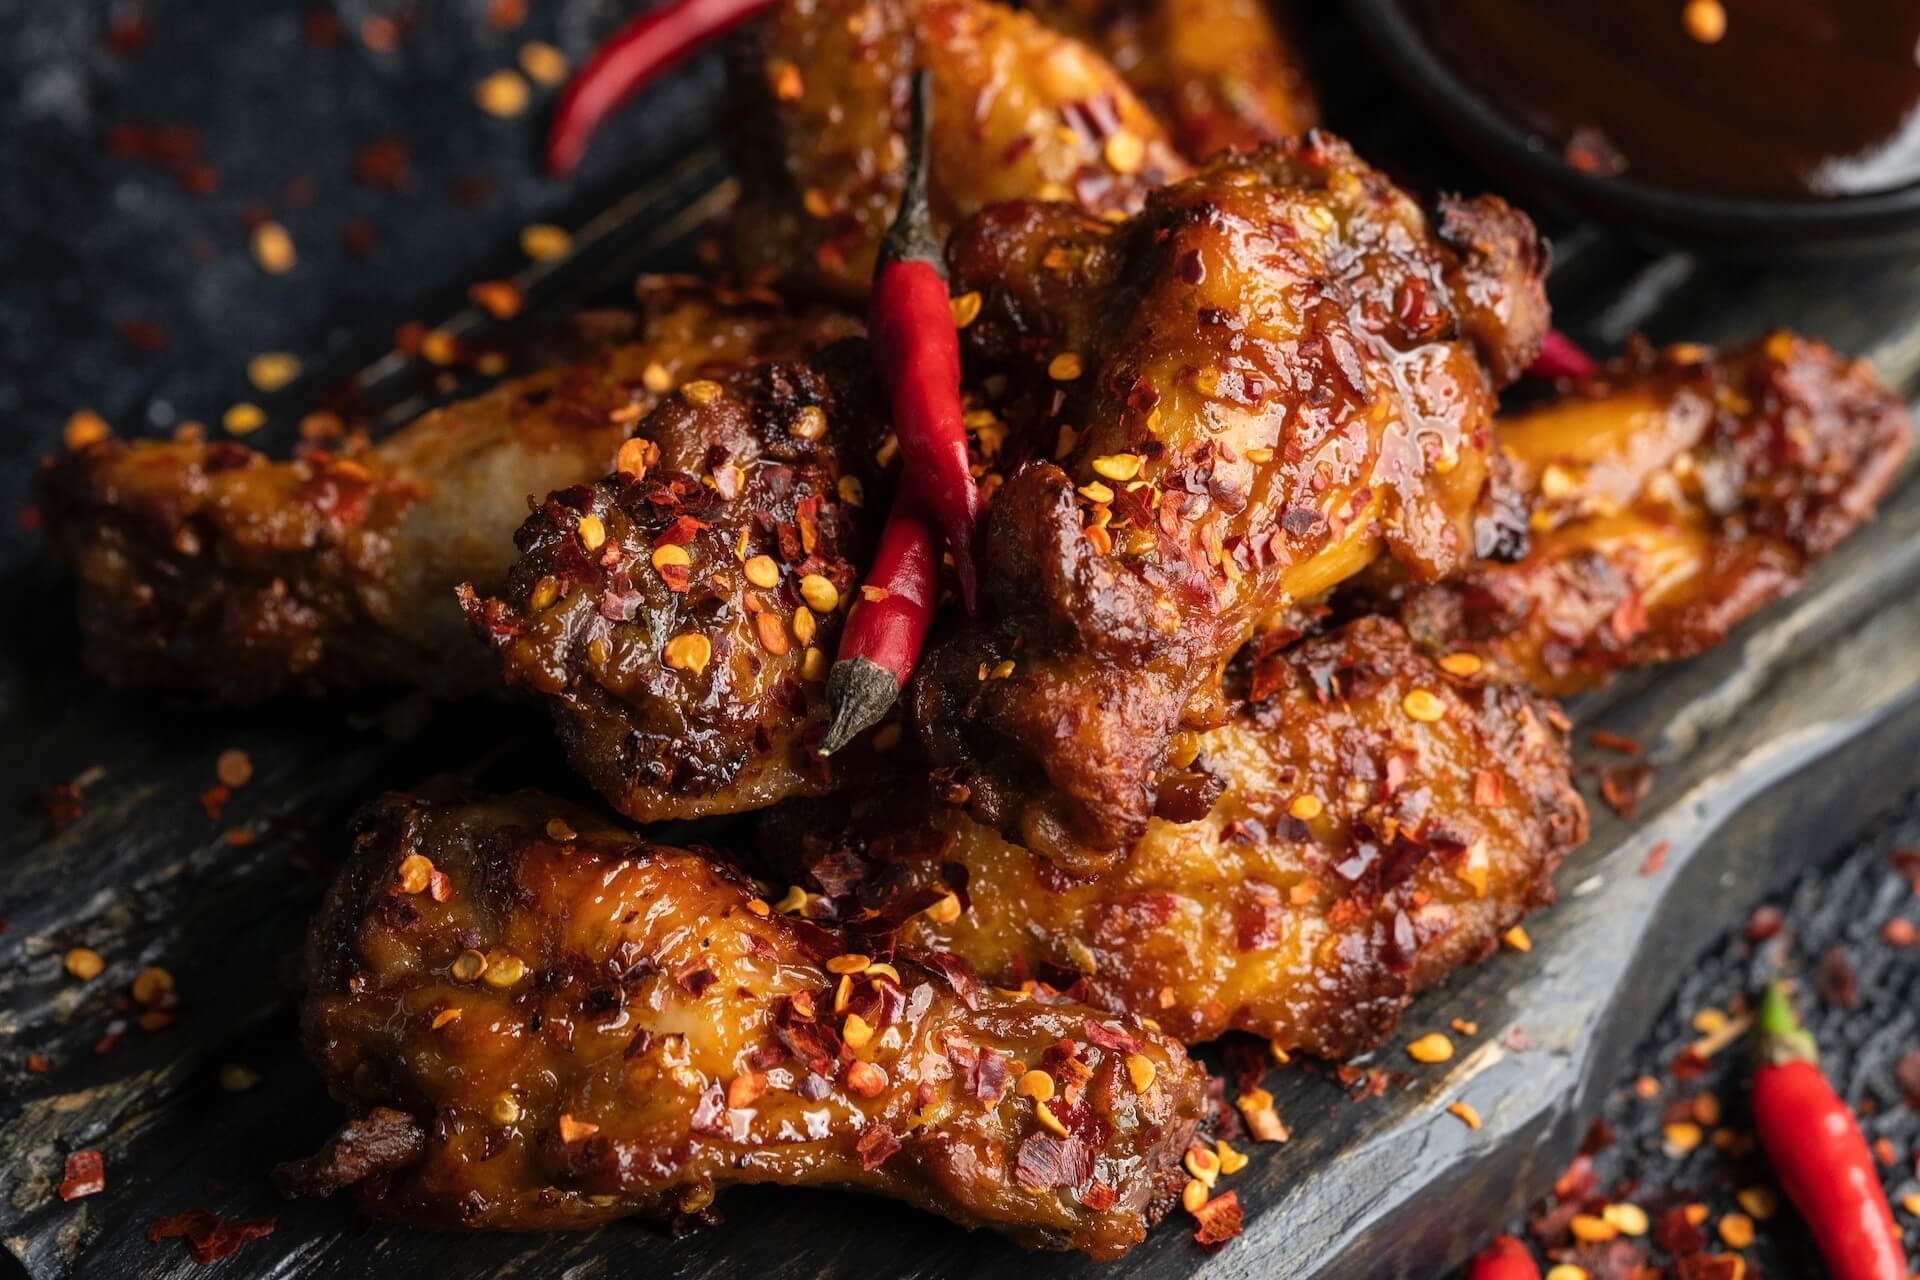
Barbecue chicken wings, chili peppers, and chili flakes

Thanks to a recent mid-year report from F&B intelligence platform Datassential, we now know the top-performing menu items in the US.

For the low, low price of filling out a handful of fields, you can download a copy of Datassential’s “Foodbytes: 2023 Midyear Trend Report” for yourself.

There’s plenty of useful data packed into this short report. You may find some of the top food items a bit surprising.

But First…

Datassential does more than just list the top mid-year menu performers in their latest report. There are also a couple of interesting datapoints for operators to consider.

The first piece of information is an alarming statistic: 54 percent of consumers are of the belief that “tipping culture has gotten out of control.”

As we’ve reported earlier, it’s likely that a major driver of “tip fatigue” comes from retail. The expectation for consumers to tip at a restaurant, bar or nightclub is ingrained deeply in American culture.

However, consumers throughout America are being prompted to tip after just about every transaction they’re attempting to complete. In fact, it’s not just retail that has been encouraging (in some cases, guilting) people to tip. Some contractors are also adding tip lines when handing over tablets to clients so they can pay their invoices.

One result is that servers and bartenders are reporting lower tips; guests are so over tipping that they’re pushing back against the practice in venues where they’d traditionally have no problem doing so.

Of course, tip fatigue isn’t the only reason consumers are pushing back against tipping. Many people feel that operators should increase what they pay staff. Indeed, some people feel that operators are asking them to subsidize their employee pay. Whether they’d be happy to pay higher prices remains to be seen.

Fads Aren’t Bad?

Whenever we cover trends or discuss them with clients, we caution against chasing too many (or the “wrong” trends). And fads? It can be even riskier to hop on the bandwagon of something that may never even reach the trend stage of its lifecycle.

However, likely due to the ubiquity of TikTok, consumers expect restaurants to embrace fads. According to Datassential, 67 percent of consumers overall “want to see more fads at restaurants and retail.”

That number jumps to 74 percent when focusing on Millennials and Gen Z.

So, while we still caution operators about jumping on fads (or “micro trends”) and trends, that doesn’t mean be too cautious. If a fad or trend works with your brand and won’t cost much to feature, at least give it consideration.

Not sure you’re great at identifying fads that will work for your business? Ask your staff which fads and trends are hot at the moment.

Speaking of Hot…

Alright, let’s take a look at the F&B items Datassential identifies as popular at the midway point of 2023.

Again, I encourage you to download the report in its entirety. You can do just that by clicking here.

But for those who want instant gratification, check out these menu items:

  • Super Duper: Let’s kick things off with the hottest chain LTO, the Denny’s Super Slam. Per Datassential, restaurant chains have already featured in excess of 2,000 LTOs in 2023. The F&B intel agency tests them all, and the Super Slam is wearing the LTO crown at the moment.
  • Chef Chatbot: Datassential tapped ChatGPT to create a burger recipe and had Midjourney create an image for the resulting Caprese Avocado Burger. More than half of consumers surveyed—57 percent—want to try it at a restaurant.
  • Big Winner: Datassential asked consumers a simple question: Which would you rather eat for the rest of your life, a hamburger or a hot dog? A staggering 87 percent chose hamburgers, meaning just 13 percent of consumers would choose a hot dog over it’s burger buddy.
  • What a Pickle: Back in March we checked out Slice’s Slice of the Union report, and it predicted pickle pizzas would be a hot trend this year. Well, Datassential has crunched the numbers and says 40 percent of consumers are aware of this pizza style already. Looks like Slice may be proven right by the end of the year.
  • Speed Demon: Curious about the fastest-growing menu item on the US? Well, wonder no more: Datassential says it’s the barbecue chicken wing. Over the past year, they’ve grown 373 percent on menus across the States. Datassential posits the overall growth of chicken and the embracing of flavor trends like Carolina gold barbecue sauce are contributing factors.

There’s a lot to unpack here, so I’ll leave you to it. Just remember that when it comes to fads and trends, there’s a fine line between what’s hot, what’s not, and jumping on the wrong one. Good luck!

Image: Ahmed Bhutta on Pexels

KRG Hospitality Start-Up Restaurant Bar Hotel Consulting Consultant Solutions Plans Services

by David Klemt David Klemt No Comments

American Trends 2023: Technomic

American Trends 2023: Technomic

by David Klemt

Pink pineapple against pink background

Foodservice research firm Technomic has some interesting predictions for the hospitality industry in the United States of America this year.

On the topic of operations, Technomic foresees more negotiating power among workers. Additionally, the firm looks at both the economy and pent-up guest demand.

When it comes to food, the US and Canada have a trend prediction in common. And as the image atop this article signifies, a particular color may be a hit on menus in 2023.

Before we jump in, Technomic’s 2023 Canadian trend predictions are here. Last year’s Technomic predictions for America are here. Curious readers can review the firm’s 2023 predictions in their entirety here.

Okay, let’s go!

Think Pink

I want to address this prediction first. According to Technomic, pink is going to be the F&B color of 2023.

As they explain, the color is fun, nostalgic, and photogenic. Yes, operators must still consider the Instagram-worthiness of their menu items. That may change one day, but it’s not today.

Per Technomic, pink also signals that a food or drink may have antioxidants.

Some of the items the research firm names specifically: pink pineapple, pink salt, pink celery, cara cara oranges, and schisandra berries.

Pickle It

This is the culinary trend that, per Technomic, Canada and America will share in 2023.

Along with fermenting, pickling gives the kitchen and bar teams a unique experimentation method to explore. So, encourage these teams to get creative and add pickling and fermentation to your next menu update.

Of course, that’s not the only reason to consider putting pickling front and center. For many, these preparations indicate a healthy F&B choice. Think kombucha, as an example.

As we know, healthy choices continue to be top of mind for many guests.

One more note: Technomic suggests being transparent and identifying the pickling and fermenting processes your team leverages to produce each menu item.

Economics

For those looking for a bit of optimism in these trying times, Technomic may have what you’re looking for. This year’s report, What We Foresee for 2023, says the following about the possibility of a recession:

“There is reason for optimism in the coming year, however, as any recession is expected to be relatively mild.”

Yes, that’s just one source’s opinion. However, Technomic is known for their voraciousness when it comes to data. So, if this firm is optimistic it could be a solid sign that things are looking up in 2023.

“Pent-up consumer demand” and variations thereof have been making the rounds since 2o21. However, it’s still a relevant phrase.

As it pertains to 2023, Technomic believes on-premise dining may “bounce back” this year. In fact, the firm suggests that people want to socialize and dine in person now more than ever.

Also, delivery and pickup times appear to be growing. So, plenty of people will see in-person dining as the more appealing option in 2023.

Operations

In part due to legislation addressing minimum wage and workplace conditions, employees may have the upper hand this year.

Add the fact that many people seeking work know many operators are dealing with a labor shortage and their negotiating position looks even stronger.

So, we could finally be in for a significant change when it comes to how the industry looks at compensation. More and more workers—and the guests they serve—are taking issue with tipping. Instead, many people outside and inside of the industry want to see operators pay staff a competitive, living wage.

Of course, there are also the hospitality professionals who prefer tips to minimum wage. In 2023, the industry could experience the start of a sea change. Time will tell.

For more predictions and this Technomic report in its entirety, please click here.

Image: Alex Gruber on Unsplash

by David Klemt David Klemt No Comments

Canada’s Top 2022 DoorDash Orders

Canada’s Top 2022 DoorDash Orders

by David Klemt

Burgers, French fries and milkshakes

Operators curious about the most popular delivery items in 2022 will be happy to learn that DoorDash’s year-end report is ready for viewing.

Those who want to compare it to predictions from several sources earlier this year can click here. The DoorDash Canada report can also be compared to consumer trends in Canada revealed back in October.

Before we jump in, I’m not detailing the DoorDash report in its entirety here. To review the entire report, please click here.

Instead, I’ll be sharing the top takeaways in terms of top menu items; top cuisines; and top items by province.

Speaking of provinces, a word to New Brunswick, Newfoundland and Labrador, Northwest Territories, Nova Scotia, Nunavut, Prince Edward Island, and the Yukon. Please don’t break out the pitchforks and come for me for not including you in this article. DoorDash’s report only covers data from six provinces—I didn’t leave you out intentionally.

Top DoorDash Cuisines in Canada

  1. American
  2. Mexican
  3. Japanese
  4. Thai
  5. Mediterranean
  6. Indian
  7. Chinese
  8. Italian
  9. Korean
  10. Filipino

Top DoorDash Items in Canada

  1. Burgers & Fries
  2. Fried Chicken
  3. Poutine
  4. Sushi Rolls
  5. Chicken Wings
  6. Burritos
  7. Chicken Rice Bowl
  8. Shawarma Wraps
  9. Curry
  10. Pad Thai

I think there’s one key takeaway that stands out in regards to this list. Notably, it appears that while chicken isn’t number one, it’s undeniably popular amongst Canadian DoorDash users.

In fact, according to DoorDash data, chicken reigns supreme in British Columbia. When you reach the province-specific sections below, you’ll see how powerful the cravings in BC are for chicken.

Top DoorDash Late-night Items

Again, chicken rules the DoorDash roost in this category.

  1. Chicken Nuggets
  2. Fries
  3. Poutine
  4. Chicken Wings
  5. Chicken Burgers
  6. Apple Pie
  7. Cheeseburger
  8. Spinach & Cheese Dip
  9. Chocolate Fudge Sundae
  10. Crispy Chicken

Top DoorDash Items: British Columbia

  1. Burrito Bowl
  2. Szechuan Chicken Lettuce Wraps
  3. Butter Chicken
  4. California Roll
  5. Crispy Chicken Sandwich
  6. Tofu Bowl
  7. Chocolate Chip Cookies

Top DoorDash Items: Ontario

  1. Cheeseburger
  2. Coffee
  3. Burrito Bowls
  4. Chicken Shawarma
  5. Crispy Chicken
  6. Bagels
  7. Pad Thai
  8. Beef Patty
  9. Pizza
  10. Onion Rings

Top DoorDash Items:Alberta

  1. Spinach and Cheese Dip
  2. Chicken Cheddar Sandwich
  3. Chilli Chicken
  4. Kale Salad
  5. Margarita Pizza
  6. Hot Apple Turnover

Top DoorDash Items: Québec

  1. Poutine
  2. Cappuccino
  3. Pad Thai
  4. Steak and Cheese
  5. Croissant
  6. Dumplings
  7. Chips
  8. Tacos

Top DoorDash Items: Saskatchewan

Interestingly, a beverage item holds the top spot in Saskatchewan.

  1. Bubble Tea
  2. Pepperoni Pizza
  3. Pork Bun
  4. Crispy Pork
  5. Garlic Bread
  6. Pasta

Top DoorDash Items: Manitoba

  1. Fries
  2. Butter Chicken
  3. Red Velvet Cake
  4. Poke Bowl
  5. Shawarma Wrap

As I stated in Wednesday’s article detailing Grubhub and Uber Eats’ reports for the US, we believe operators should take as much control over their restaurants and bars as possible. At KRG Hospitality, that means implementing direct delivery if it makes sense: ease of use, delivery capabilities, favorable costs, etc.

It’s also helpful to know what consumers in your area are craving and ordering. Such information can provide a useful baseline for many concepts’ menu development.

Image: John Fornander on Unsplash

by David Klemt David Klemt No Comments

Menus in Canada: Who Wants What Items?

Menus in Canada: Who Wants What Items?

by David Klemt

Bar and restaurant food and drink menus

Nobody has a crystal ball telling them what they should put on their menus to boost traffic and revenue, but we do have data.

In this instance, we have useful data regarding Canadian consumers specifically. Not only do we have helpful information from Restaurants Canada, David Henkes from Technomic has also weighed in. For those who are unfamiliar, Technomic is one of the best foodservice research and consulting firms.

Before we dive into Restaurant Canada’s menu trend information, this is not a review of the top menu item orders in Canada. For a deep dive into that topic in particular, please read our article “F&B in Canada: Top Menu Items.”

Instead, in this article we’re reviewing broader menu categories and interest in them among Canadian consumers. For your own copy of the 2022 Foodservice Facts report, click here.

Word of Warning

Now, it’s important to bear in mind that the data below is a snapshot. It’s important, informative data but it shouldn’t influence your menu completely.

In other words, when considering revising your menu in any way, make sure you’re staying true to your brand and the community you serve. If your data differs from Restaurants Canada and Technomic data, that’s okay.

Not only are there always outliers, not all data applies to every concept. So, don’t take drastic action on your menus based solely on the data below.

For this particular topic, Restaurants Canada asked three age groups about their interest in eight menu categories.

The groups are: 18 to 34, 35 to 54, and 55-plus. The industry advocacy group then reviewed the numbers for those who indicated they’re “very interested” or “somewhat interested” for each category or item.

Who Wants What?

The menu category generating the most interest from Canadian consumers, according to Restaurants Canada data, is food sourced from local farmers. Overall, 93 percent of survey respondents very or somewhat interested. Those in the 55-plus age group are the most interested.

More than 80 percent are interested in comfort foods, or creative riffs on comfort foods. Age groups 18 to 34 and 35 to 54 have the most interest. Precisely 80 percent are interested in trying globally inspired foods and flavors, led by the 18 to 34 age group.

Foods that promote health and wellness come next, with 79 percent of Canadian consumers showing interest. The 55-plus age group is particularly interested. However, dishes that utilize ingredients that boost one’s immune system are only popular among 53 percent of survey respondents. Interestingly, it’s the 18 to 34 age group with the most interest in this category.

In what’s possibly a contrast from American consumers, the final three categories have no more than 41 percent of survey respondents’ interest. Forty-one percent have interest in meatless and vegetarian items. Next, just 38 percent show interest in alcohol-free cocktails. Finally, just 33 percent are interested in plant-based burgers and sausages.

For each of those categories, the greatest interest comes from the 18 to 34 age group, and the 55-plus group shows the least amount of interest.

Recommended Reading

We’ve been reviewing the 2022 Foodservice Facts report from Restaurants Canada in depth for several weeks. To learn more about this important report, please read the following:

Image: Samuel Regan-Asante on Unsplash

by David Klemt David Klemt No Comments

F&B in Canada: Top Menu Items

F&B in Canada: Top Menu Items

by David Klemt

Closeup of hands holding burger

Those wondering what food and beverage menu items are performing best among consumers throughout Canada need wonder no more.

And why is that? Well, Restaurants Canada has the answers, revealing the top ten food and top ten beverage items.

Further, the organization compares each item’s performance. In this instance, Restaurants Canada analyses the percentage of orders that contained each food or beverage item from January to April 2022 in comparison to 2019.

These insights (and many more) are available in Restaurants Canada’s 2022 Foodservice Facts report. In fact, you can find our reviews of several of the restaurant advocacy group’s report topics via the links below:

For your own copy of this year’s Foodservice Facts report, click here.

Top 10 Canadian Drink Menu Trends

As you’ll see below, coffee is outperforming nearly every other beverage category. Specifically, Hot coffee is at the top, while Iced or frozen coffee is ranked third.

Unsurprisingly, Carbonated soft drinks / Pop / Soda split the two coffee categories. According to Restaurants Canada, the Carbonated soft drink category can credit its performance in large part to QSRs.

  1. Milk: 1.8% (2019) to 1.8% (2022)
  2. Iced tea: 2.9% (2019) to 1.6% (2022)
  3. Milkshakes / Smoothies: 2.1% (2019) to 2.0% (2022)
  4. Fruit juice: 3.8% (2019) to 3.0% (2022)
  5. Hot tea: 5.5% (2019) to 4.5% (2022)
  6. Alcohol beverages: 5.1% (2019) to 5.7% (2022)
  7. Water: 6.6% (2019) to 5.0% (2022)
  8. Iced or frozen coffee: 5.3% (2019) to 7.5% (2022)
  9. Carbonated soft drinks / Pop / Soda: 19.7% (2019) to 20.2% (2022)
  10. Hot coffee: 40.9% (2019) to 41.9% (2022)

Compellingly, Alcohol beverage performance in restaurants fluctuated by age group between 2021 and 2022. Alcohol order shares in restaurants, per Restaurants Canada:

  • Legal drinking Age (LDA) to 34: 46% (2021) to 43% (2022)
  • 35 to 49: 17% (2021) to 21% (2022)
  • 50-plus: 37% (2021) to 36% (2022)

Alcohol order shares in bars, according to Restaurants Canada:

  • LDA to 34: 35% (2021) to 35% (2022)
  • 35 to 49: 17% (2021) to 19% (2022)
  • 50-plus: 49% (2021) to 47% (2022)

Overall, the 35 to 49 age group appears to be consuming less alcohol in bars and restaurants in comparison to the LDA to 34 and 50-plus cohorts.

Top 10 Canadian Food Menu Trends

As Restaurants Canada notes, the Sandwich / Sub category has grown in 2022. Interestingly, the category just below it in growth, Chicken, is partially responsible for boosting Sandwich / Sub performance.

As far as entrees or “main attractions,” the Burger category remains at the top, beating out Breakfast, Sandwich / Sub, Chicken, and Pizza menu items.

  1. Cake / Squares / Muffins: 3.7% (2019) to 3.3% (2022)
  2. Salad: 4.3% (2019) to 3.8% (2022)
  3. Donuts / Beignets: 3.0% (2019) to 3.8% (2022)
  4. Breads: 4.3% (2019) to 3.4% (2022)
  5. Pizza / Panzerotti / Calzone: 4.1% (2019) to 4.3% (2022)
  6. Chicken: 7.6% (2019) to 8.5% (2022)
  7. Sandwich / Sub: 8.0% (2019) to 8.5% (2022)
  8. Breakfast: 10.8% (2019) to 11.4% (2022)
  9. Burger: 9.0% (2019) to 10.9% (2022)
  10. French fries / Potato / Sweet potato / Onion rings: 15.0% (2019) to 16.1% (2022)

Image: Nathan Dumlao on Unsplash

by David Klemt David Klemt No Comments

The Numbers on Food Delivery in Canada

The Numbers on Food Delivery in Canada

by David Klemt

Burger in container inside car

For most restaurants, delivery is now a crucial service element rather than a “nice-to-have” option a small percentage of guests expect.

This is true whether your restaurant is in the US or Canada. But who’s placing orders? How are they ordering? And will they continue to order for the foreseeable future?

Well, Restaurants Canada has answers to all those questions and more. So, we let’s take a look at what their 2022 Foodservice Facts report says about delivery.

To download your own copy of this informative report, click here.

Who’s Placing Orders?

In their 2022 Foodservice Facts report, Restaurants Canada looks at three age groups:

  • 18 to 34
  • 35 to 54
  • 55-plus

Perhaps unsurprisingly, the 18- to 34-year-old cohort leads the charge when it comes to ordering delivery. It’s also not surprising that 35 to 54 comes in second, and 55 and older is third.

However, the first two groups are closer than some may assume. Eighty-three percent of the the 18 to 34 cohort placed orders at quick-service or full-service restaurants between December 2021 and May 2022.

That number does drop for the same time period among the 35 to 54 group, but not by a significant amount. Of that cohort, 77 percent ordered delivery. Just over half of the 55-plus group placed delivery orders: 52 percent.

Now, those numbers are down a bit from 2021, which makes sense. Things were much more restrictive in 2021 and people were just getting back to a sense of normalcy at the start of this year.

In 2021, the delivery order percentages were:

  • 18 to 34: 89 percent
  • 35 to 54: 81 percent
  • 55-plus: 67 percent

Looking at these numbers, it appears the 55-plus cohort is more comfortable dining out in person. Conversely, the 18 to 34 age group is clearly comfortable making delivery a part of their everyday lives.

How do People Want to Order?

Believe it or not, your website still matters. I’ve been saying this for years but the pervasiveness of delivery and takeout ordering is really driving this point home.

The fact is, a notable percentage of your guests want to support your restaurant and staff directly. Over the past couple of years, consumers have become well aware that third-party delivery services are incredibly costly for operators.

Consumers are also aware of third-party delivery debacles, such as the abysmal Grubhub “Free Lunch” mess from May of this year.

So, direct delivery is something that operators need to at least consider. Implementation is often less difficult than most business owners believe. And many platforms, SevenRooms, for example, make implementing direct delivery simple and affordable.

Interestingly, Restaurants Canada data supports the need for direct delivery. Back in May, the industry advocacy organization asked survey respondents how they prefer to place delivery orders from restaurants.

Preferences for QSR customers:

  • No preference: 10 percent
  • Over the phone: 19 percent
  • Third party: 35 percent
  • Restaurant website or app: 36 percent

Full-service customer preferences:

  • No preference: 8 percent
  • Over the phone: 28 percent
  • Third party: 29 percent
  • Restaurant website or app: 35 percent

Honestly, I find it surprising anyone calls a QSR to place an order. However, I suppose that makes sense for an office or catering.

At any rate, make sure your website is up-to-date, you offer direct or “last-mile” delivery, and make it easy to navigate your menu and the ordering process.

Is Ordering Here to Stay?

Now, we all know why restaurant delivery has been supercharged the past two years. However, consumer trend data show that delivery was on the rise before the Covid-19 pandemic.

But now that people are eager to return to normal and the industry is on its way to returning to pre-pandemic levels, is delivery really here to stay?

According to another question asked of survey respondents by Restaurants Canada, more than half of QSR and full-service restaurant customers plan to stick with delivery.

For their 2022 Foodservice Facts report, Restaurants Canada asked back in May how often consumers planned to place delivery orders in the next six months.

Order frequency for QSR customers:

  • Never placed a delivery order and don’t plan to now: 29 percent
  • Order less often: 20 percent
  • Will order with the same frequency: 45 percent
  • Will order more often: 7 percent

Frequency of orders for full-service customers:

  • Never placed a delivery order: 24 percent
  • Order less often: 23 percent
  • Will order with the same frequency: 44 percent
  • Will order more often: 9 percent

Here to Stay?

Of course, there are multiple factors feeding the numbers above. Some people simply don’t like ordering and waiting for delivery. For these consumers, the practice doesn’t just seem convenient.

There’s also the consumer demand to return to in-person dining, socializing with family and friends. And, of course, meeting new people while dining out.

We must also consider inflation and rising costs. Often, restaurant spending is among the first to be reduced when consumers need to be more frugal. Rising menu costs are sure to curtail some delivery spending.

That said, it’s clear delivery is here to stay and must be considered a crucial element for most restaurant operations. QSR and full-service operators need to bear in mind is placing orders; how often they’re placing orders; and get them in the habit of placing orders directly.

Image: Oliur on Unsplash

Top