Food trends

by David Klemt David Klemt No Comments

Slice Releases 2023 “Slice of the Union”

Indie Pizzeria App Slice Releases 2023 Report

by David Klemt

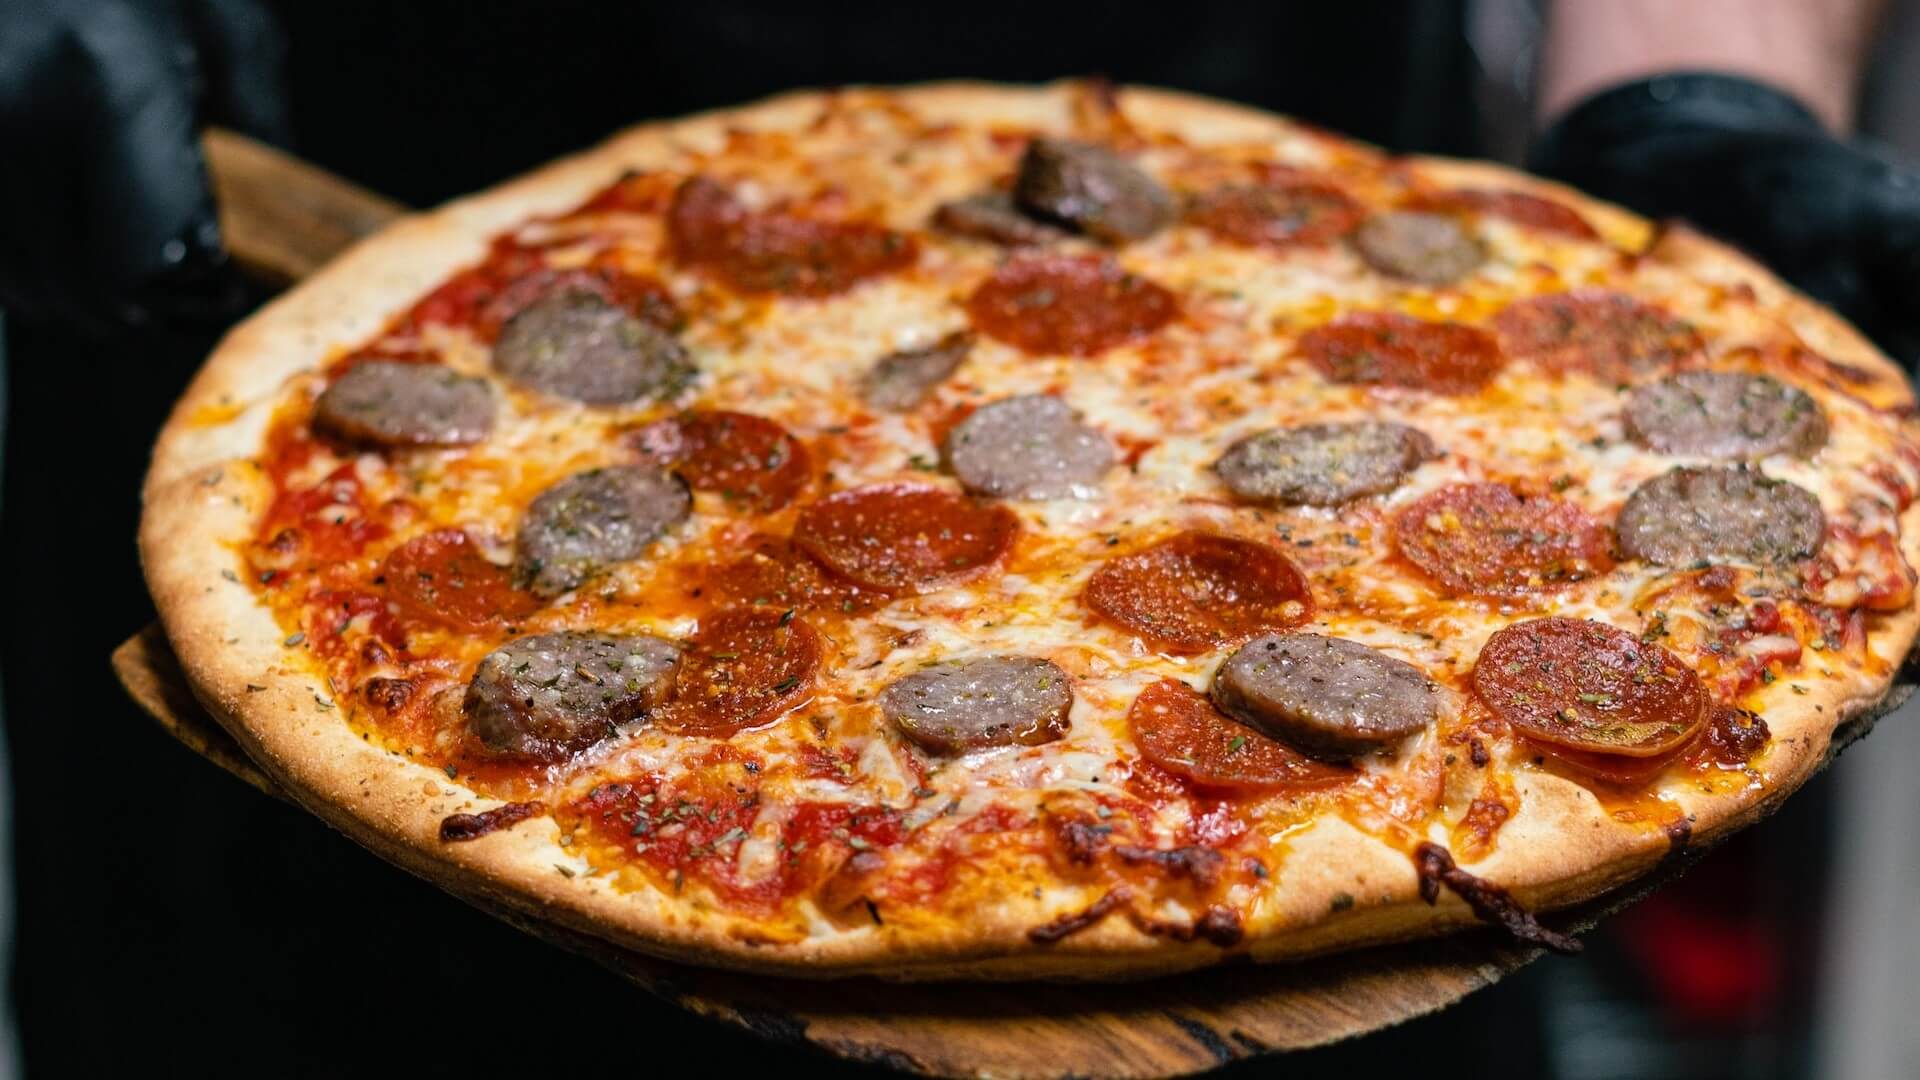
Wood-fired pizza on paddle

The annual Slice of the Union report from independent pizzeria ordering app Slice offers excellent insight into the indie pizza space.

Per the company’s website, Slice serves all 50 states and works with 19,000 pizzerias. For context, that’s a network of pizzerias more than double in size in comparison to Domino’s.

In my opinion, then, the company is well-positioned to deliver data regarding the indie pizzeria space.

Additionally, Slice says they save independent operators money. To date, Slice claims partners have saved more than $265 million in fees that would have gone to third-party delivery services.

In part, that’s due to a 2021 innovation by the company. At the International Pizza Expo in Las Vegas in August of 2021, Slice unveiled fixed-price, tiered packages for partners.


View this post on Instagram


A post shared by Slice (@slice)

Essentially, Slice intends to help local, indie pizzerias boost their reach, discoverability, and revenue. The company’s mission is “empowering independent pizzerias.” In part, Slice accomplishes their mission to “Keep Local Thriving” by offering indie pizzeria operators access to technology and services that rival the big pizza chains.

Below you’ll find some of the insights from the 2023 Slice of the Union that most stand out to me. To review the report in its entirety yourself, please click here. Not only is it an informative read, it’s actually fun.

Ordering Occasion

Kicking things off, ordering occasions. As all operators should know, many guests seek out particular cuisine, drinks, or venues dependent upon their dining or drinking occasion.

In the 2023 Slice of the Union, Slice takes a look at a couple occasions that motivate people to order pizza: sports and awards shows.

Now, it’s no surprise that people order pizza to enjoy while watching sports. So, since that’s common knowledge, Slice goes deeper and identifies the top sports leagues:

  1. Football
  2. Basketball
  3. Baseball
  4. Hockey

No mention of my two favorites, F1 and MotoGP, but at least hockey makes the cut. (My Vegas side says, “Go Knights!” but my born-in-Chicago side says, “Go ‘Hawks!”)

When we look at awards shows, the top spot may be somewhat of a surprise:

  1. People’s Choice Awards
  2. Tony Awards
  3. Emmy Awards
  4. Golden Globes
  5. The Oscars

Interestingly, the Grammys only manage an honorable mention. And there’s something poetic about pizza being the “people’s choice” for the People’s Choice.

Another bit of compelling data. Slice says that most people buckle and give up on their New Year’s resolution to keep away from pizza on January 13.

What’s in a Name?

There are certainly some creative pizzeria names out there.

However, Slice identifies not just some of the most common names but how many pizzerias use them:

  1. Joe: 206 pizzerias
  2. Sal: 206 pizzerias
  3. Tony: 114 pizzerias
  4. Johnny: 56 pizzerias
  5. Ray: 43 pizzerias
  6. Nino: 21 pizzerias

Flavors on the Rise

Wondering what the top topping is? What Slice sees as the pizza trends to watch?

Well, Slice has the answers to those questions (and more) in their annual report.

Pepperoni, as Slice says, “is a classic.” So, it wouldn’t provide much insight to just say, “Hey, pepperoni is popular.” Operators who offer pepperoni—and why wouldn’t they?—are already aware of its ubiquity.

Instead, Slice identifies the topping that’s showing the most growth. Per Slice, mushrooms has shown up on 8.9 percent more pizzas. Also, ranch dressing showed up on 9.7 percent more pizza orders in 2022.

Now, which trends may gain more significant footholds in the pizza space this year? Slice identifies two in their report:

  • Roman-style pizza
  • Pickle pizza

A Roman-style pizza is thin crust and pushes the toppings out all the way to the edges. A pickle pizza features—shocker—pickles heavily. According to Slice, this style of pizza normally includes a garlic sauce and mozzarella cheese.

Again, you’ll want to check this report out for yourself as there’s much more useful information. Click here to read it now.

Image: Dylan Sauerwein on Unsplash

KRG Hospitality Restaurants & Cafes, 2023 icon

by David Klemt David Klemt No Comments

American Trends 2023: Technomic

American Trends 2023: Technomic

by David Klemt

Pink pineapple against pink background

Foodservice research firm Technomic has some interesting predictions for the hospitality industry in the United States of America this year.

On the topic of operations, Technomic foresees more negotiating power among workers. Additionally, the firm looks at both the economy and pent-up guest demand.

When it comes to food, the US and Canada have a trend prediction in common. And as the image atop this article signifies, a particular color may be a hit on menus in 2023.

Before we jump in, Technomic’s 2023 Canadian trend predictions are here. Last year’s Technomic predictions for America are here. Curious readers can review the firm’s 2023 predictions in their entirety here.

Okay, let’s go!

Think Pink

I want to address this prediction first. According to Technomic, pink is going to be the F&B color of 2023.

As they explain, the color is fun, nostalgic, and photogenic. Yes, operators must still consider the Instagram-worthiness of their menu items. That may change one day, but it’s not today.

Per Technomic, pink also signals that a food or drink may have antioxidants.

Some of the items the research firm names specifically: pink pineapple, pink salt, pink celery, cara cara oranges, and schisandra berries.

Pickle It

This is the culinary trend that, per Technomic, Canada and America will share in 2023.

Along with fermenting, pickling gives the kitchen and bar teams a unique experimentation method to explore. So, encourage these teams to get creative and add pickling and fermentation to your next menu update.

Of course, that’s not the only reason to consider putting pickling front and center. For many, these preparations indicate a healthy F&B choice. Think kombucha, as an example.

As we know, healthy choices continue to be top of mind for many guests.

One more note: Technomic suggests being transparent and identifying the pickling and fermenting processes your team leverages to produce each menu item.

Economics

For those looking for a bit of optimism in these trying times, Technomic may have what you’re looking for. This year’s report, What We Foresee for 2023, says the following about the possibility of a recession:

“There is reason for optimism in the coming year, however, as any recession is expected to be relatively mild.”

Yes, that’s just one source’s opinion. However, Technomic is known for their voraciousness when it comes to data. So, if this firm is optimistic it could be a solid sign that things are looking up in 2023.

“Pent-up consumer demand” and variations thereof have been making the rounds since 2o21. However, it’s still a relevant phrase.

As it pertains to 2023, Technomic believes on-premise dining may “bounce back” this year. In fact, the firm suggests that people want to socialize and dine in person now more than ever.

Also, delivery and pickup times appear to be growing. So, plenty of people will see in-person dining as the more appealing option in 2023.

Operations

In part due to legislation addressing minimum wage and workplace conditions, employees may have the upper hand this year.

Add the fact that many people seeking work know many operators are dealing with a labor shortage and their negotiating position looks even stronger.

So, we could finally be in for a significant change when it comes to how the industry looks at compensation. More and more workers—and the guests they serve—are taking issue with tipping. Instead, many people outside and inside of the industry want to see operators pay staff a competitive, living wage.

Of course, there are also the hospitality professionals who prefer tips to minimum wage. In 2023, the industry could experience the start of a sea change. Time will tell.

For more predictions and this Technomic report in its entirety, please click here.

Image: Alex Gruber on Unsplash

by David Klemt David Klemt No Comments

Canada’s Top 2022 DoorDash Orders

Canada’s Top 2022 DoorDash Orders

by David Klemt

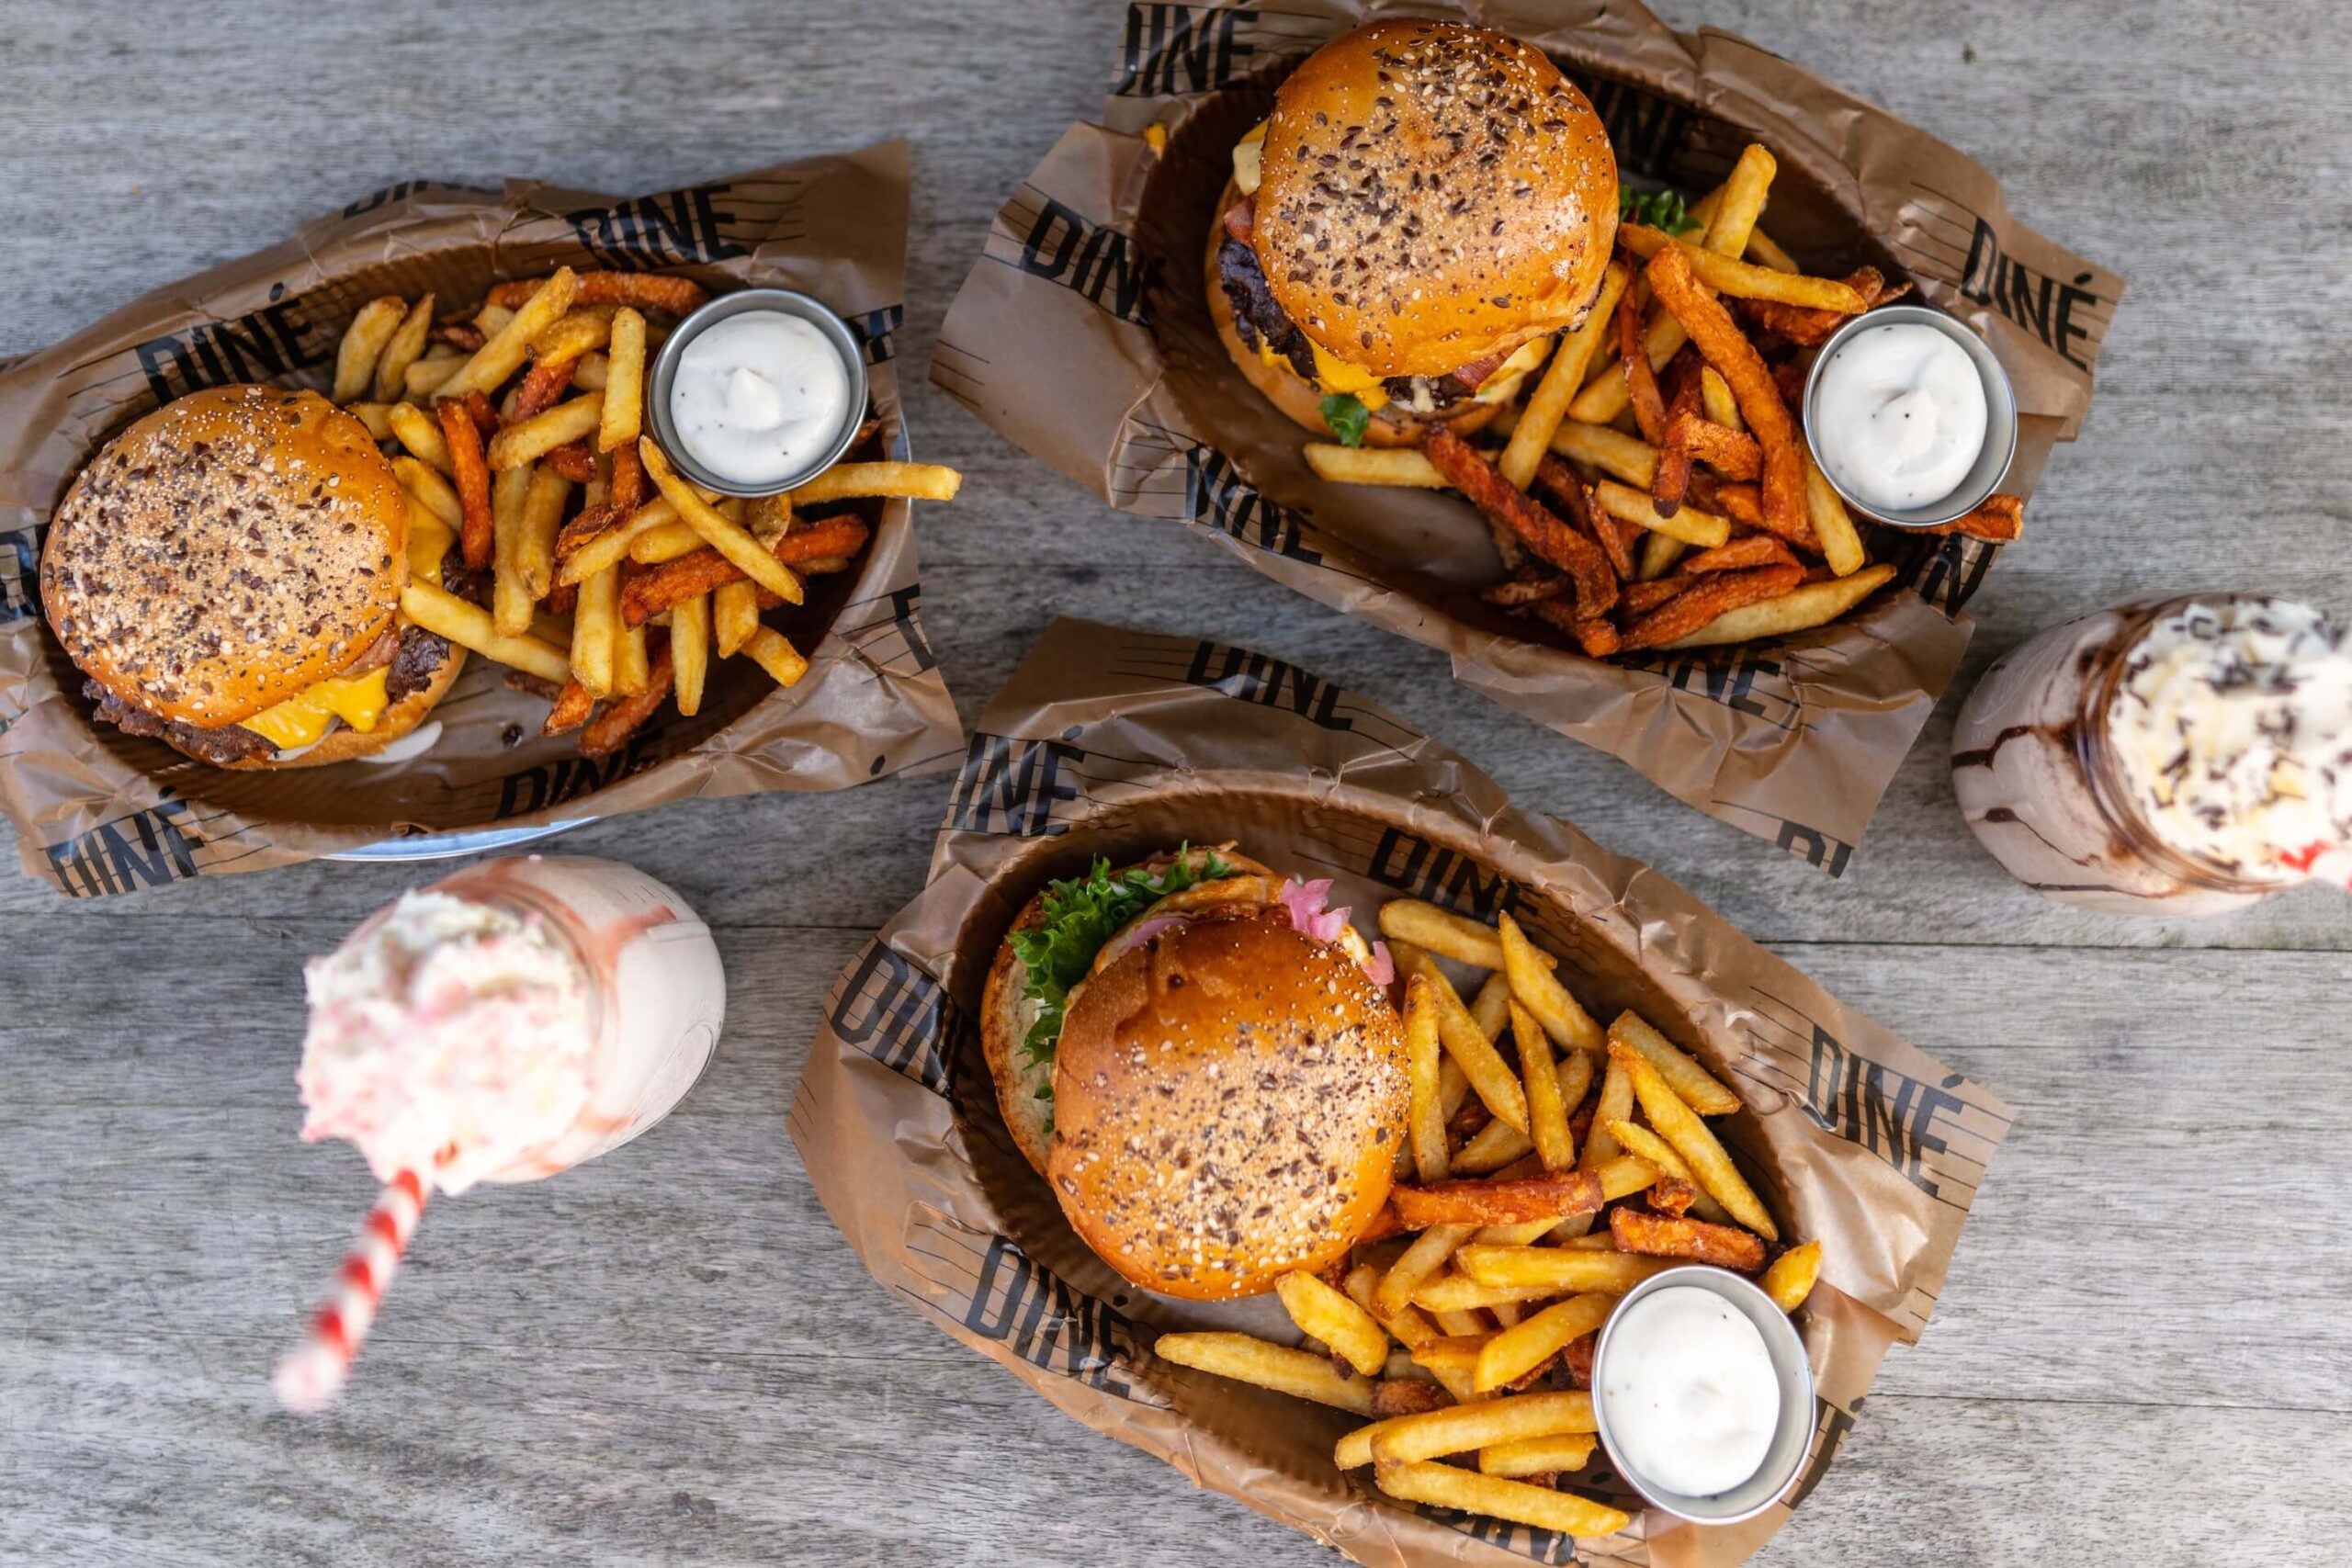
Burgers, French fries and milkshakes

Operators curious about the most popular delivery items in 2022 will be happy to learn that DoorDash’s year-end report is ready for viewing.

Those who want to compare it to predictions from several sources earlier this year can click here. The DoorDash Canada report can also be compared to consumer trends in Canada revealed back in October.

Before we jump in, I’m not detailing the DoorDash report in its entirety here. To review the entire report, please click here.

Instead, I’ll be sharing the top takeaways in terms of top menu items; top cuisines; and top items by province.

Speaking of provinces, a word to New Brunswick, Newfoundland and Labrador, Northwest Territories, Nova Scotia, Nunavut, Prince Edward Island, and the Yukon. Please don’t break out the pitchforks and come for me for not including you in this article. DoorDash’s report only covers data from six provinces—I didn’t leave you out intentionally.

Top DoorDash Cuisines in Canada

  1. American
  2. Mexican
  3. Japanese
  4. Thai
  5. Mediterranean
  6. Indian
  7. Chinese
  8. Italian
  9. Korean
  10. Filipino

Top DoorDash Items in Canada

  1. Burgers & Fries
  2. Fried Chicken
  3. Poutine
  4. Sushi Rolls
  5. Chicken Wings
  6. Burritos
  7. Chicken Rice Bowl
  8. Shawarma Wraps
  9. Curry
  10. Pad Thai

I think there’s one key takeaway that stands out in regards to this list. Notably, it appears that while chicken isn’t number one, it’s undeniably popular amongst Canadian DoorDash users.

In fact, according to DoorDash data, chicken reigns supreme in British Columbia. When you reach the province-specific sections below, you’ll see how powerful the cravings in BC are for chicken.

Top DoorDash Late-night Items

Again, chicken rules the DoorDash roost in this category.

  1. Chicken Nuggets
  2. Fries
  3. Poutine
  4. Chicken Wings
  5. Chicken Burgers
  6. Apple Pie
  7. Cheeseburger
  8. Spinach & Cheese Dip
  9. Chocolate Fudge Sundae
  10. Crispy Chicken

Top DoorDash Items: British Columbia

  1. Burrito Bowl
  2. Szechuan Chicken Lettuce Wraps
  3. Butter Chicken
  4. California Roll
  5. Crispy Chicken Sandwich
  6. Tofu Bowl
  7. Chocolate Chip Cookies

Top DoorDash Items: Ontario

  1. Cheeseburger
  2. Coffee
  3. Burrito Bowls
  4. Chicken Shawarma
  5. Crispy Chicken
  6. Bagels
  7. Pad Thai
  8. Beef Patty
  9. Pizza
  10. Onion Rings

Top DoorDash Items:Alberta

  1. Spinach and Cheese Dip
  2. Chicken Cheddar Sandwich
  3. Chilli Chicken
  4. Kale Salad
  5. Margarita Pizza
  6. Hot Apple Turnover

Top DoorDash Items: Québec

  1. Poutine
  2. Cappuccino
  3. Pad Thai
  4. Steak and Cheese
  5. Croissant
  6. Dumplings
  7. Chips
  8. Tacos

Top DoorDash Items: Saskatchewan

Interestingly, a beverage item holds the top spot in Saskatchewan.

  1. Bubble Tea
  2. Pepperoni Pizza
  3. Pork Bun
  4. Crispy Pork
  5. Garlic Bread
  6. Pasta

Top DoorDash Items: Manitoba

  1. Fries
  2. Butter Chicken
  3. Red Velvet Cake
  4. Poke Bowl
  5. Shawarma Wrap

As I stated in Wednesday’s article detailing Grubhub and Uber Eats’ reports for the US, we believe operators should take as much control over their restaurants and bars as possible. At KRG Hospitality, that means implementing direct delivery if it makes sense: ease of use, delivery capabilities, favorable costs, etc.

It’s also helpful to know what consumers in your area are craving and ordering. Such information can provide a useful baseline for many concepts’ menu development.

Image: John Fornander on Unsplash

by David Klemt David Klemt No Comments

Grubhub and Uber Reveal Top 2022 Items

Grubhub and Uber Reveal Top 2022 Items

by David Klemt

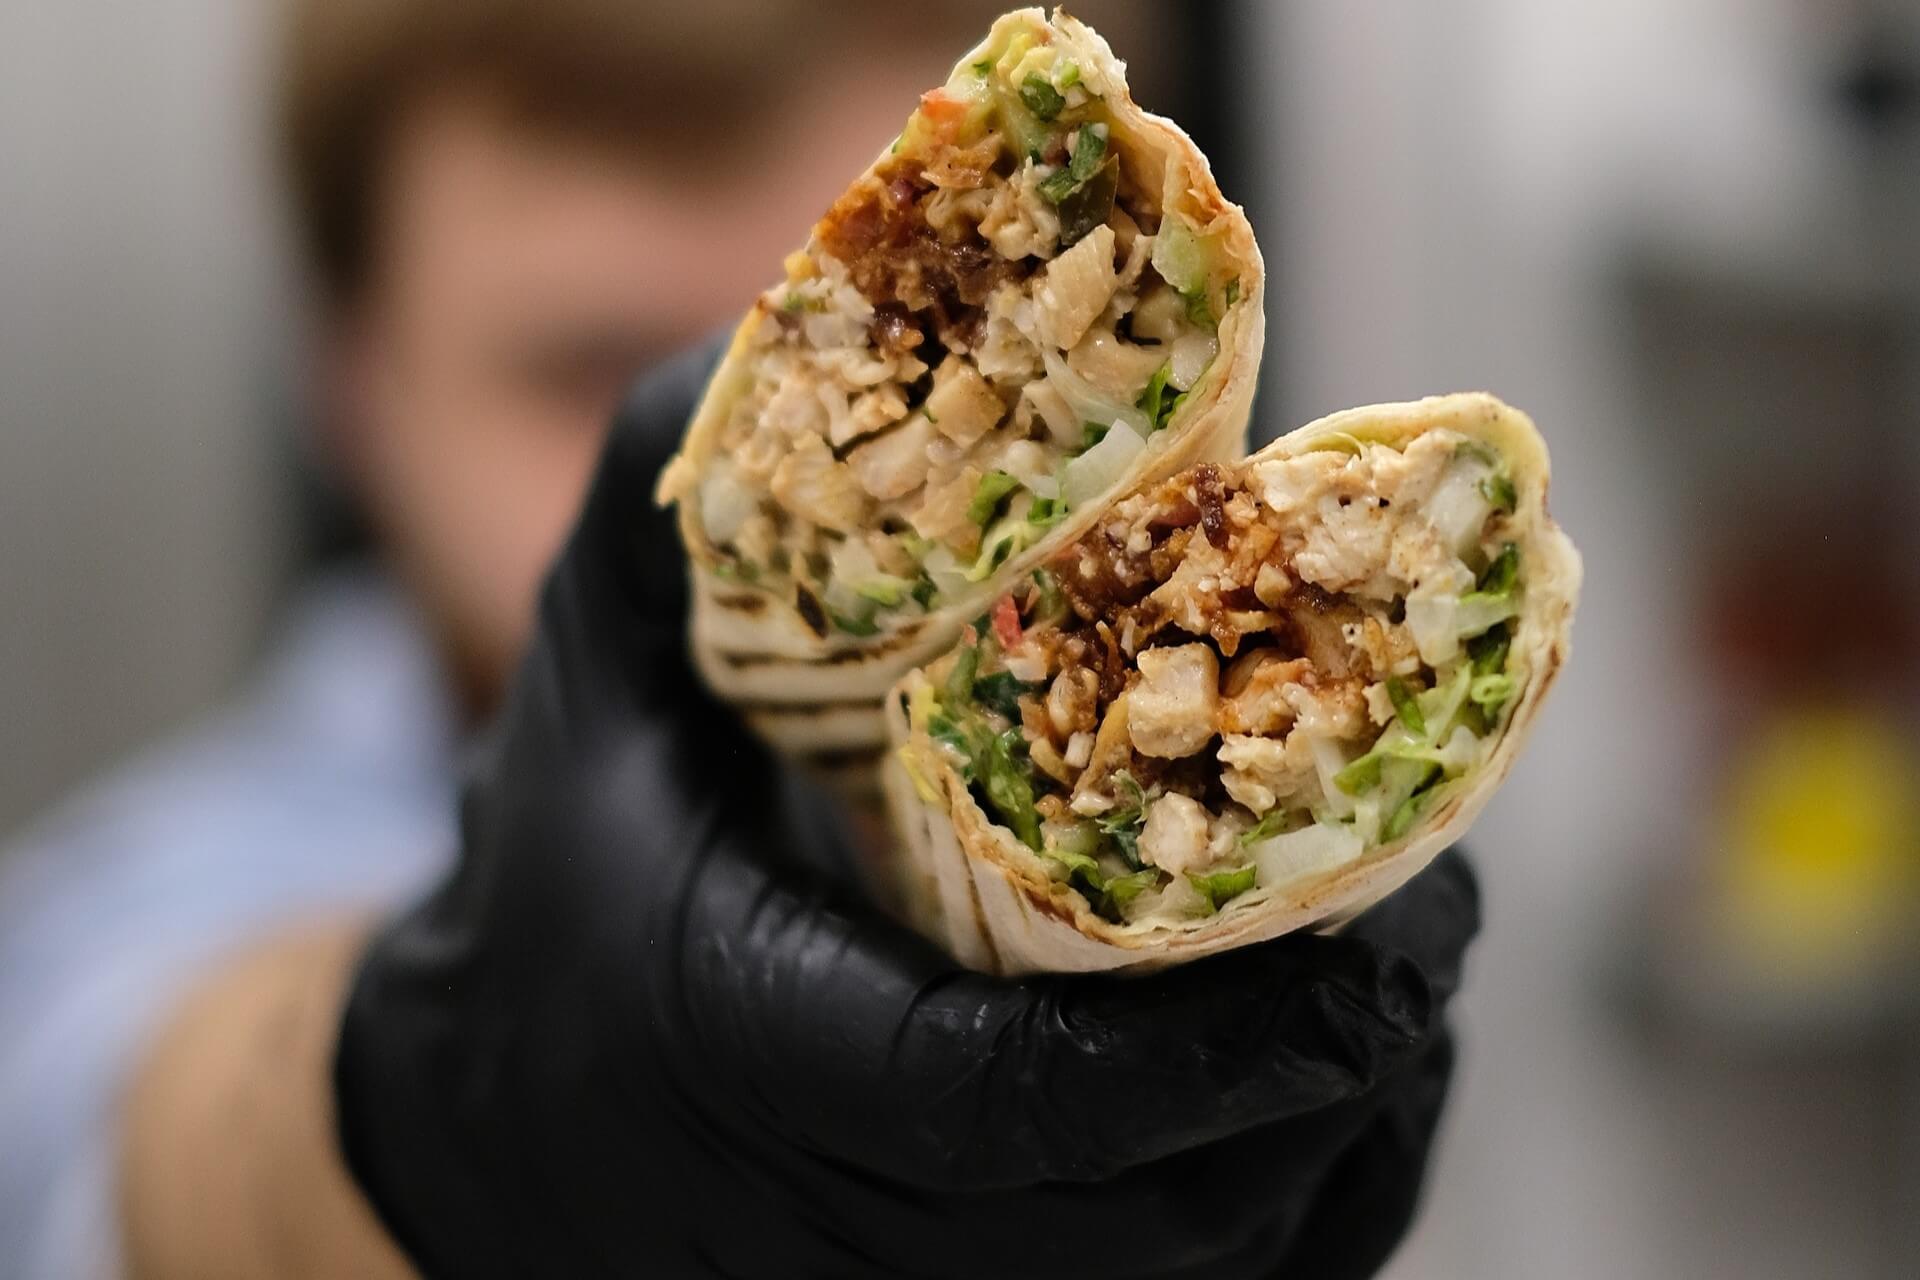
Chef pointing burrito halves toward camera

Grubhub’s 2022 Delivered and Uber Eats’ 2022 Uber Eats Cravings reports are live and there’s one surprise that’s immediately evident.

The top food item lists for both platforms make one thing clear right away: the chicken sandwich is no longer sitting on its throne.

Instead, as far as the data for these two delivery powerhouses show, there’s a new food item king. More compellingly, this menu item holds the throne on both platforms.

Now, I’m not suggesting the fried chicken sandwich is in the dungeon. In fact, the popular sandwich causing “wars” in the QSR space is still holdings it own. Indeed, the sandwich is still in the top five overall at Uber Eats.

Shockingly, it’s not in the top five overall at Grubhub. However, the fried chicken sandwich is among the top five Grubhub lunch and late-night orders.

So, which menu item wears the crown for 2022 in the kingdoms of Grubhub and Uber Eats? The burrito.

That’s awesome news for most operators. Much like the humble but mighty chicken sandwich, concepts can put their signature spin on a burrito. In fact, most concepts can put multiple signature spins on the new king of delivery items. One way to approach this would be to create a permanent signature and then seasonal LTOs.

Top 10 Grubhub Items

In 2022, the fried chicken sandwich only clinches the number seven spot at Grubhub.

Just like Uber Eats, cheeseburgers and pizza outperform the chicken sandwich.

  1. Burrito (bowl or regular)
  2. Cheeseburger
  3. Cheese Pizza
  4. Pad Thai
  5. Chicken Quesadilla
  6. California Roll
  7. Fried Chicken Sandwich
  8. Caesar Salad
  9. Chicken Tikka Masala
  10. Boneless Wings

Top 5 Grubhub Breakfast Items

  1. Sausage, Egg + Cheese Sandwich
  2. Donuts
  3. Sausage Burrito
  4. Bagel with Cream Cheese
  5. Muffins

Top 5 Grubhub Lunch Items

  1. Burrito
  2. Cheeseburger
  3. Fried Chicken Sandwich
  4. Cheese Pizza
  5. Chicken Quesadilla

Top 5 Grubhub Late-night Items

  1. Chicken Quesadilla
  2. Fried Chicken Sandwich
  3. Cheeseburger
  4. Mozzarella Sticks
  5. Cheese Pizza

As we see, the chicken quesadilla does some heavy lifting at Grubhub. The item holds the number five spot overall, at lunch, and during the late-night daypart.

Top 10 Uber Eats Combos

For their 2022 report, Uber Eats takes a different approach than Grubhub. Instead of just listing individual items, the platform identifies their top combos.

  1. Burrito + Cheese
  2. French Fries + Salt
  3. Cheeseburger + Diced Onions
  4. Chicken Sandwich + Fries
  5. Breakfast Sandwich + American Cheese
  6. Soup + Bread
  7. Pancakes + Sausage
  8. Pizza + Mozzarella
  9. Salad + Balsamic Vinaigrette
  10. Quesadilla + Sour Cream

Most “Unexpected” Uber Eats Combos

  • Ham + Cream Cheese
  • Fruit Roll Up + Hot Cheetos
  • Pickles + Whipped Cream
  • Popcorn + Pickle Juice
  • Dark Chocolate + Tomato Salad
  • Pizza + Applesauce
  • Sushi + Ranch
  • Peanut Butter + Pizza
  • Cheese + Martinis
  • Watermelon + Mustard

To read both reports in their entirety, click here for Grubhub and here for Uber Eats. There are more insights, including beverages and beverage combos.

Of course, longtime readers and our clients know where we stand on third-party delivery platforms. Ideally, operators should take as much control over their business as they can. For us, that means implementing direct delivery as long as it’s feasible and incurs lower costs than third-party.

We view delivery platform reports as menu development resources. It’s always wise to keep up to date on consumer and food trends, after all.

Image: Kamila Bairam on Pexels

by David Klemt David Klemt No Comments

Menus in Canada: Who Wants What Items?

Menus in Canada: Who Wants What Items?

by David Klemt

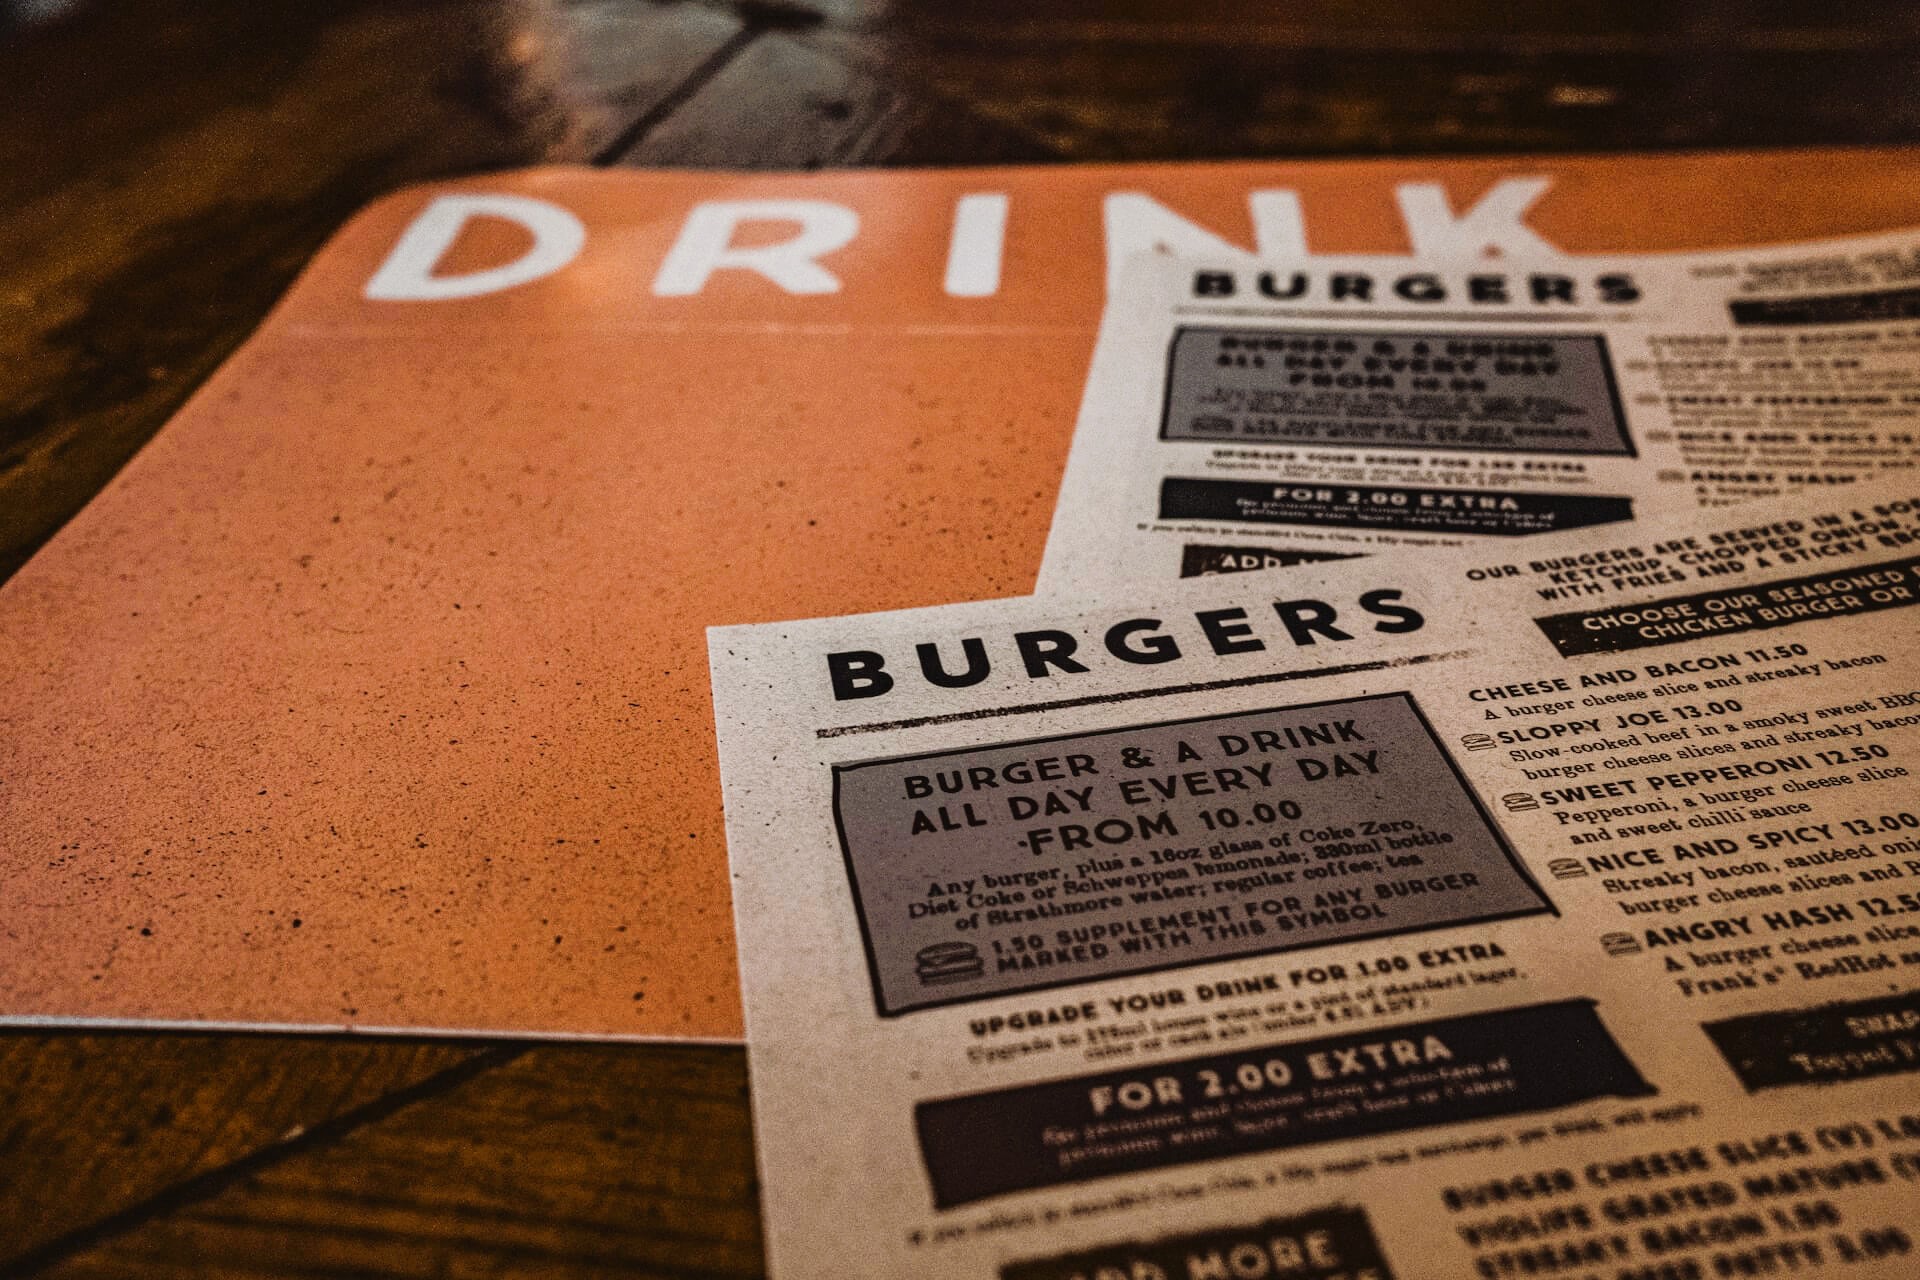
Bar and restaurant food and drink menus

Nobody has a crystal ball telling them what they should put on their menus to boost traffic and revenue, but we do have data.

In this instance, we have useful data regarding Canadian consumers specifically. Not only do we have helpful information from Restaurants Canada, David Henkes from Technomic has also weighed in. For those who are unfamiliar, Technomic is one of the best foodservice research and consulting firms.

Before we dive into Restaurant Canada’s menu trend information, this is not a review of the top menu item orders in Canada. For a deep dive into that topic in particular, please read our article “F&B in Canada: Top Menu Items.”

Instead, in this article we’re reviewing broader menu categories and interest in them among Canadian consumers. For your own copy of the 2022 Foodservice Facts report, click here.

Word of Warning

Now, it’s important to bear in mind that the data below is a snapshot. It’s important, informative data but it shouldn’t influence your menu completely.

In other words, when considering revising your menu in any way, make sure you’re staying true to your brand and the community you serve. If your data differs from Restaurants Canada and Technomic data, that’s okay.

Not only are there always outliers, not all data applies to every concept. So, don’t take drastic action on your menus based solely on the data below.

For this particular topic, Restaurants Canada asked three age groups about their interest in eight menu categories.

The groups are: 18 to 34, 35 to 54, and 55-plus. The industry advocacy group then reviewed the numbers for those who indicated they’re “very interested” or “somewhat interested” for each category or item.

Who Wants What?

The menu category generating the most interest from Canadian consumers, according to Restaurants Canada data, is food sourced from local farmers. Overall, 93 percent of survey respondents very or somewhat interested. Those in the 55-plus age group are the most interested.

More than 80 percent are interested in comfort foods, or creative riffs on comfort foods. Age groups 18 to 34 and 35 to 54 have the most interest. Precisely 80 percent are interested in trying globally inspired foods and flavors, led by the 18 to 34 age group.

Foods that promote health and wellness come next, with 79 percent of Canadian consumers showing interest. The 55-plus age group is particularly interested. However, dishes that utilize ingredients that boost one’s immune system are only popular among 53 percent of survey respondents. Interestingly, it’s the 18 to 34 age group with the most interest in this category.

In what’s possibly a contrast from American consumers, the final three categories have no more than 41 percent of survey respondents’ interest. Forty-one percent have interest in meatless and vegetarian items. Next, just 38 percent show interest in alcohol-free cocktails. Finally, just 33 percent are interested in plant-based burgers and sausages.

For each of those categories, the greatest interest comes from the 18 to 34 age group, and the 55-plus group shows the least amount of interest.

Recommended Reading

We’ve been reviewing the 2022 Foodservice Facts report from Restaurants Canada in depth for several weeks. To learn more about this important report, please read the following:

Image: Samuel Regan-Asante on Unsplash

by David Klemt David Klemt No Comments

F&B in Canada: Top Menu Items

F&B in Canada: Top Menu Items

by David Klemt

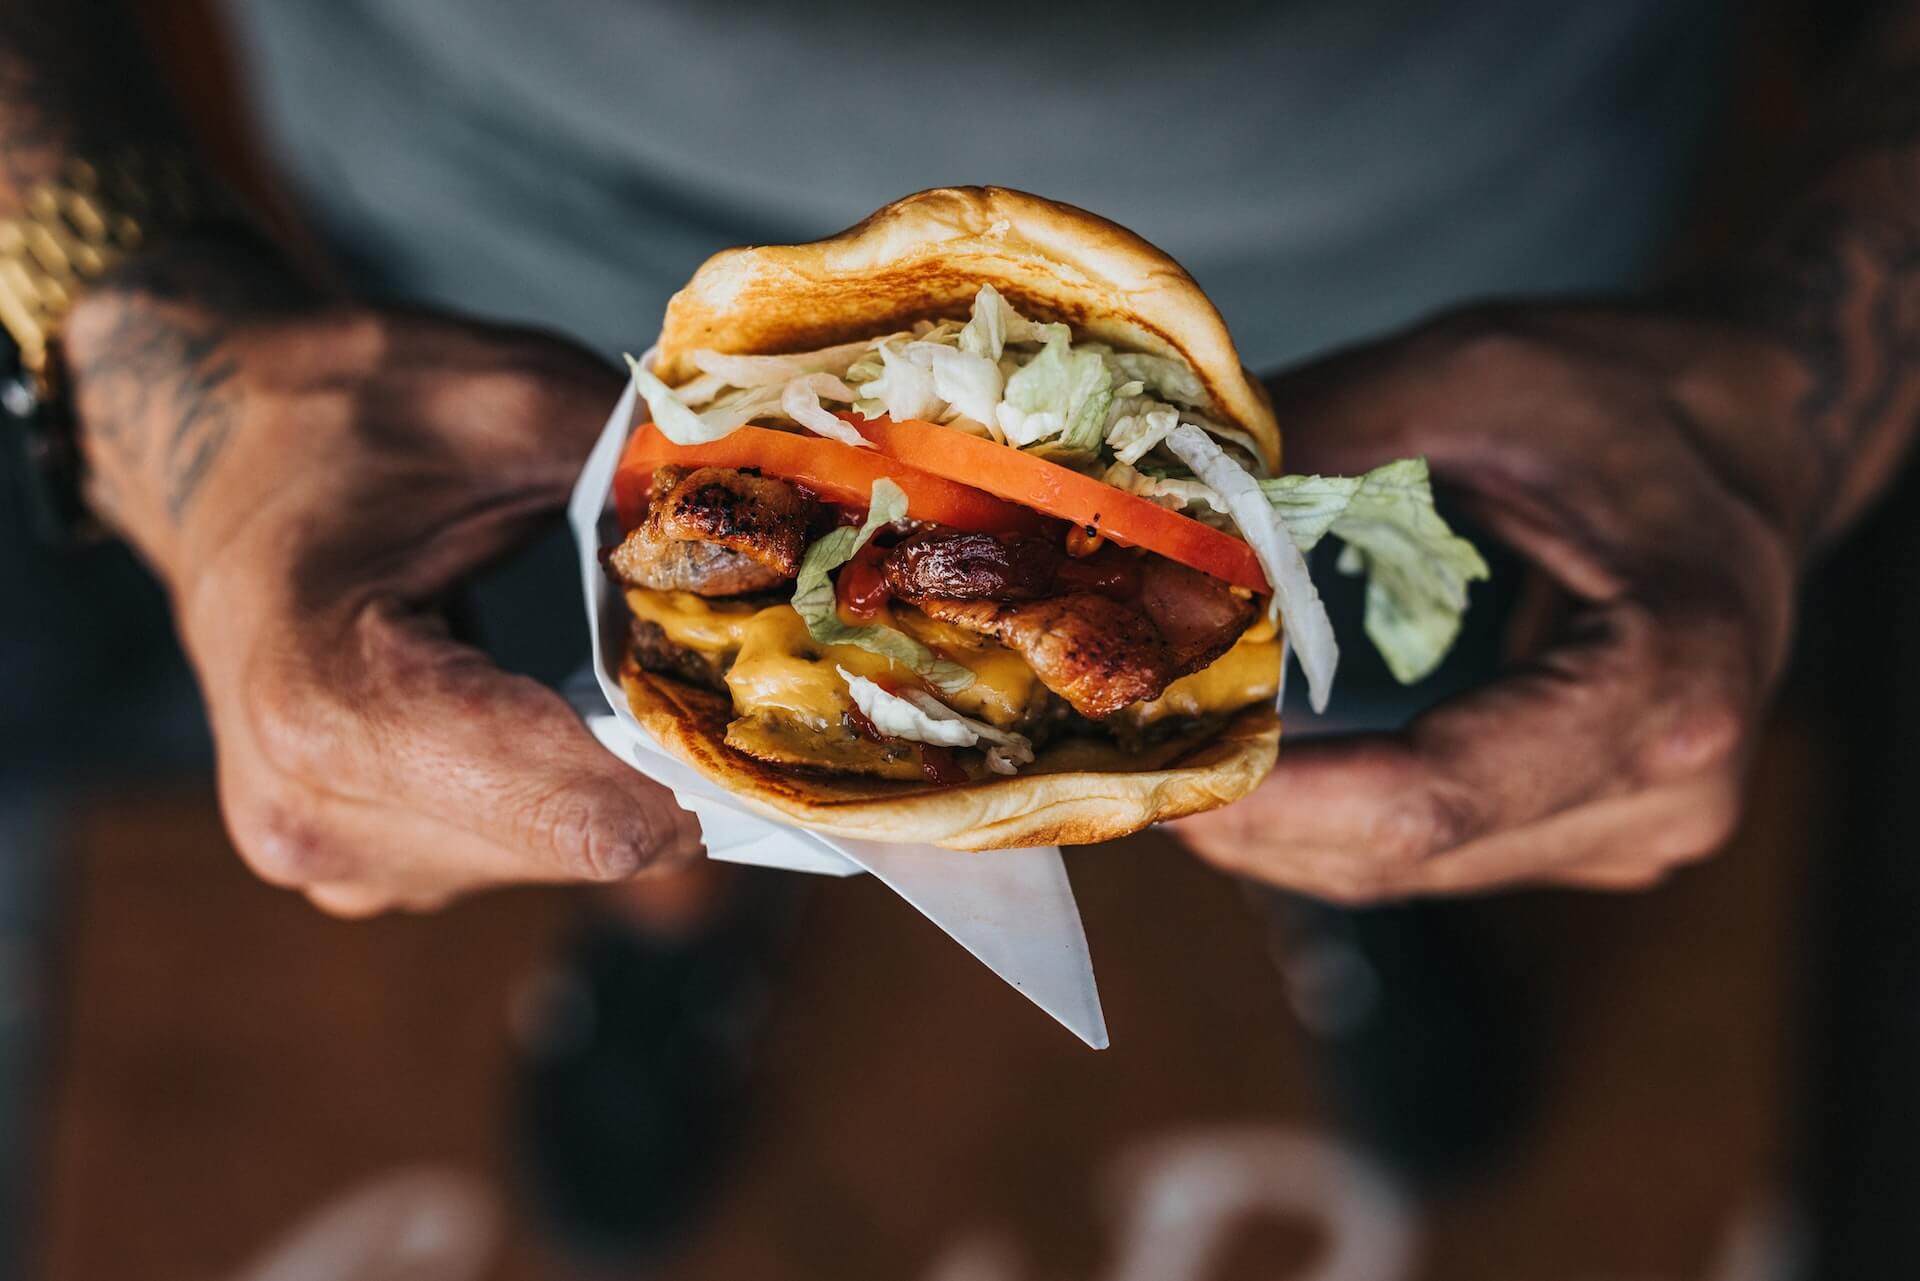
Closeup of hands holding burger

Those wondering what food and beverage menu items are performing best among consumers throughout Canada need wonder no more.

And why is that? Well, Restaurants Canada has the answers, revealing the top ten food and top ten beverage items.

Further, the organization compares each item’s performance. In this instance, Restaurants Canada analyses the percentage of orders that contained each food or beverage item from January to April 2022 in comparison to 2019.

These insights (and many more) are available in Restaurants Canada’s 2022 Foodservice Facts report. In fact, you can find our reviews of several of the restaurant advocacy group’s report topics via the links below:

For your own copy of this year’s Foodservice Facts report, click here.

Top 10 Canadian Drink Menu Trends

As you’ll see below, coffee is outperforming nearly every other beverage category. Specifically, Hot coffee is at the top, while Iced or frozen coffee is ranked third.

Unsurprisingly, Carbonated soft drinks / Pop / Soda split the two coffee categories. According to Restaurants Canada, the Carbonated soft drink category can credit its performance in large part to QSRs.

  1. Milk: 1.8% (2019) to 1.8% (2022)
  2. Iced tea: 2.9% (2019) to 1.6% (2022)
  3. Milkshakes / Smoothies: 2.1% (2019) to 2.0% (2022)
  4. Fruit juice: 3.8% (2019) to 3.0% (2022)
  5. Hot tea: 5.5% (2019) to 4.5% (2022)
  6. Alcohol beverages: 5.1% (2019) to 5.7% (2022)
  7. Water: 6.6% (2019) to 5.0% (2022)
  8. Iced or frozen coffee: 5.3% (2019) to 7.5% (2022)
  9. Carbonated soft drinks / Pop / Soda: 19.7% (2019) to 20.2% (2022)
  10. Hot coffee: 40.9% (2019) to 41.9% (2022)

Compellingly, Alcohol beverage performance in restaurants fluctuated by age group between 2021 and 2022. Alcohol order shares in restaurants, per Restaurants Canada:

  • Legal drinking Age (LDA) to 34: 46% (2021) to 43% (2022)
  • 35 to 49: 17% (2021) to 21% (2022)
  • 50-plus: 37% (2021) to 36% (2022)

Alcohol order shares in bars, according to Restaurants Canada:

  • LDA to 34: 35% (2021) to 35% (2022)
  • 35 to 49: 17% (2021) to 19% (2022)
  • 50-plus: 49% (2021) to 47% (2022)

Overall, the 35 to 49 age group appears to be consuming less alcohol in bars and restaurants in comparison to the LDA to 34 and 50-plus cohorts.

Top 10 Canadian Food Menu Trends

As Restaurants Canada notes, the Sandwich / Sub category has grown in 2022. Interestingly, the category just below it in growth, Chicken, is partially responsible for boosting Sandwich / Sub performance.

As far as entrees or “main attractions,” the Burger category remains at the top, beating out Breakfast, Sandwich / Sub, Chicken, and Pizza menu items.

  1. Cake / Squares / Muffins: 3.7% (2019) to 3.3% (2022)
  2. Salad: 4.3% (2019) to 3.8% (2022)
  3. Donuts / Beignets: 3.0% (2019) to 3.8% (2022)
  4. Breads: 4.3% (2019) to 3.4% (2022)
  5. Pizza / Panzerotti / Calzone: 4.1% (2019) to 4.3% (2022)
  6. Chicken: 7.6% (2019) to 8.5% (2022)
  7. Sandwich / Sub: 8.0% (2019) to 8.5% (2022)
  8. Breakfast: 10.8% (2019) to 11.4% (2022)
  9. Burger: 9.0% (2019) to 10.9% (2022)
  10. French fries / Potato / Sweet potato / Onion rings: 15.0% (2019) to 16.1% (2022)

Image: Nathan Dumlao on Unsplash

by David Klemt David Klemt No Comments

What’s Up with Meat, Poultry and Seafood?

What’s Up with Meat, Poultry and Seafood?

by David Klemt

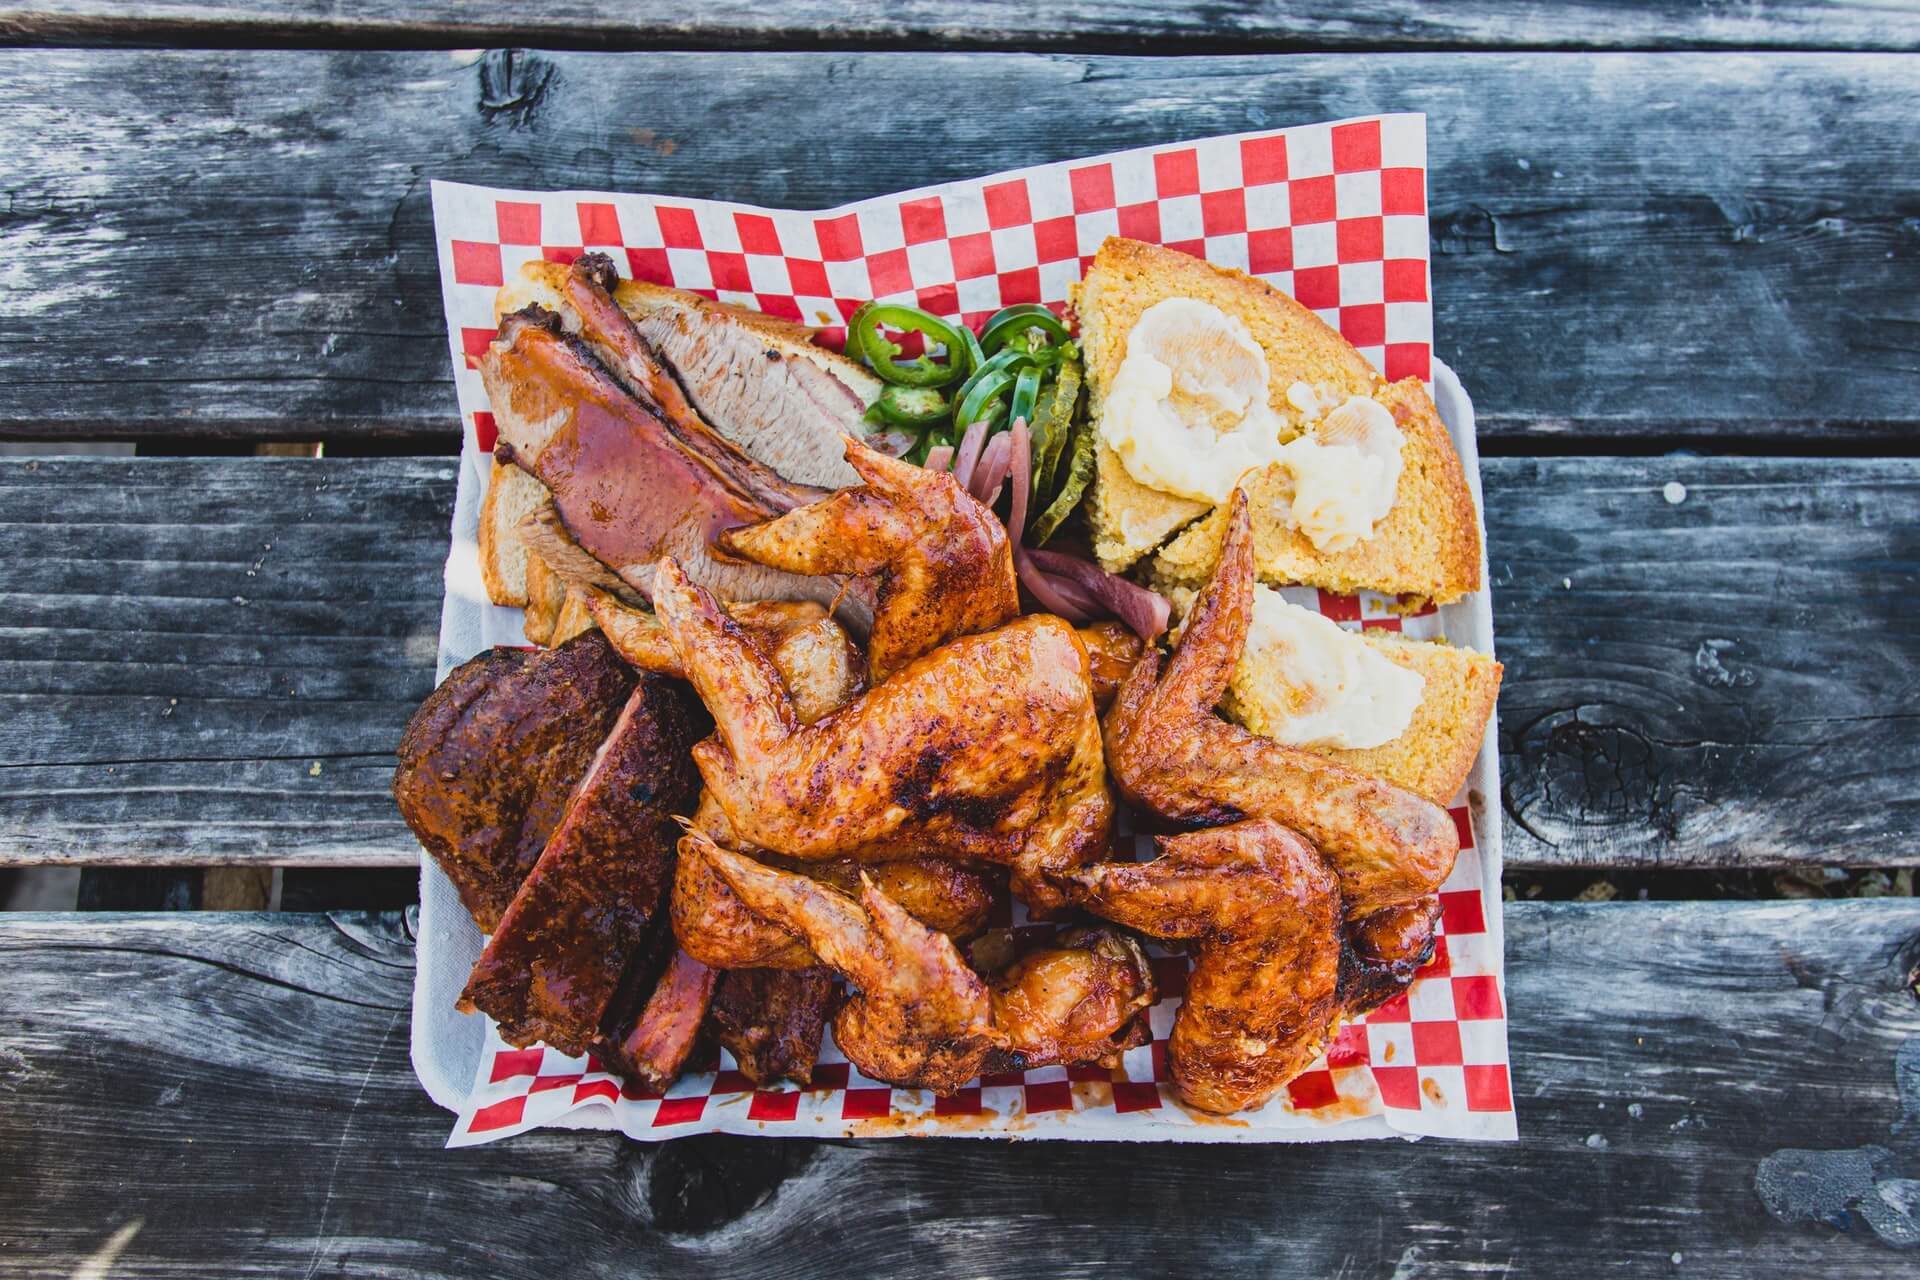
Barbecue food plate on wooden table

We know how plant proteins are performing with consumers but what do we know about how meat, poultry, and seafood are doing?

Well, because of a recent report from Datassential, we know many consumers are “meat-limiters.” And research from the World Resources Institute shows that plant-based performance is nuanced.

Interestingly, the performance of animal proteins on-premise appears to be following a beverage trend: Moderation. According to Datassential, more consumers are reducing their consumption of meat and poultry than increasing it in comparison with 2021.

So, meat-limiters may be indicative of the future of meat consumption.

Consumer Shifts

As the name implies, meat-limiters are limiting or otherwise reducing their consumption of animal proteins. Importantly, it doesn’t appear that a significant percentage of consumers are eliminating animal proteins from their diets.

Rather, many people are simply increasing the amount of plant-based items they’re eating. However, that increase is more aspirational than real in some cases.

Per Datassential’s survey of 1,500 consumers in the US, just over 70 percent of people are meat eaters. In contrast, nearly 25 percent are “flexitarian.” Just two percent are vegan or pescatarian, and only three percent are vegetarian.

So, the vast majority of Americans are still consuming meat, poultry, and seafood. We just now have reason to believe that more consumers may be leaning toward a flexitarian diet.

A bit over a quarter of consumers consume meat every day. Still, many people aspire to eat more vegetables, fruits, and whole grains, per Datassential.

However, there are more pescatarians, vegans, and vegetarians among Gen Z than the overall population. According to Datassential, this could indicate a shift away from animal proteins in the future.

Meat Performance is Nuanced

Just like plant-based performance, meat performance is nuanced. There are many factors at play.

Shifts in what consumers value are driving changes to the performance of proteins. Health, sustainability, the climate, taste, and affordability have an effect on all proteins, animal and plant.

Undeniably, inflation and shaken consumer confidence are impacting protein performance. Everything, it seems, is more expensive at the moment. Generally speaking, animal proteins are pricier than plant-based items.

It makes sense, then, that some consumers are reducing their intake of animal proteins and filling that void with fruits, veggies, and legumes.

Of particular note are shifts in daily and weekly consumption of animal proteins in 2022. Meat consumption once or more per week—beef, lamb, pork, veal—is up three percent. However, there’s a ten-percent increase in consumers eating poultry once or more per week.

Interestingly, daily poultry consumption is down seven percent in comparison with 2021. Likewise, daily consumption of seafood is also down seven percent, and fewer people are consuming it less than once per week.

Plant-based is Down

Despite what some would think, meat-limiters don’t appear to be driving up plant proteins significantly.

In fact, according to Datassential, the daily consumption of plant-based proteins is down. Per the research firm, seitan, tempeh, and tofu are the experiencing the greatest drop in daily consumption.

The fact is that across generations, more consumers eat animal proteins on a daily basis than their plant-based counterparts. Gen Z, per Datassential, consumes more animal proteins on a daily basis than other generations.

So, how does it make sense that people are reducing their meat intake but plant-based isn’t seeing a sizable jump in consumption?

In part, the answer is the growing popularity of plant-forward dishes. These are items, like bowls, that offer a small amount of meat, poultry, seafood or dairy. The majority of these menu items consists of plants but are not free of animal proteins completely.

The path forward may indeed be a plant-forward menu. Of course, this is heavily reliant on a specific concept or brand. Still, it’s likely many restaurants can do well offering mixed dishes, those heavier on plant proteins than animal proteins.

Image: Peter Pham on Unsplash

Note: This article is based on information from Datassential’s “2022 Plant-Forward Opportunity” report. To access a number of free reports, sign up with Datassential today.

by David Klemt David Klemt No Comments

Global Trends 2022: Technomic

Global Trends 2022: Technomic

by David Klemt

"For the World" neon sign

What? You didn’t think we would focus only on Canada and America when it comes to 2022 trends, did you?

It’s difficult to keep up with restaurant, bar, and cuisine trends if you keep your focus too narrow.

Technomic is acutely aware of this. So, we took a look at senior research manager Aaron Jourden’s 2022 Global Restaurant Trends Forecast report.

One specific item, a coffee, is a striking standout. But we’ll get to that in a moment…

Operations

First, let’s take a look at restaurant and bar operations.

It’s not just North America that’s facing a labor shortage. And in 2022, Technomic expects this challenge to persist.

There are a few ways we can look at labor shortages and other challenges.

One: We can make no internal changes, pretending hope is a strategy and things will work themselves out magically. Two: We can get cynical and hostile, putting the blame on workers.

Three: We can look at the industry as a whole and operations in particular to make meaningful changes. Working conditions can be improved, leadership skills can be developed, operations can be streamlined, inventory can be cross-utilized and maximized. What are we offering workers and guests? What can be changed to reduce costs, and to increase traffic and revenue?

In other words, operators are in a position to adapt, innovate, and make meaningful changes that will ensure our industry’s long-term survival.

Labor, supply chain, and cost issues will continue in 2022. However, Technomic predicts that 2022 will be the year of measurable recovery.

Fading Ghosts

Technomic isn’t saying that ghost kitchens are going put to rest.

Rather, the firm expects the hype around them to fade away. To be sure, ghost (and virtual—not the same thing) kitchens enjoyed quite a bit more than 15 minutes of fame in 2020 and 2021.

However, we’ve seen recent reports of certain ghost kitchen chains facing logistic and legal troubles. The shine very much seems to be dulling on this pandemic trend.

Again, Technomic doesn’t think ghost kitchens will suddenly disappear. But the incessant coverage? That may be on the way out in 2022.

Food & Flavor Trends

Now, the fun stuff. If Jourden’s report proves accurate, menus throughout the world are going to see some intriguing additions:

  • Breakfast Comes Back. With people heading back to the office and children back in school, the breakfast daypart will return. Operators who did away with breakfast may see value in bringing breakfast food and beverages back.
  • Chicken or the Egg? Per Jourden’s report, the egg sandwich is in a position to knock chicken sandwiches off their pedestal. So, chicken wins either way. Jourden points to an interesting element of this prediction: Eggs are fun, allowing for puns on menus, marketing, and branding.
  • Regional vs. Global. A number of regional brands will stand out against global brands in 2022. Regional brands speak to what today’s consumer wants: locality and hyper-locality; sustainability and responsible business practices; and a focus on healthfulness.
  • What Coffee?! Jourden’s report identifies a number of truly innovative and intriguing F&B trends for 2022. The one that grabbed my attention immediately? Avocado coffee. Already popular in Indonesia, avocado coffee is expected to find its way onto menus across the globe. Other items Jourden thinks will gain traction in 2022: Pão de queijo (Brazilian cheese bread), Mexican flatbreads, vegetarian-friendly meat alternative halloumi, mutabal or moutabal (baba ghanoush’s cousin), regional comfort soups, and plant-based eggs.
  • Functional Foods. If you didn’t find avocado coffee intriguing, what about dessert foods imbued with healthful characteristics? Jourden identifies a few desserts that do more than satisfy a sweet tooth: Hand pies that boost immune systems, macarons made to enhance moods, and even ice cream that will enhance a person’s skin health and appearance.

Next year is going to be challenging. That simply isn’t up for debate. But it’s also going to be rife with opportunity and innovation for savvy operators.

Image: Jon Tyson on Unsplash

by David Klemt David Klemt No Comments

Global Cuisine Performance

Global Cuisine Performance

by David Klemt

Cook making handmade pasta noodles

We don’t have a crystal ball to help us see which cuisines will be most popular. Obviously, the same holds true for knowing which are just now getting recognition.

However, we do have the next-best thing: data from Datassential.

Recently, the food and beverage analytics firm ranked dozens of global cuisines according to their current state of popularity among diners.

Then, they shared that information in October during their “Around the World in 80 Trends” webinar.

“Ubiquity”

When analyzing food and beverage trends, Datassential funnels them into four distinct designations: Inception, Adoption, Proliferation, and Ubiquity.

Arguably, once a trend reaches Proliferation and Ubiquity it becomes a mainstay. So, we can more than likely stop referring to it as a trend.

Now, the two most precarious stages for a trend are Inception and Adoption. Plenty of trends die on the Inception vine. Several won’t make it out of Adoption.

When you see Datassential’s list of global cuisines that fly under the Ubiquity banner, I doubt there will be much surprise:

  • Italian
  • Southern
  • Mexican
  • Creole/Cajun
  • Tex Mex
  • Chinese

So, any shocks to your system there? Most likely not.

“Proliferation”

Another to label this Datassential designation is “second most popular.” Each of these cuisines has a clear shot at reaching Ubiquity.

In fact, I find one of the global cuisines in this category surprising. It’s the first one in this list:

  • Japanese
  • Regional Italian
  • Regional Mexican
  • Greek
  • Mediterranean
  • Regional US
  • Southwestern
  • Cuban

As you’ll see, the lists grow longer steadily as we move down from Ubiquity.

“Adoption”

For me, it’ll be interesting to review follow-up data from Datassential regarding global cuisines.

As such, I’m eager to learn which cuisine from the list below reaches Proliferation in 2022:

  • Caribbean
  • Indian
  • French
  • Regional Chinese
  • Oaxacan
  • German
  • Middle Eastern
  • Korean
  • Ashkenazi
  • Hawaiian
  • Vietnamese
  • Venezuelan
  • Spanish
  • Sicilian
  • Jamaican
  • Israeli
  • Thai
  • British

To be honest, my first reaction to seeing French cuisine under the Adoption banner was surprise. Of course, I then thought back to how many French restaurants we have here in Las Vegas.

Sure, this little city in the desert is a foodie destination. However, French restaurants don’t dot the landscape like those that focus on other cuisines.

“Inception”

That brings us to the first stage of any trend: Inception.

Now, the first thing you’ll notice is that this category contains the most global cuisines. Whereas Adoption features 18, Proliferation lists eight, and a mere six have reached Ubiquity, Inception identifies two dozen.

They are as follows:

  • Brazilian
  • Mizrahi
  • Russian
  • Malaysian
  • Croatian
  • Moroccan
  • Lebanese
  • South African
  • Native American
  • Central American
  • Argentinian
  • Peruvian
  • Filipino
  • Appalachian
  • Sephardic
  • Ethiopian
  • Senegalese
  • Scandinavian
  • Sonoran
  • Nigerian
  • Iranian
  • Persian
  • Turkish
  • Polish

Again, there are some surprises here, at least for me. For example, I expected Ethiopian cuisine to have reached Adoption by now.

Takeaways

Of course, there are multiple ways to interpret this data.

First, you can embrace Ubiquity, leveraging their incredible popularity. However, standing out and building traffic will be challenging.

Second, you can feature Proliferation cuisine. Sure, these have yet to reach the Ubiquity stage. But they’re close to doing so, and you’ll also face stiff competition.

Third, focusing on cuisine from the Adoption designation involves taking a risk but mitigating it somewhat. These cuisines are developing a following and guest demand.

Finally, the riskiest move, depending on location: featuring Inception cuisines. But with risk comes reward. Identify a gap in a certain area—something we can do with our signature feasibility studies—and you may realize staggering success.

So, what do you think? Did you find any of Datassential’s designations surprising for certain cuisines? Let us know on our Instagram, Facebook, Twitter or LinkedIn pages!

Image: Jorge Zapata on Unsplash

by David Klemt David Klemt No Comments

How is Plant-based Performing?

How is Plant-based Performing On-premise?

by David Klemt

Plant-based food bowl

With plant-based food options making their way to global fast food chains, it’s clear the category is continuing to heat up.

In fact, it’s likely time to stop referring to plant-based menu items as a trend. Obviously, they’re here to stay.

But how are these items actually performing on-premise? Is the category experiencing real growth or barely noticeable?

“Proliferation”

We’re full throttle into the holiday season. People are focusing on spending time with family and friends.

And what does that mean? Gathering for meals.

So, if restaurant traffic is going to tick up, it makes sense to see if plant-based should be more prevalent on menus.

To that end, Datassential revealed data on this category two weeks ago during their “Holidays Ahead!” webinar. Of four trend-tracking designations—Inception, Adoption, Proliferation, Ubiquity—Datassential notes plant-based menu items are in the Proliferation stage on-premise.

Analyzing data from 2011 to 2021, Datassential showed that the category started growing in terms of menu placement in 2018. As of this year, plant-based items are on nearly five percent of restaurant menus.

That may not seem like impressive growth. However, there was zero-point-zero-percent growth between 2011 and 2014. In 2015 and 2016, Datassential shows that only 0.1 percent of restaurants offered plant-based menu items. That growth doubled in 2017 (0.2 percent), then doubled again in 2018 (0.4 percent).

In 2019, the category quadrupled to inclusion on 1.6 percent of restaurant menus. Last year, that growth more than doubled to 3.5 percent.

According to Datassential, 28 percent of consumers like or love plant-based menu items. Interestingly, the research agency finds that all types of consumers like plant-based items, not just vegetarians or vegans.

The Datassential breakdown of plant-based menu proliferation by restaurant category is as follows:

  • Fast Casual: 11.5%
  • Casual Dining: 5.4%
  • Midscale: 3.9%
  • Quick Service: 3.4%
  • Fine Dining: 1.8%

Chains are more likely, at this time, to feature plant-based menu items.

Upscale Options

Wanting to include plant-based options and knowing where to start are two different things.

As it happens, Datassential featured a timely real-world menu to that should inspire operators this season.

Watercourse Foods in Denver, Colorado, offers mains and sides that will resonate with holiday diners:

  • Seitan Roast (wheat, soy, blend of herbs) which stands in for roast turkey.
  • Pot Pie consisting of carrots, celery, onions and mushroom.
  • Root Vegetable Stuffing made with root veggies (obviously), savory herbs, and housemade bread.
  • Mac and Cheese featuring shells tossed in cheese fondue and topped with shiitake “bacon” bits and breadcrumbs.

As you’ll notice, you don’t need to limit your menu to products from Beyond or Impossible. Obviously, you can leverage their brand recognition but you can also utilize your current plant-based inventory to create housemade menu items.

If you’re ready to embrace plants at your restaurant or bar, activate your kitchen team. With a bit of creativity you can take advantage on the rise in popularity of everything plant-based.

Image: Hermes Rivera on Unsplash

Top