Restaurant sales

by David Klemt David Klemt No Comments

The Top 10 Restaurant Chains in 2023

Check Out the Top 10 Restaurant Chains by Sales in 2023

by David Klemt

Pop art image of a giant money bag wrapped in golden chains looming over a city skyline

Well, I asked for an image of a giant money bag wrapped in golden chains, looming over a city skyline. Nailed it, AI.

Technomic data reveal the top-performing restaurant chains in the United States of America by sales volume in 2023, and number one won’t be a surprise.

For a bit of context and history, Technomic has been ranking the top chain restaurants in the US since 1978. And, according to reporting, the same chain has held the number-one spot every year.

Feel free to take a moment and make your guess as to which chain continues to lead all others each year.

Alright, if you guessed McDonald’s, congratulations.

Not only is McDonald’s the largest chain in the US by sales, the company outperformed the rest of the list by a significant margin. In 2023, McDonald’s generated more than $53 billion in sales via more than 13,450 units.

That’s nearly $20 billion more in sales than the chain that clinches the number-two spot. Going deeper, that’s more than double the sales of the number-three restaurant chain. In fact, McDonald’s generated just a $100 million dollars less than the sales of the second- and third-biggest chains combined.

Coming in at number two is Starbucks, achieving sales of $31.6 billion in the US from 16,466 units. Number three is Chik-fil-A, seeing $21.6 billion in sales through 2,964 stores.

The Top 10 Chain Restaurants in the US

Below, the full list of the ten top-performing restaurant chains in the US.

Perhaps unsurprisingly, quick- and limited-service restaurants account for the entirety of the top-ten list.

Notably, each of the ten chains saw sales growth last year, though that growth fluctuates from chain to chain. Some, like Chipotle, increased sales by more than 15 percent. For others, like Subway, growth was just over two percent.

Further, just two of the top-ten chains shuttered locations in 2023. Last year, Burger King reduced its US footprint by almost four percent. Likewise, Subway shrunk by two percent.

Judging by the sales numbers, closing stores last year may have proven to be a smart business decision for Burger King and Subway.

  1. Domino’s: $9 billion (up 3.1 percent)
  2. Chipotle: $9.9 billion (up 15.3 percent)
  3. Subway: $10 billion (up 2.1 percent)
  4. Burger King: $11 billion (up 6.6 percent)
  5. Dunkin’: $11.9 billion (up 5.7 percent)
  6. Wendy’s: $12.3 billion (up 5.1 percent)
  7. Taco Bell: $15 billion (up 8.2 percent)
  8. Chik-fil-A: $21.6 billion (up 14.7 percent)
  9. Starbucks: $31.6 billion (up 12.5 percent)
  10. McDonald’s: $53.1 billion (up nine percent)

Ending on one more interesting revelation, one chain moved up the list. Bear in mind, this is no small feat.

Domino’s, once number nine on the list, was passed by Chipotle in sales last year. We’ll see if anything changes when Technomic reveals next year’s rankings.

Image: Shutterstock. Disclaimer: This image was generated by an Artificial Intelligence (AI) system.

KRG Hospitality Start-Up Restaurant Bar Hotel Consulting Consultant Solutions Plans Services

by David Klemt David Klemt No Comments

Indies: Which Cities Lead the Way?

Independents: Which Cities Lead the Way?

by David Klemt

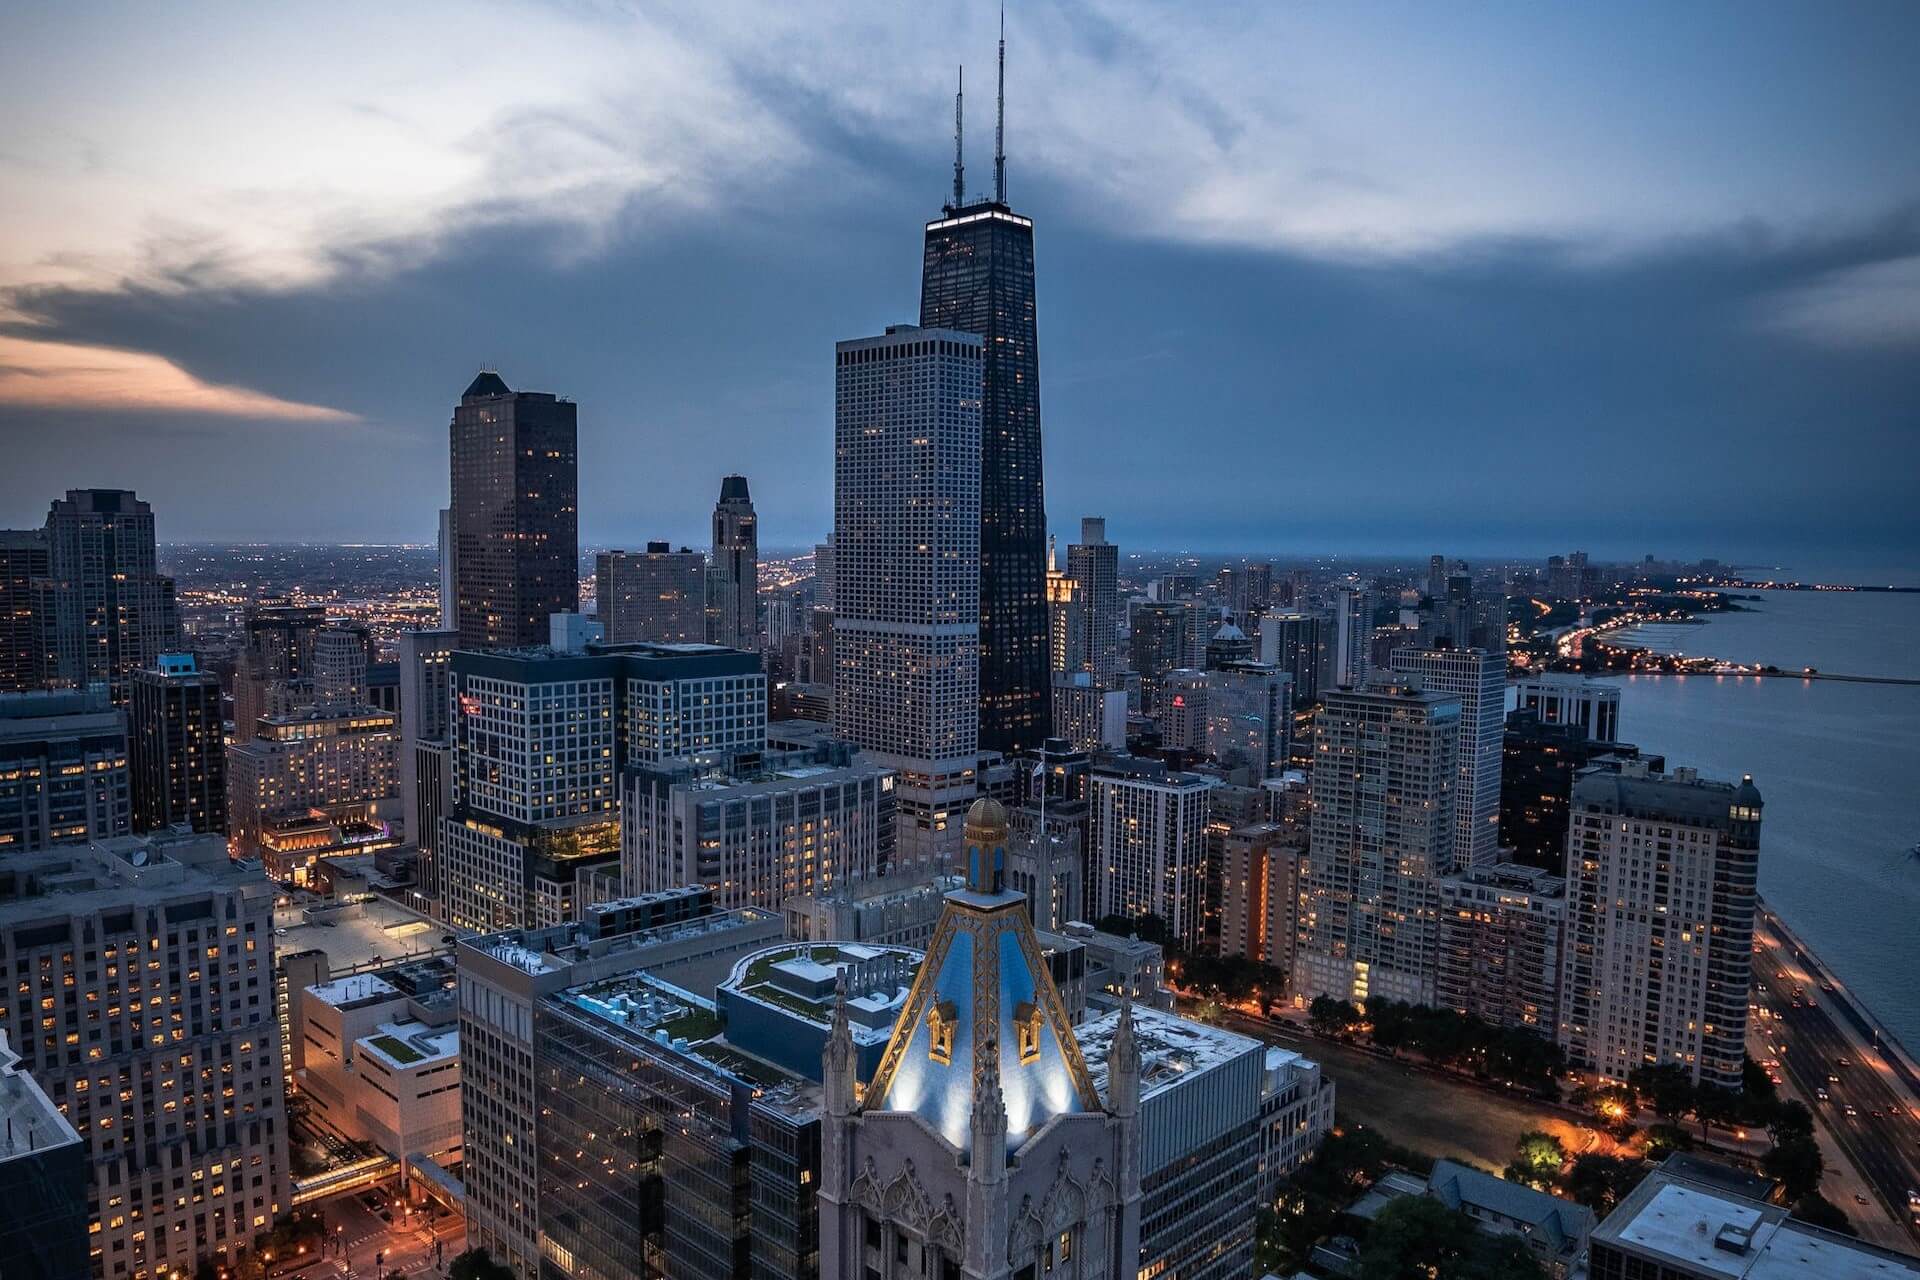
Aerial view of Chicago skyline and Lake Michigan coastline

The majority of the top ten indie restaurants on the Restaurant Business Top 100 Independents ranking are in two American cities.

Those two cities are Miami Beach, Florida, and Chicago, Illinois. While Miami Beach claims two spots among the top three, Chicago has the most restaurants in the top ten. However, the top three indies are all in Florida, with number two being the Boathouse in Orlando.

So, Florida and Illinois are home to nearly the entire top ten of Restaurant Business’ Top 100 Independents. That’s impressive.

What’s even more impressive is the combined annual sales figure of the top ten: $333.4 million. Now, let’s separate Miami Beach. The three indies in the Florida city generated nearly $114 million themselves. Chicago’s four indies among the top ten generated $118 million.

Taken together, the top 100 indies generated $1.95 billion.

All told, 14 of the top 100 indies as ranked by Restaurant Business are in Chicago. Five are in Miami Beach, and five are in Miami. Before I move on, no, Miami Beach and Miami aren’t the same city; they’re entirely separate municipalities. In total, 16 restaurants on this list are in Florida.

New York boasts 15 restaurants on the list. Four are in San Francisco, and just two are in Los Angeles. However, California claims 15 restaurants in total.

However, as you’ll see below, this Restaurant Business list consists of more than just the usual big cities.

Restaurant Business Top 100 Independents: The Top Ten

Below, the top ten independent restaurants, per Restaurant Business.

  1. Joe’s Stone Crab Restaurant (Miami Beach, Florida)
  2. The Boathouse (Orlando, Florida)
  3. Komodo Miami (Miami Beach, Florida)
  4. Maple & Ash Chicago (Chicago, Illinois)
  5. Mila (Miami Beach, Florida)
  6. Sierra Mar (Big Sur, California)
  7. Gibsons Bar & Steakhouse (Chicago, Illinois)
  8. Gibsons Italia (Chicago, Illinois)
  9. Alexxa’s (Las Vegas, Nevada)
  10. Alinea (Chicago, Illinois)

Alinea commands the highest average check among the top ten, at $650. The most reasonable is the Boathouse, averaging $45.

Interestinglyand perhaps logicallythese two restaurants find themselves in the inverse when it comes to annual meals served. The Boathouse serves the most: just over one million. And Alinea, among the top ten indies, serves the least: nearly 45,700.

Notably, when we move on to numbers 11 to 20, Las Vegas, Miami, and New York account for six restaurants.

However, it’s also notable that it’s not just the usual big cities with restaurants on this list. Smaller cities, such as Frankenmuth in Michigan, are home to some of America’s top-performing independent restaurants.

For some context, Frankenmuth has a population of less than 5,200 people. However, Michigan’s “Little Bavaria” draws three million tourists per year. So, it’s no surprise that Zehnder’s Restaurant generates more than $19 million in annual sales.

Restaurant Business Top 100 Independents: The Bottom Ten

Just for fun, let’s take a look at the bottom ten on the Restaurant Business list.

  1. Siena Tavern (Chicago, Illinois)
  2. Fleet Landing Restaurant & Bar (Charleston, South Carolina)
  3. Electric Lemon NY (New York, New York)
  4. Bar Siena (Chicago, Illinois)
  5. El Vez (Philadelphia, Pennsylvania)
  6. Mi Vida (Washington, DC)
  7. Scoma’s Restaurant (San Francisco, California)
  8. Mexican Sugar (Las Colinas, Texas)
  9. The Shed Barbecue & Blues Joint (Ocean Springs, Mississippi)
  10. Chef Adrianne’s Vineyard Restaurant and Bar (Miami, Florida)

Adding context, these ten restaurants have generated $114.6 million in annual sales. That’s roughly the same amount of annual sales as the three restaurants in Miami Beach in the top ten.

Each of the “bottom” ten has annual sales ranging from $11.2 million to $11.9 million.

Takeaway

We all know the following axiom: “Location, location, location.”

It’s tempting to assume this means a business must be in a major city. That’s a woeful oversimplification. Myriad considerations must be made when looking at a market, whether the population is in the hundreds or millions. Assuming a concept will drive traffic and generate millions of dollars solely because it’s in a major city is foolish.

Let’s take another look at Zehnder’s in Frankenmuth. The restaurant, number 47 on the list, generated $19.2 million in annual sales. Moreover, it’s in a town with a population under 5,200.

Number 46 generated $19.3 million and is in (on?) Waimea in Hawaii. Number 48 boasted annual sales of $19 million and is in a city with a population of almost 2.7 million: Chicago.

Clearly, tourism a key contributing factor to the success of Zehnder’s. Not population, not the demographics of the permanent residents, not big-city status.

So, what about check average? Alinea, number ten, has the highest at $650 and generated $28.3 million in sales. However, the Spot, number 85, has an average check of $18 and generated $12.3 million.

The success of any restaurant, bar, nightlife or eatertainment concept doesn’t come down to a single element. What sets a concept apart is a deep understanding of a specific market, the surrounding markets, “sister” sites and competitors, guest desires and expectations, and so much more.

How does an operator come to understand their operation and their market? A feasibility study to start. Then comes a thorough, coherent concept plan and a complete business plan, and an obsession with data.

Operators who put in the work to attain strategic clarity have the potential to earn their way onto the Top 100 Independents list.

Image: Cameron Casey on Pexels

Bar Pub Brewery Nightclub Club Nightlife Business Plan

by David Klemt David Klemt No Comments

Fantasy Sports, Sports Betting on the Rise

Interest in Sports Betting and Fantasy Sports Grows

by David Klemt

Wall full of American footballs behind large NFL logo

A recent CGA by NIQ On Premise Impact Report for August, 2023 reveals an interesting insight into consumer behavior and expectations.

To be clear, all the data on this new one-pager is useful. However, a particular revelation stands out from the rest, for me.

The CGA by NIQ US On Premise Impact Report for August 24, 2023 addresses:

  • total on-premise sales;
  • dining versus drinking occasions;
  • cost of living impact in the past month; and
  • consumer interest in fantasy sports and sports betting.

It’s that final bullet point that I find compelling. However, let’s check out the numbers for the first three points before we jump into sports.

To download your own copy, please click here.

August by the Numbers

In comparison to August 20, 2022, check value is up one percent to $50.09. Ticket count, however, is down one percent to 1,569.

As one would expect, dining occasions outweigh drinking occasions. Seventy percent of consumers have dined out in a restaurant or bar in the past two weeks.

Compared to July 2o23, that’s a two-percent increase in dining traffic.

Over the course of the same amount of time, 40 percent of consumers have gone drinking in a bar or restaurant. That’s a decrease of one percent in comparison to July 2023.

Considering that many families travel in the month of August before kids head back to school (or to drop them off at university), these numbers make sense.

Of course, cost of living may also be impacting dining and drinking occasion. Most consumers report no changes to the frequency with which they go out for drinks. Some consumers even report going out more frequently for drinks. But some are also cutting back.

For example, 28 percent of consumers have decreased how often they go out for drinks. Eleven percent are consuming lower quality drinks when they do go out, and nine percent are decreasing the “quality” of the establishments they visit.

That said, 20 percent of consumers are increasing drink quality and 21 percent are increasing establishment quality per visit. Seventeen percent are increasing how often they go out for drinks.

Fantasy Sports & Betting

This, as you may have guessed, is the statistic that I find most compelling.

Fantasy sports and sports betting has been on the rise for some time in the US. Who among us isn’t the target of sports-betting-app ads when streaming or watching sports?

Sports bar operators and operators who can position themselves as sports fans’ “third spot” will find this next number interesting.

According to CGA by NIQ’s latest report, 63 percent of consumers revealed they had plans for NFL week one. Those plans included participating in daily fantasy sports or sports betting.

So, it would be wise for operators who will air NFL games this season to ensure they’re catering to fantasy football and sports betting fans. Becoming the hub for fantasy sports groups in your area can increase traffic, sales, and loyalty. And, of course, it opens up the door to many traffic- and revenue-generating sport- and team-themed LTOs.

Again, to download this new report for yourself, please click here.

Image: Adrian Curiel on Unsplash

KRG Hospitality. Gaming. Entertainment. Consultant. Food Service. Bowling Alley. Golf. Simulator. Arcades. Eatertainment.

Top