Notice: Function _load_textdomain_just_in_time was called incorrectly. Translation loading for the smart-post-show-pro domain was triggered too early. This is usually an indicator for some code in the plugin or theme running too early. Translations should be loaded at the init action or later. Please see Debugging in WordPress for more information. (This message was added in version 6.7.0.) in /var/www/wp-includes/functions.php on line 6114
Study | KRG Hospitality - Part 2

Study

by David Klemt David Klemt No Comments

2023 State of the Menu: Datassential

2023 State of the Menu: Datassential

by David Klemt
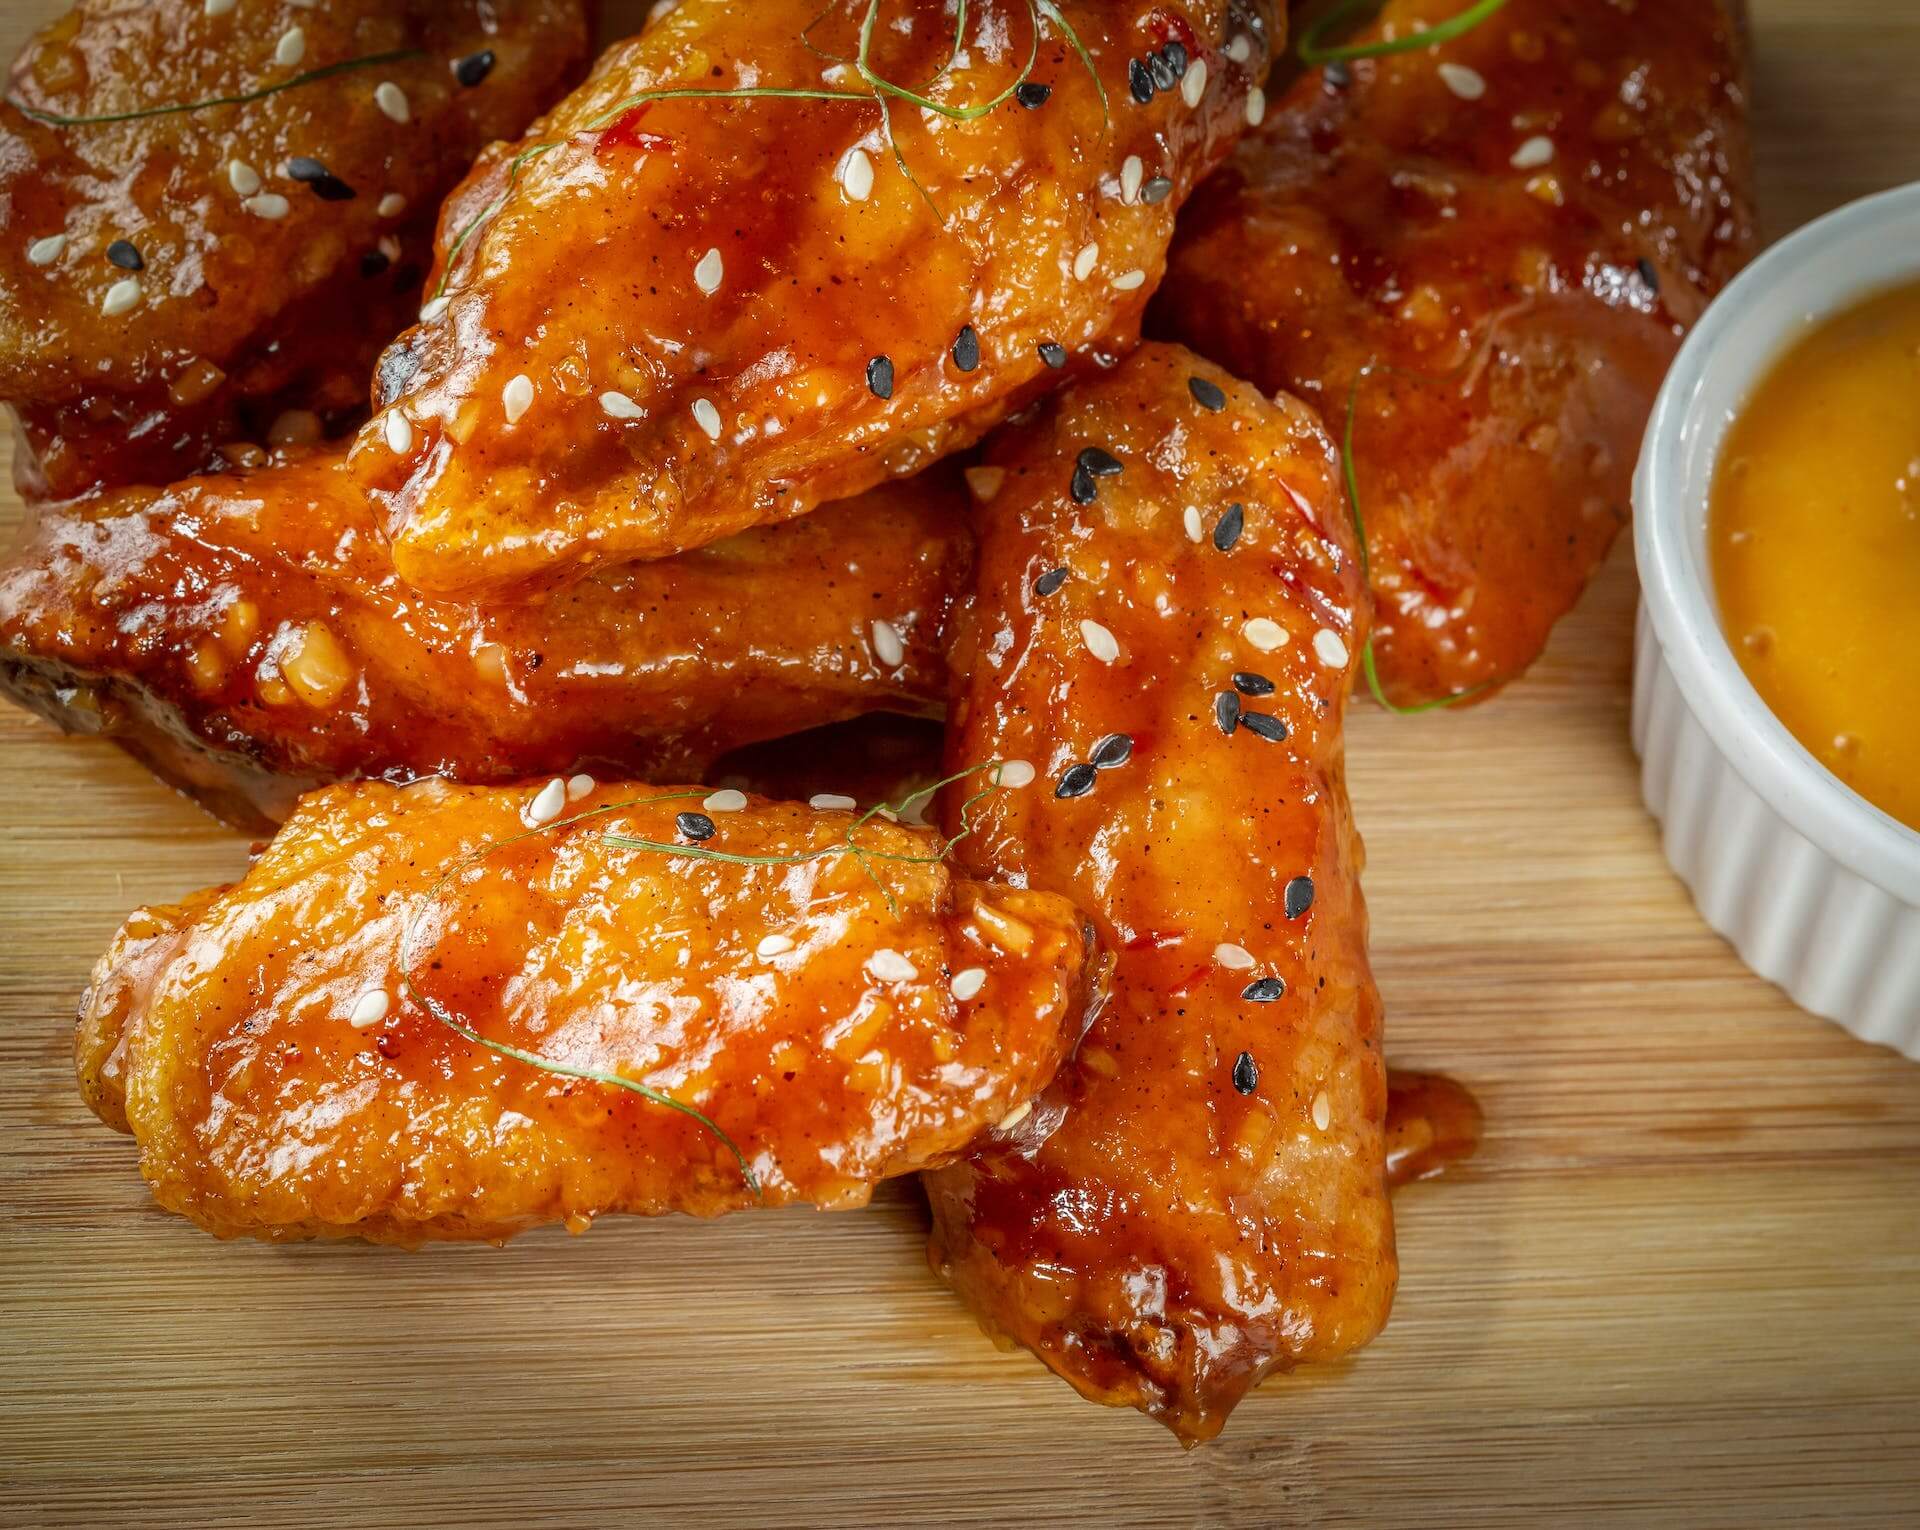
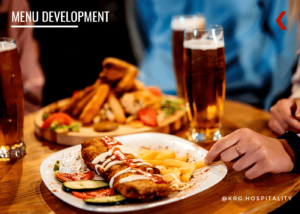
Korean fried chicken wings

The annual 2023 State of the Menu by Datassential includes an interesting metric to gauge restaurant recovery: menu size by segment.

Hosts Jack Li, Mike Kostyo, and Claire Conaghan discuss a handful of topics during this webinar. Host Li touches on food-forward cities at the beginning of this presentaiton. Kostyo shares some of the most innovative menu items out there right now. And Conaghan dives deep into menu trends.

Industry professionals interested in watching this webinar on demand can register to do so here.

There are a handful of metrics people are using to measure post-pandemic restaurant recovery. Labor is, of course, receiving a lot of attention. People are also tracking traffic, average check size, revenue, and profits.

One metric Datassential is keeping tabs on is menu size per restaurant segment. Additionally, they’re tracking each segment’s top-growing food and beverage items.

Notably, however, in tracking menu size, Conaghan focuses solely on food and non-alcohol beverage items, omitting catering and alcohol.

Chains vs. Independents

Starting things off, Conaghan addresses the overall menu size trend. That is, menus are noticeably smaller in comparison to pre-pandemic sizes.

Interestingly, chain restaurants don’t appear to be in any rush to move away from this trend. In fact, Conaghan notes that chains appear to be further reducing the size of their menus. This has been the trend over the past 12 months.

According to Conaghan, fine dining also seems to be happy to shrink their menus. Menu size shrunk the most among restaurants in this segment. In comparison, quick-service menu sizes decreased the least.

However, independent restaurant operators appear to be going in the opposite direction from their chain counterparts. In contrast, indies have been growing the size of their menus the past 12 months.

Menu Size by Segment

Fast Casual

Per Conaghan, the only segment to reach pre-pandemic menu size is fast casual. In fact, this category of restaurant is often exceeding pre-pandemic items-per-menu size.

This increase in menu size is attributable to operators “leaning into” core cuisine items. For example, sandwiches, Mexican entrees, and pizza.

However, the fastest-growing food item on fast-casual menus is the chicken wing. According to Conaghan, it’s easy for operators to innovate with chicken wings.

A restaurant doesn’t have chicken wings? All they have to do is add them, starting with simple preparations. If a restaurant does have chicken wings on the menu already, innovation is as simple as adding new flavors.

As far as the fastest-growing drink for fast-casual restaurants, it’s dessert beverages.

QSR, Casual Dining, and Midscale

These three segments are “very, very close” to reaching pre-pandemic menu sizes.

As midscale operators are likely very aware, this segment tends to have the largest menus. I wouldn’t be surprised, therefore, if a number of midscale concepts review their items per menu, their costs, and decide they can perform well with slightly smaller menus moving forward.

Unsurprisingly, chicken wings are the food item growing most quickly on QSR food menus. Oh, and barbecue chicken wings are the fastest-growing food item among casual dining restaurants.

Perhaps a bit more eyebrow-raising is the fastest-growing beverage type for QSRs: energy drinks. Boba and flavored iced teas are growing fastest on casual-dining drink menus.

For midscale restaurants, dessert samplers are the fastest-growing food items. Think “dessert charcuterie” when trying to picture a dessert platter. Another way to think about the dessert sampler is a static dessert cart with small bites of each dessert on the menu.

Fine Dining

Again, this segment is the furthest from pre-pandemic menu size. And, again, operators in this category seem happy with this trend.

An interesting note Conaghan makes about this segment is what many operators are using to fill out their menus: desserts. This is, she says, an area where fine dining can differentiate itself from other concepts.

Per Conaghan, bao, applesauce, and summer squash are growing the fastest on fine-dining food menus.

Now, I may have slipped into a fever dream during this portion of the Datassential webinar. Because unless I’m mistaken, the Shirley Temple has been identified as the fastest-growing beverage in the fine-dining space.

Pricing

Okay, so this segment of the 2023 State of the Menu webinar isn’t really a recovery metric.

However, it’s interesting, and something Jack Li says about chain restaurant pricing made me chuckle.

Most Expensive vs. Least Expensive

First, some straightforward data.

The following list identifies the five most-expensive ZIP codes for chain restaurant menu pricing. Anyone who wants the full list of 15 most-expensive ZIP codes can watch the webinar.

  • 10036 (New York, NY)
  • 96707 (Kapolei, HI)
  • 98902 (Yakima, WA)
  • 96815 (Honolulu, HI)
  • 99503 (Anchorage, AK)

It’s understandable to think this would consist entirely of New York City, Los Angeles, or San Francisco ZIPs. But when we consider what it costs operators to import food to Hawaii and Alaska. Additionally, Washington and New York are among the states with the highest minimum wage. Operators need to recover those costs somehow.

And now the five least-expensive ZIP codes:

  • 78526 (Brownsville, TX)
  • 75224 (Dallas, TX)
  • 76106 (Fort Worth, TX)
  • 31907 (Columbus, GA)
  • 31701 (Albany, GA)

Pricing Logic

Now, on to what Li says during the webinar that makes me laugh.

Nationwide, the average price of a McDonald’s Big Mac in the US is $5.26. (A caveat: This webinar took place in October. This price may have increased or decreased by now.)

However, the lowest price for a Big Mac is $3.49 at a location in Wilburton, Oklahoma.

So, what’s the highest price, and where can one find these pricey Big Macs? Three McDonald’s locations sell the burger for $8.29. That’s nearly two-and-a-half times the lowest-priced Big Mac.

Summarizing pricing variations among chain restaurants succinctly, Li made me laugh with the following: “Store pricing often just doesn’t make sense.”

Going further, Li says Datassential shows that the more franchised a restaurant chain is, the more variances in pricing will occur.

The full webinar can be viewed here.

Image: Leonardo Luz on Pexels

Bar Nightclub Pub Brewery Menu Development Drinks Food

by David Klemt David Klemt No Comments

Wallethub Ranks Best Foodie Cities in US

Wallethub Ranks America’s Best Foodie Cities

by David Klemt

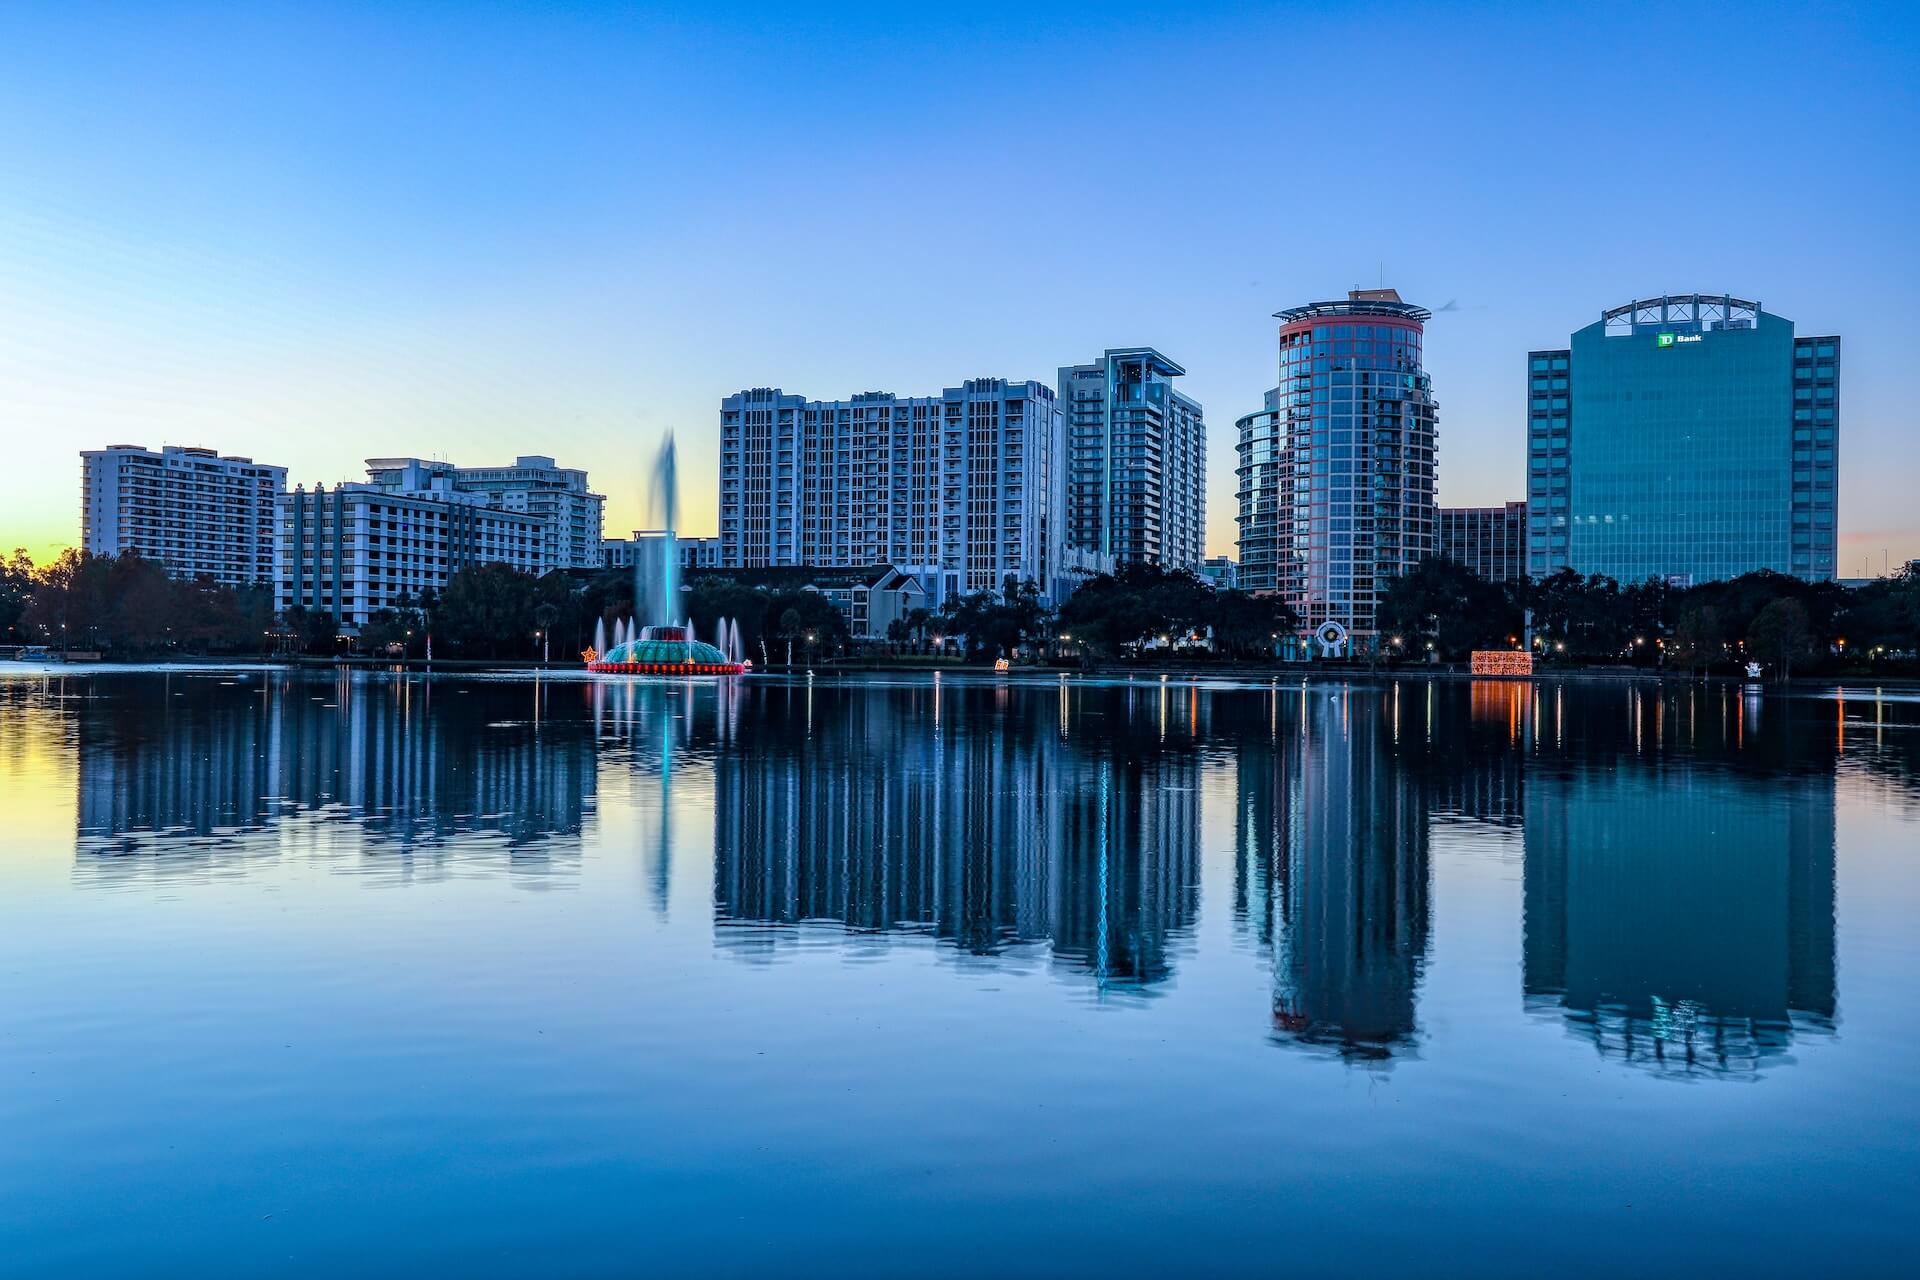
Eola Lake Park in Orlando, Florida

Comparing 182 cities across more than two dozen “food-friendliness” indicators, Wallethub has revealed their rankings for America’s best foodie cities in 2023.

Why 182 cities? Wallethub started with 150 of America’s most-populous cities. Then, they added “at least two” of the most-populous cities in each state.

Regarding the ranking itself, Wallethub compared the cities against two key measures: affordability, and diversity, accessibility, and quality. Those two measures consist of 28 key indicators, including:

  • cost of groceries;
  • restaurant meal cost;
  • sales tax;
  • food tax;
  • restaurants per capita;
  • ratio of full-service to fast-food restaurants; and
  • restaurant diversity.

Using a 100-point grading system, affordability was worth up to 30 points. Simple math shows diversity, accessibility, and quality indicators were worth up to 70 points.

Further, Wallethub valued indicators anywhere from half-weight (international grocery stores per capita) to triple weight (restaurants per capita).

Now, it’s important to contextualize Wallethub’s use of the word “foodie city” here. For their ranking, the company is identifying “the best and cheapest” cities for consumers for whom eating is an experience, hobby, and/or lifestyle.

“These wallet-friendly cities cater to diners who prefer to cook at home, explore the local flavors or both,” reads their post, which can be reviewed in its entirety here.

The Top 25

So, per Wallethub, the cities below are the top 25 among the 182 “best foodie cities in America in 2023.”

  1. Orlando, Florida
  2. Portland, Orgeon
  3. Sacramento, California
  4. Miami, Florida
  5. San Francisco, California
  6. Tampa, Florida
  7. San Diego, California
  8. Las Vegas, Nevada
  9. Austin, Texas
  10. Seattle, Washington
  11. Denver, Colorado
  12. Atlanta, Georgia
  13. Los Angeles, California
  14. Chicago, Illinois
  15. Richmond, Virginia
  16. Pittsburgh, Pennsylvania
  17. Washington, DC
  18. St. Louis, Missouri
  19. Houston, Texas
  20. New York, New York
  21. Oakland, California
  22. Phoenix, Arizona
  23. Santa Ana, California
  24. Grand Rapids, Michigan
  25. Cincinnati, Ohio

Interestingly, you’ll find the “usual” foodie scene suspects on this list. However, a mere handful of those cities are ranked in the top ten: Miami, San Francisco, and Las Vegas.

Chicago (14), Los Angeles (13), and New York (20) don’t make the three or five. In fact, they’re out of the top ten entirely here.

If affordability is a major factor here, it raises an eyebrow that Miami is among the top five foodie cities. After all, sources show the cost of living in the city is 20 percent higher than the national average. The cost of living in San Francisco is nearly 80 percent higher.

At any rate, Orlando, per Wallethub’s methodology, is the number-one foodie city in America.

Compelling Comparisons

With the top 25 foodie cities out of the way, let’s check out a few other interesting comparisons.

Cost of Groceries

Lowest-cost cities, in descending order:

  1. Brownsville, Texas
  2. Corpus Christi, Texas
  3. Laredo, Texas
  4. Fayetteville, North Carolina
  5. Austin, Texas

The cities with the highest cost of groceries are Honolulu and Pearl City in Hawaii.

Restaurants per Capita

The cities with the most restaurants per capita, again in descending order:

  1. Miami, Florida
  2. Orlando, Florida
  3. Las Vegas, Nevada
  4. San Francisco, California
  5. Los Angeles, California

It’s important to note each of the cities on this list is, per Wallethub, tied for first place.

The city with the fewest restaurants per capita is Pearl City, Hawaii.

Ratio, FSR to Fast Food Restaurants

On this list, the five cities with the highest ratio of full-service restaurants to their fast-food counterparts (yes, in descending order):

  1. Cape Coral, Florida
  2. Santa Rosa, California
  3. Portland, Maine
  4. Burlington and South Burlington, Vermont

That leaves the city with the lowest ration, which is Jackson, Mississippi.

The Bottom Ten

Now that we know which cities Wallethub identifies the best foodie cities in the US, let’s take a look at the bottom of their list.

  1. Augusta, Georgia
  2. Fontana, California
  3. Jackson, Mississippi
  4. Moreno Valley, California
  5. Mobile, Alabama
  6. Montgomery, Alabama
  7. West Valley City, Utah
  8. Nampa, Idaho
  9. Shreveport, Louisiana
  10. Pearl City, Hawaii

Personally, I find the data regarding restaurants per capita and the FSR to fast-food ratio the most useful.

To review this report in its entirety, including Wallethub’s methodology, please click here.

Image: Mick Haupt on Unsplash

Bar Pub Brewery Nightclub Club Nightlife Concept Development

by David Klemt David Klemt No Comments

2023 Cravings Report: “The Most” Orders

2023 Uber Eats Cravings Report: “The Most…” Orders

by David Klemt

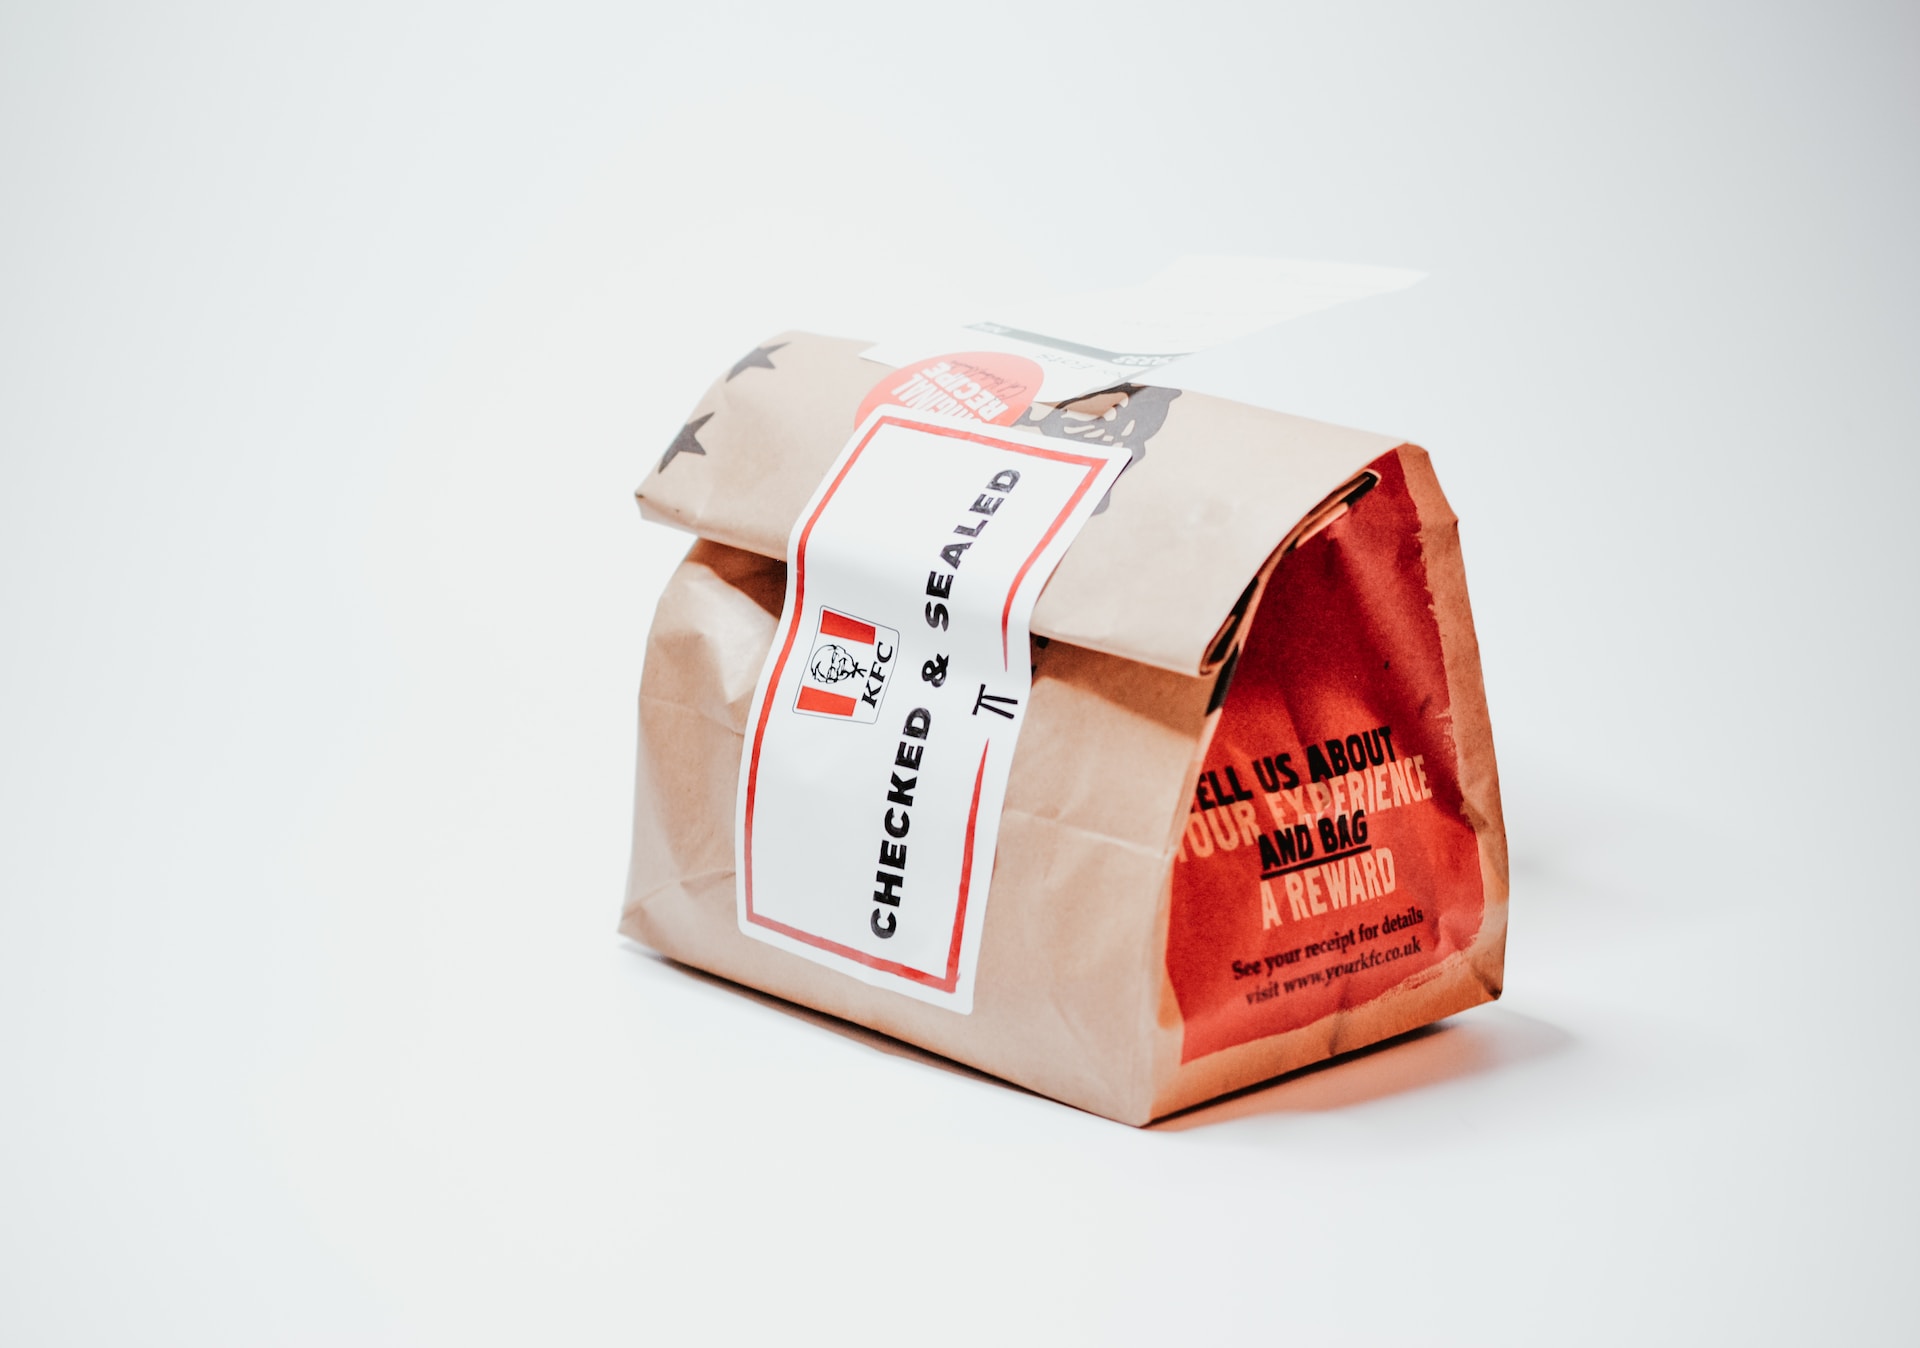
Kentucky Fried Chicken packaged for delivery or pickup

Let’s take a look at the top orders, delivery requests, order combinations, surprising pairings, and more from the 2023 Uber Eats Cravings Report.

It appears that the chicken sandwich dominance we’ve seen over the years is winding down. At least, that seems to be the case among Uber Eats users.

As you’ll see below, not only is the chicken sandwich not the most popular item, it’s not even among the top five. It does edge out the cheeseburger and wings among the most popular combos, but it doesn’t outperform French fries and salt as a combo.

Another eyebrow-raising detail? Pizza doesn’t show up anywhere among the most ordered items, most popular combos, or even the most surprising combos.

Now, if you’re curious about the 2022 Uber Eats Cravings Report, you’re in luck. You can click here for the top food orders from that report, and here for the top beverage orders.

The Most…Ordered Items

  • French fries
  • Garlic naan
  • Pad Thai
  • Miso soup
  • California roll

Am I the only one who expected to see burgers, chicken sandwiches, and pizza on this list?

The Most…Popular Combos

  1. Burrito bowl + cheese
  2. French fries + salt
  3. Chicken sandwich + shredded lettuce
  4. Cheeseburger + mustard
  5. Wings + ranch

Fairly standard, really. Every one of these orders makes complete sense. Now, the category coming up next…it’s a different story.

However, before we move on, let’s compare these items to those found on the 2022 Uber Eats Cravings Report.

Interestingly, the number-one item is nearly identical: burrito + cheese. And French fries + salt is the second most-popular item on both lists.

The Most…Surprising Combos

  1. Steak + jelly
  2. Cottage cheese + mustard
  3. Condensed milk + avocado
  4. Seaweed + pasta sauce
  5. Butter + pickled onions

I really have nothing to say after reviewing this short list. I mean…hey, do your thing, everyone. Make your order yours.

To the operators out there, be ready for some odd order combos.

The Most…Popular Requests

  1. No onions
  2. Dressing on the side
  3. Ranch
  4. Extra soy sauce
  5. Spicy
  6. Sauce on the side
  7. No lettuce
  8. No jalapenos
  9. Extra gravy
  10. No slaw

Looking at the top request, Uber Eats has a theory as to what’s driving it: the return to the office.

People, it appears, are self-conscious about their breath in an in-person, face-to-face setting.

The Most…Popular Food and Alcohol Combos

  1. Ribeye + Vodka
  2. Cheeseburger + Frozen Margarita
  3. Chicken + Frozen Piña Colada
  4. Lobster tail + Apple whiskey
  5. Tamales + Daiquiris

Last year’s report reveals the following combos:

  1. Steak + Margaritas
  2. Pizza + White Claw
  3. Burritos + Margaritas
  4. Chicken + Sangria
  5. Wings + Beer

Overall, a lot of change from the 2022 Cravings Report to this year’s report.

Image: Nik on Unsplash

Bar Nightclub Pub Brewery Menu Development Drinks Food

by David Klemt David Klemt No Comments

Indies in the US & Canada: The Numbers

Independents in the US & Canada: The Numbers

by David Klemt

Canadian and America flags flying together

Operators who wonder how many independent restaurants there are throughout America and Canada finally have their answer thanks to Datassential.

The well-known food and beverage research and intelligence platform’s recent infographic reveals the state of indies in both countries.

For the purposes of their infographic, Datassential splits restaurants into two overarching categories. One major category is full-service restaurants, the other is limited-service.

From there, the platform organizes restaurants into five segments: casual, QSR, midscale, fast casual, and fine dining.

To my understanding, QSR and fast casual fall under Datassential’s limited-service designation. Casual, midscale, and fine dining are full-service restaurants.

To review the infographic yourself, please click here.

Number of Indie Restaurants: America

According to Datassential, there are 483,885 independent restaurants in the US.

Of those restaurants, 57 percent are full-service. It follows, then, that 43 percent are limited-service.

Close to half—44 percent—of full-service restaurants in the US boast more than five years of being open. Just a quarter of limited-service restaurants (26 percent) can claim the same.

This does, anecdotally, make some sense. QSRs and fast-casual brands have been on the rise over the past couple of years. In fact, some casual chains are developing and launching QSR brands off the strength of the category.

Finally, 21 percent of full-service restaurants in the US see annual sales under $500,000. That number climbs to 27 percent for limited-service restaurants.

Now, let’s take a look at independent restaurants in Canada.

Number of Indie Restaurants: Canada

Per Datassential, there are a total of 59,914 independent restaurants throughout Canada.

The split between full-service restaurants and limited-service restaurants is just about even. Fifty-one percent of indie restaurants in Canada are full-service. Forty-nine percent are limited-service operations.

A little under 40 percent of full-service independent restaurants in Canada (36 percent) can say they’ve been operating for more than five years. That number is 28 percent for limited-service restaurants.

Interestingly, just five percent of independent full-service restaurants in Canada bring in less than $500,000 in sales annually. That number jumps to 34 percent when we look at the limited-service category.

Indie Restaurants by Segment

The breakdown of the five Datassential independent restaurant categories is the same for America and Canada.

Most independent restaurants in either country are casual. Following, in descending order of number of restaurants, are QSR, midscale, fast casual, and fine dining.

For America, the numbers are as follows:

  • Casual: 37 percent
  • QSR: 34 percent
  • Midscale: 19 percent
  • Fast casual: 9 percent
  • Fine dining: 1 percent

And for Canada the breakdown is nearly identical:

  • Casual: 37 percent
  • QSR: 30 percent
  • Midscale: 18 percent
  • Fast casual: 14 percent
  • Fine dining: 1 percent

There are eight times as many independent restaurants in America as there are in Canada. But as you can see, the industry segmentation by country is nearly the same.

Future independent operators can look at this information a few different ways. They can choose to join the most popular segments and differentiate themselves from the competition. They can look for and fill a need for an indie fast-casual or fine-dining concept. Or they can shoot for the middle and go midscale, a segment that’s gaining traction across several hospitality industry sectors.

For you own copy of Datassential’s infographic, follow this link.

Image: chris robert on Unsplash

KRG Hospitality. Restaurant Business Plan. Feasibility Study. Concept. Branding. Consultant. Start-Up.

by David Klemt David Klemt No Comments

Fantasy Sports, Sports Betting on the Rise

Interest in Sports Betting and Fantasy Sports Grows

by David Klemt

Wall full of American footballs behind large NFL logo

A recent CGA by NIQ On Premise Impact Report for August, 2023 reveals an interesting insight into consumer behavior and expectations.

To be clear, all the data on this new one-pager is useful. However, a particular revelation stands out from the rest, for me.

The CGA by NIQ US On Premise Impact Report for August 24, 2023 addresses:

  • total on-premise sales;
  • dining versus drinking occasions;
  • cost of living impact in the past month; and
  • consumer interest in fantasy sports and sports betting.

It’s that final bullet point that I find compelling. However, let’s check out the numbers for the first three points before we jump into sports.

To download your own copy, please click here.

August by the Numbers

In comparison to August 20, 2022, check value is up one percent to $50.09. Ticket count, however, is down one percent to 1,569.

As one would expect, dining occasions outweigh drinking occasions. Seventy percent of consumers have dined out in a restaurant or bar in the past two weeks.

Compared to July 2o23, that’s a two-percent increase in dining traffic.

Over the course of the same amount of time, 40 percent of consumers have gone drinking in a bar or restaurant. That’s a decrease of one percent in comparison to July 2023.

Considering that many families travel in the month of August before kids head back to school (or to drop them off at university), these numbers make sense.

Of course, cost of living may also be impacting dining and drinking occasion. Most consumers report no changes to the frequency with which they go out for drinks. Some consumers even report going out more frequently for drinks. But some are also cutting back.

For example, 28 percent of consumers have decreased how often they go out for drinks. Eleven percent are consuming lower quality drinks when they do go out, and nine percent are decreasing the “quality” of the establishments they visit.

That said, 20 percent of consumers are increasing drink quality and 21 percent are increasing establishment quality per visit. Seventeen percent are increasing how often they go out for drinks.

Fantasy Sports & Betting

This, as you may have guessed, is the statistic that I find most compelling.

Fantasy sports and sports betting has been on the rise for some time in the US. Who among us isn’t the target of sports-betting-app ads when streaming or watching sports?

Sports bar operators and operators who can position themselves as sports fans’ “third spot” will find this next number interesting.

According to CGA by NIQ’s latest report, 63 percent of consumers revealed they had plans for NFL week one. Those plans included participating in daily fantasy sports or sports betting.

So, it would be wise for operators who will air NFL games this season to ensure they’re catering to fantasy football and sports betting fans. Becoming the hub for fantasy sports groups in your area can increase traffic, sales, and loyalty. And, of course, it opens up the door to many traffic- and revenue-generating sport- and team-themed LTOs.

Again, to download this new report for yourself, please click here.

Image: Adrian Curiel on Unsplash

KRG Hospitality. Gaming. Entertainment. Consultant. Food Service. Bowling Alley. Golf. Simulator. Arcades. Eatertainment.

by David Klemt David Klemt No Comments

Top-performing Menu Items in the US

Top-performing Menu Items in the US (So Far)

by David Klemt

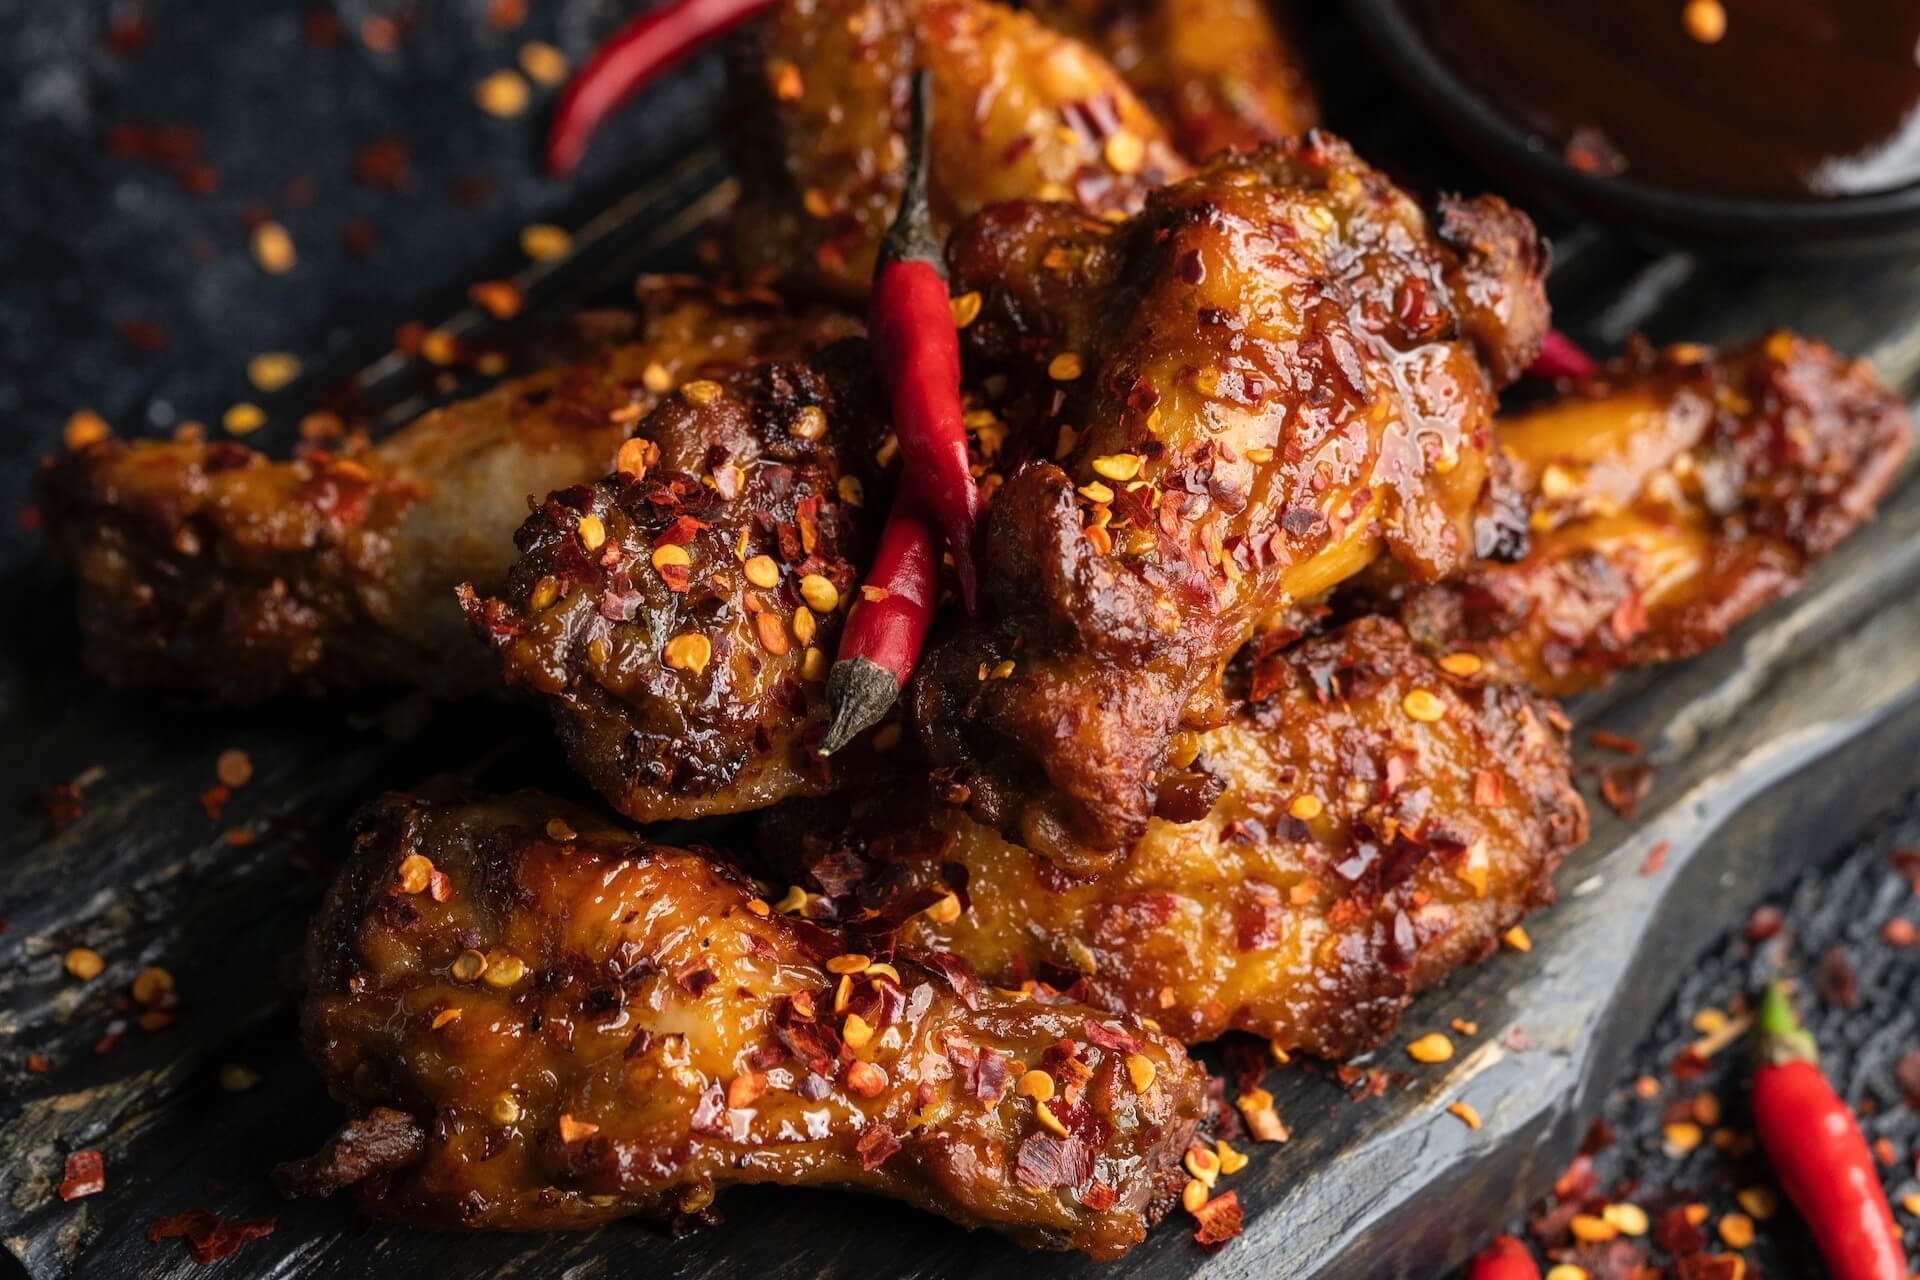
Barbecue chicken wings, chili peppers, and chili flakes

Thanks to a recent mid-year report from F&B intelligence platform Datassential, we now know the top-performing menu items in the US.

For the low, low price of filling out a handful of fields, you can download a copy of Datassential’s “Foodbytes: 2023 Midyear Trend Report” for yourself.

There’s plenty of useful data packed into this short report. You may find some of the top food items a bit surprising.

But First…

Datassential does more than just list the top mid-year menu performers in their latest report. There are also a couple of interesting datapoints for operators to consider.

The first piece of information is an alarming statistic: 54 percent of consumers are of the belief that “tipping culture has gotten out of control.”

As we’ve reported earlier, it’s likely that a major driver of “tip fatigue” comes from retail. The expectation for consumers to tip at a restaurant, bar or nightclub is ingrained deeply in American culture.

However, consumers throughout America are being prompted to tip after just about every transaction they’re attempting to complete. In fact, it’s not just retail that has been encouraging (in some cases, guilting) people to tip. Some contractors are also adding tip lines when handing over tablets to clients so they can pay their invoices.

One result is that servers and bartenders are reporting lower tips; guests are so over tipping that they’re pushing back against the practice in venues where they’d traditionally have no problem doing so.

Of course, tip fatigue isn’t the only reason consumers are pushing back against tipping. Many people feel that operators should increase what they pay staff. Indeed, some people feel that operators are asking them to subsidize their employee pay. Whether they’d be happy to pay higher prices remains to be seen.

Fads Aren’t Bad?

Whenever we cover trends or discuss them with clients, we caution against chasing too many (or the “wrong” trends). And fads? It can be even riskier to hop on the bandwagon of something that may never even reach the trend stage of its lifecycle.

However, likely due to the ubiquity of TikTok, consumers expect restaurants to embrace fads. According to Datassential, 67 percent of consumers overall “want to see more fads at restaurants and retail.”

That number jumps to 74 percent when focusing on Millennials and Gen Z.

So, while we still caution operators about jumping on fads (or “micro trends”) and trends, that doesn’t mean be too cautious. If a fad or trend works with your brand and won’t cost much to feature, at least give it consideration.

Not sure you’re great at identifying fads that will work for your business? Ask your staff which fads and trends are hot at the moment.

Speaking of Hot…

Alright, let’s take a look at the F&B items Datassential identifies as popular at the midway point of 2023.

Again, I encourage you to download the report in its entirety. You can do just that by clicking here.

But for those who want instant gratification, check out these menu items:

  • Super Duper: Let’s kick things off with the hottest chain LTO, the Denny’s Super Slam. Per Datassential, restaurant chains have already featured in excess of 2,000 LTOs in 2023. The F&B intel agency tests them all, and the Super Slam is wearing the LTO crown at the moment.
  • Chef Chatbot: Datassential tapped ChatGPT to create a burger recipe and had Midjourney create an image for the resulting Caprese Avocado Burger. More than half of consumers surveyed—57 percent—want to try it at a restaurant.
  • Big Winner: Datassential asked consumers a simple question: Which would you rather eat for the rest of your life, a hamburger or a hot dog? A staggering 87 percent chose hamburgers, meaning just 13 percent of consumers would choose a hot dog over it’s burger buddy.
  • What a Pickle: Back in March we checked out Slice’s Slice of the Union report, and it predicted pickle pizzas would be a hot trend this year. Well, Datassential has crunched the numbers and says 40 percent of consumers are aware of this pizza style already. Looks like Slice may be proven right by the end of the year.
  • Speed Demon: Curious about the fastest-growing menu item on the US? Well, wonder no more: Datassential says it’s the barbecue chicken wing. Over the past year, they’ve grown 373 percent on menus across the States. Datassential posits the overall growth of chicken and the embracing of flavor trends like Carolina gold barbecue sauce are contributing factors.

There’s a lot to unpack here, so I’ll leave you to it. Just remember that when it comes to fads and trends, there’s a fine line between what’s hot, what’s not, and jumping on the wrong one. Good luck!

Image: Ahmed Bhutta on Pexels

KRG Hospitality Start-Up Restaurant Bar Hotel Consulting Consultant Solutions Plans Services

by David Klemt David Klemt No Comments

Do Super Bowl Ads Work on Consumers?

Do Super Bowl Ads Work on Consumers?

by David Klemt

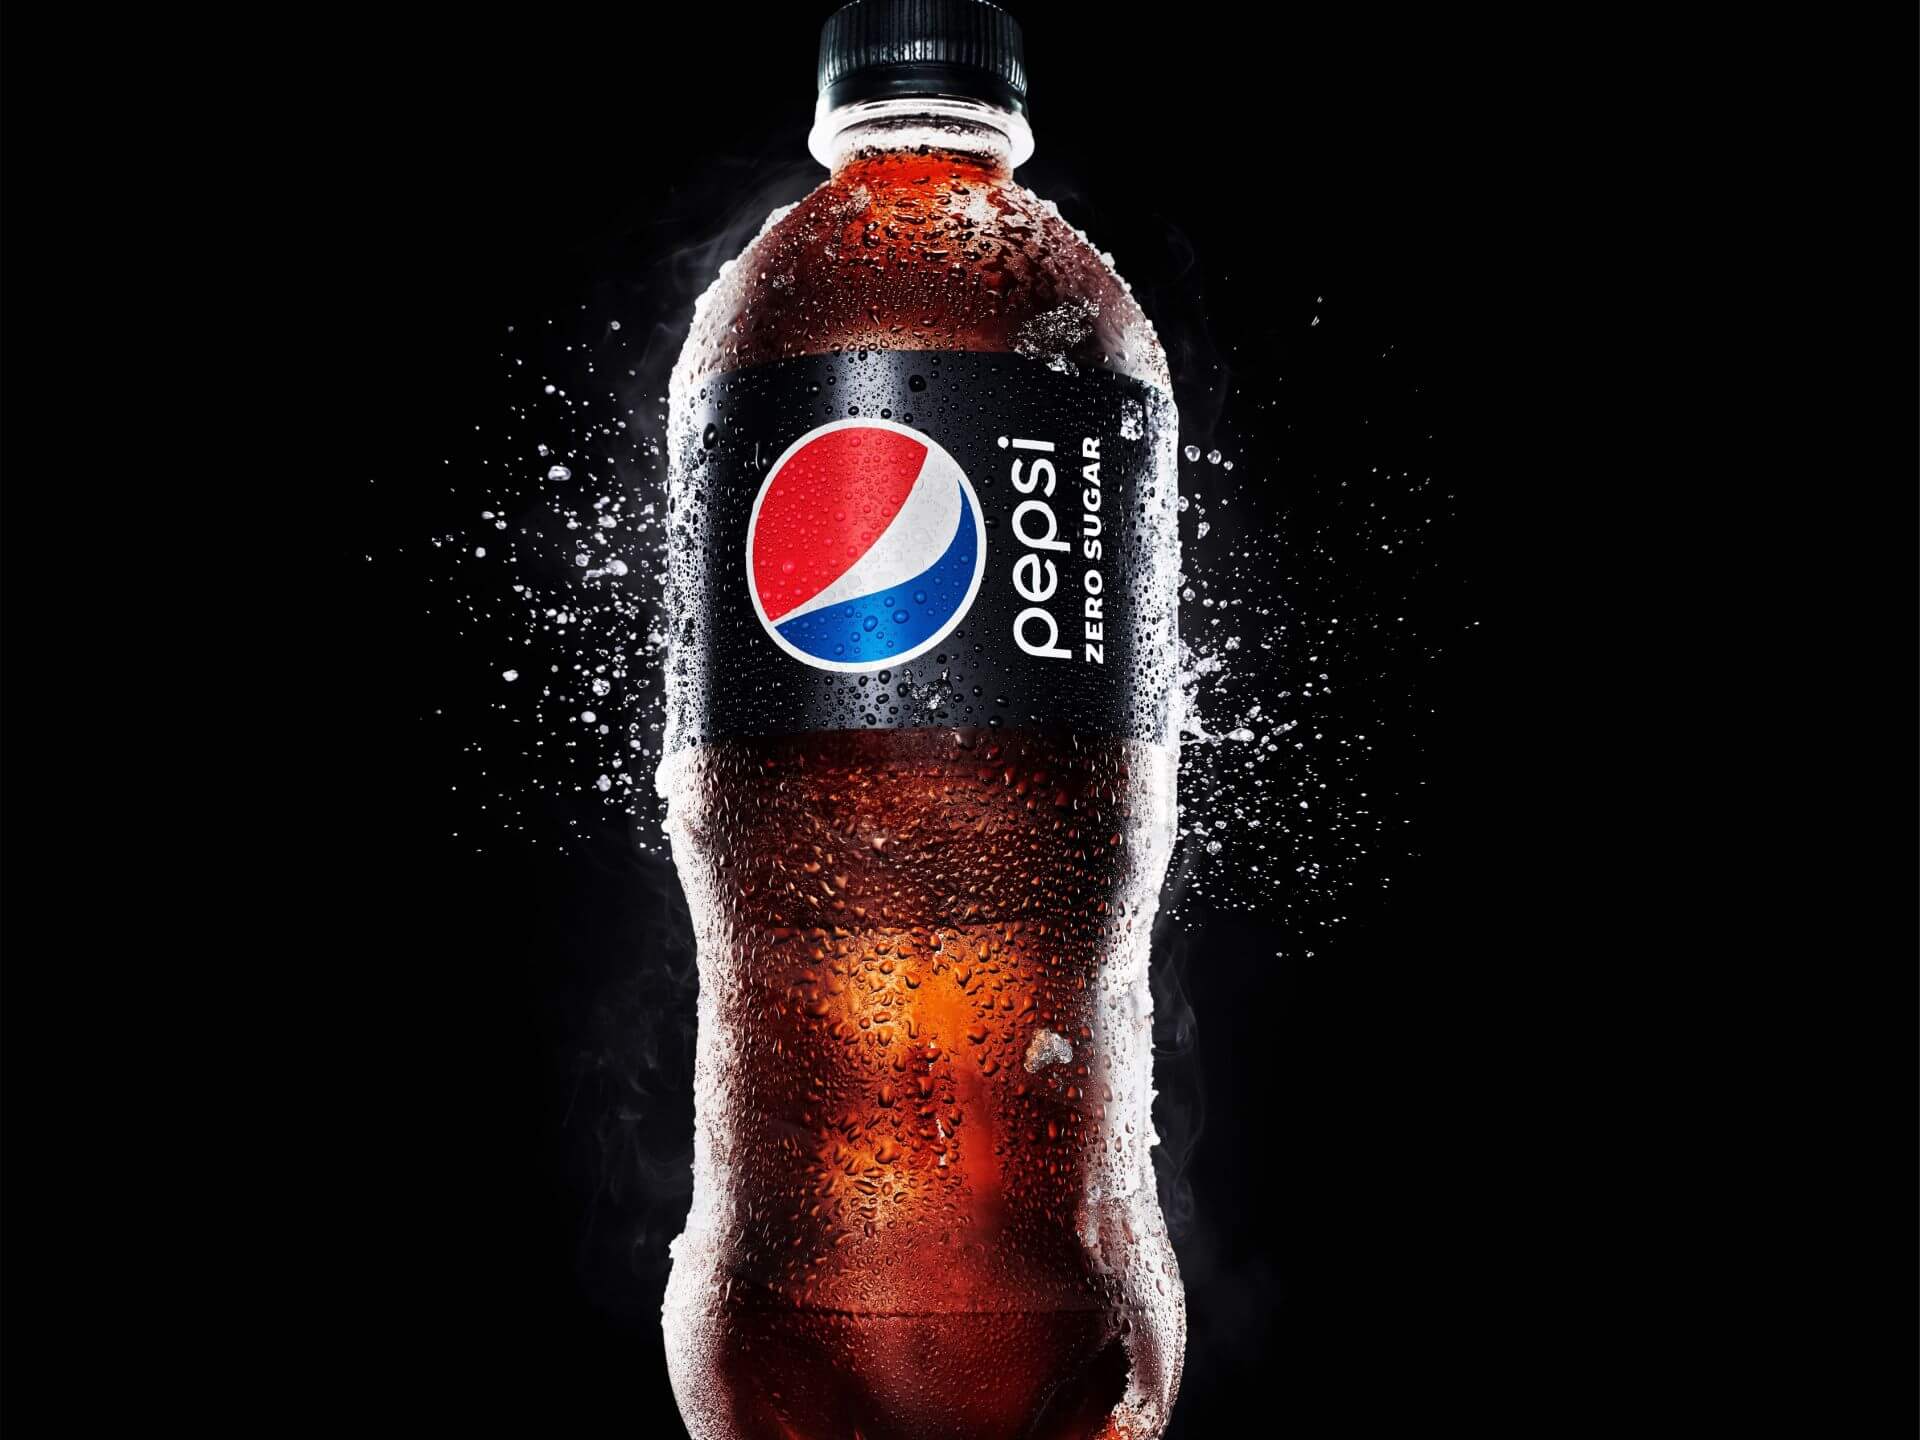
Pepsi Zero Sugar bottle

One of the biggest Super Bowl ad winners is Pepsi Zero Sugar.

Brands spent hundreds of millions of dollars to advertise during Super Bowl LVII, but do their ads actually translate to demand for their products?

A week ago we shared our ten favorite beverage-focused Big Game ads. Along with those ads we shared some numbers.

One of those numbers was $7 million, the cost of a 30-second Super Bowl ad on Fox. Other numbers? $500 million and $700 million, the range of revenue it’s estimated that Fox generated this year from Super Bowl ads.

At this point, these ads and the Halftime Show have essentially become their own entities. Some people watch the Big Game for the ads, some for the show halfway through. It stands to reason that brands are well aware of this development. So, they try to create the most impactful ad possible in the hopes of generating consumer demand.

In other words, these brands aren’t spending all this money just so they’re commercial can be deemed cool. Sure, brands want that buzz. But they also want an ROI on the millions they spend.

The big question is, then, are they seeing a return? Well, it just so happens that behavioral insight platform Veylinx has a data-driven answer to that question.

In short, the answer is yes. Of course, it’s a nuanced yes. For example, it appears Gen Z doesn’t care much about Super Bowl ads, as you’ll see below. Also, non-advertisers in the same categories as Super Bowl advertisers appear to see a benefit from the ads.

You’ll learn more from the Veylinx press release below. It’s an interesting read with valuable data for restaurant, bar, and hotel operators.

NEW YORK, Feb. 22, 2023 — A new study from behavioral research company Veylinx determined whether or not Super Bowl commercials boost consumer demand for the products advertised. The results show that 2023 Super Bowl advertising fueled a 6.4% increase in demand among viewers.

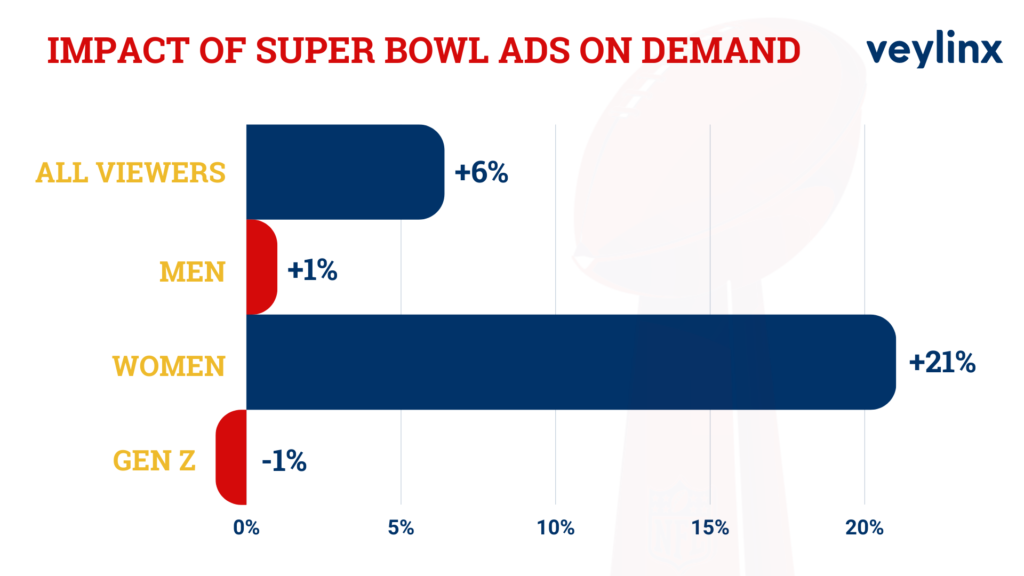
The overall increase in consumer demand was driven by women, who accounted for a 21% increase in demand growth. The commercials had minimal impact on men, yielding just 1% demand growth for the brands tested. Gen Z viewers were largely unimpressed by the Super Bowl ads, with demand among 18 to 25 year olds actually shrinking by 1%.

2023 Veylinx impact of Super Bowl ads on consumers chart

“It’s not really a surprise to see that Super Bowl ads improve sales, but the short term bump alone may not be enough to justify the $7 million price tag,” said Veylinx founder and CEO Anouar El Haji. 

Using Veylinx’s proprietary methodology—which measures actual demand rather than intent—the study tested purchase behavior during the week before the Super Bowl and again the week after. The research focused on measuring the change in consumer demand for eight brands with Super Bowl ads: Michelob Ultra, Heineken 0.0%, Hellmann’s Mayo, Downy Unstopables, Crown Royal Whisky, Frito-Lay PopCorners, Pringles and Pepsi Zero Sugar. 

Super Bowl Advertising Winners Overall

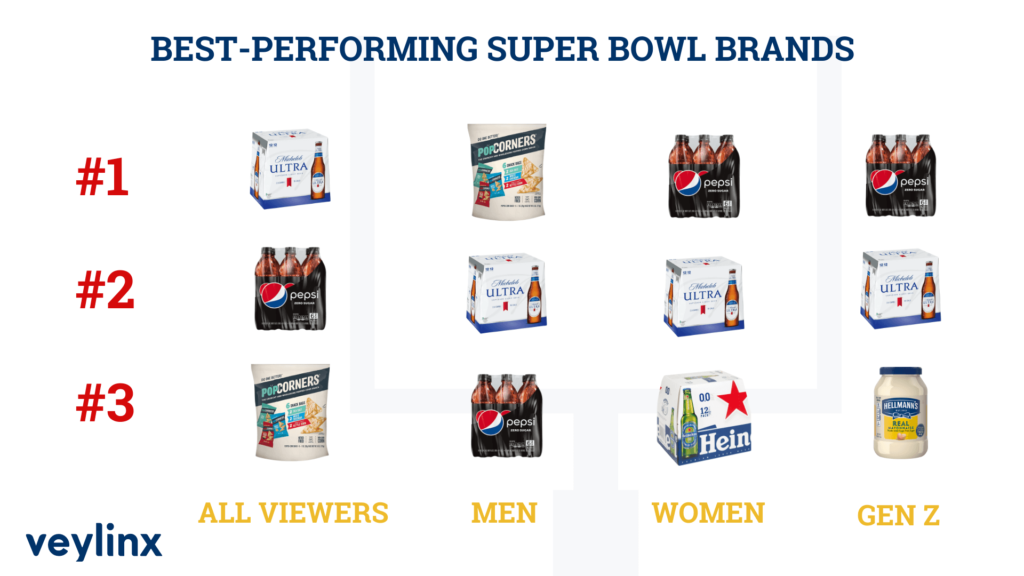
Michelob Ultra – 19% increase in demand

Pepsi Zero Sugar – 18% increase in demand

Frito-Lay PopCorners – 12% increase in demand

Heineken 0.0% – 11% increase in demand

Super Bowl Advertising Winners Among Women

Pepsi Zero Sugar – 45% increase in demand

Michelob Ultra – 40% increase in demand

Heineken 0.0% – 40% increase in demand

Crown Royal Whisky – 26% increase in demand

Veylinx, top performing brands during 2023 Super Bowl

Halo Effect for Non-Advertisers

The biggest winners were arguably brands in the same product categories as Super Bowl advertisers. Non-advertisers in those categories appeared to benefit nearly as much as the advertisers: demand grew by 4.2% percent for the study’s control group of non-advertising competitors. Corona Extra, Kraft Mayo and Lay’s STAX were the greatest beneficiaries in a control group that also included Budweiser Zero, Arm & Hammer Clean Scentsations, Canadian Club Whisky, Popchips, and Coke Zero Sugar. Notably, every non-advertiser saw at least a slight increase in post-Super Bowl demand.

“The goal of our study was to look specifically at how consumer demand is affected by running a commercial during the Super Bowl,” El Haji said. “It’s possible that the non-advertisers deployed other marketing efforts to offset or take advantage of the Super Bowl advertising—or they simply benefited from increased exposure for their categories.” 

Additional Findings

Study participants also answered a series of follow-up questions about their preferences, perceptions and how they watched the Super Bowl. More than three-quarters watched at home through various platforms, the most popular being the live cable/satellite broadcast (38%), followed by YouTube TV (15%) and Hulu (10%). When asked why they watched, it’s no surprise that participants were all about the game (64%)—but the commercials were the next most popular reason for watching (39%), followed by halftime (35%), the social aspect (26%) and fear of missing out (13%). 

About the Research

Veylinx studied the behavior of 1,610 U.S. consumers pre- and post- Super Bowl LVII. Unlike typical surveys where consumers are simply asked about their purchase intent, Veylinx measures whether consumers will pay for a product through a real bidding process. Consumers reveal their true willingness to pay by placing sealed bids on products and then answering follow-up questions.

For more information about the study and the Veylinx methodology, visit info.veylinx.com/super-bowl

About Veylinx

Veylinx is the most realistic behavioral insights platform for confidently answering critical business questions during all stages of product innovation. To reliably predict demand, Veylinx captures insights through a Nobel Prize-winning approach in which consumers have real skin in the game. This is a major advance from traditional market research practices that rely on what consumers say they would hypothetically buy. Veylinx’s unique research methodology is trusted by the world’s largest and most innovative consumer goods companies.

Main article image: PepsiCo / Article body images: Veylinx

KRG Hospitality Bars & Lounges, 2023 icon

by David Klemt David Klemt No Comments

Top 10 US Metro Areas by Inflow, Q3 2022

US Metro Areas with Greatest Outflow and Inflow, Q3 2022

by David Klemt

Tower Bridge in Sacramento, California

Real estate brokerage Redfin identifies the top ten American cities in terms of inflow and outflow, according to Q3 data.

Interestingly, a quarter of people appear to be searching for homes in cities different from where they currently live. Also compelling: one state, per the brokerage’s data ending in the month of October, is a clear favorite.

Obviously, this is important data for operators to have. When it comes to labor and guest pool changes, inflow and outflow information can be quite useful.

Top Inflow Cities: August to October 2022

Review the list below to see the metro areas experiencing the greatest inflow.

  1. Orlando, Florida
  2. Dallas, Texas
  3. North Port, Florida
  4. Cape Coral, Florida
  5. Phoenix, Arizona
  6. Tampa, Florida
  7. San Diego, California
  8. Miami, Florida
  9. Las Vegas, Nevada
  10. Sacramento, California

Did you spot the big trend? The state of Florida represents 50 percent of the list. Per Redfin‘s interpretation of the data, home buyers want leave expensive coastal cities behind.

Interesting to us in particular, two cities—Las Vegas and Orlando—are key KRG Hospitality markets. Also interesting is that Nevada and Florida are on the back half of Forbes’ best cities for starting a business in 2023.

However, we’ve seen strong hospitality industry recovery in Las Vegas this year. In fact, even the entertainment industry in Las Vegas is exploding. Additionally, we continue to gain clients in Orlando.

Top Outlow Cities: August to October 2022

Below are the metro areas seeing the greatest outflow.

  1. Philadelphia, Pennsylvania
  2. Seattle, Washington
  3. Denver, Colorado
  4. Detroit, Michigan
  5. Chicago, Illinois
  6. Boston, Massachusetts
  7. Washington, DC
  8. New York, New York
  9. Los Angeles, California
  10. San Francisco, California

If we compare Redfin’s Q2 data to the list above, it’s mostly the same. In fact, the top four outflow cities are identical. Spots five through nine are simply a reshuffling of Q2 and Q3 data.

However, Minneapolis, number ten in Q2, is replaced by Philadelphia in Q3. According to Redfin data, those Philly residents searching for homes elsewhere are showing interest in Salisbury, Maryland.

Consider how expensive it can be to move to and live in LA and San Francisco. It makes sense that California is the only state with two cities on the list above, doesn’t it?

Per Redfin, San Francisco residents are searching Sacramento and Seattle. Those in LA are looking at San Diego and Las Vegas.

Takeaway

It’s important to know where people are moving to and what cities they’re leaving behind. And it’s interesting to get a data-driven view of which states may be best for starting a business.

However, it’s far more useful to know how feasible a given ZIP code may be for a specific concept. So, while these types of lists are helpful, they’re not as practical as a targeted feasibility study.

Moreover, the dust doesn’t appear to have settled when it comes to migratory patterns of home buyers. It’s quite possible that Redfin’s 2023 inflow and outflow data will change once again in Q1 and Q2.

Image: Stephen Leonardi on Unsplash

by David Klemt David Klemt No Comments

Traffic Up but Margins Thinner

Traffic Up but Margins Thinner

by David Klemt

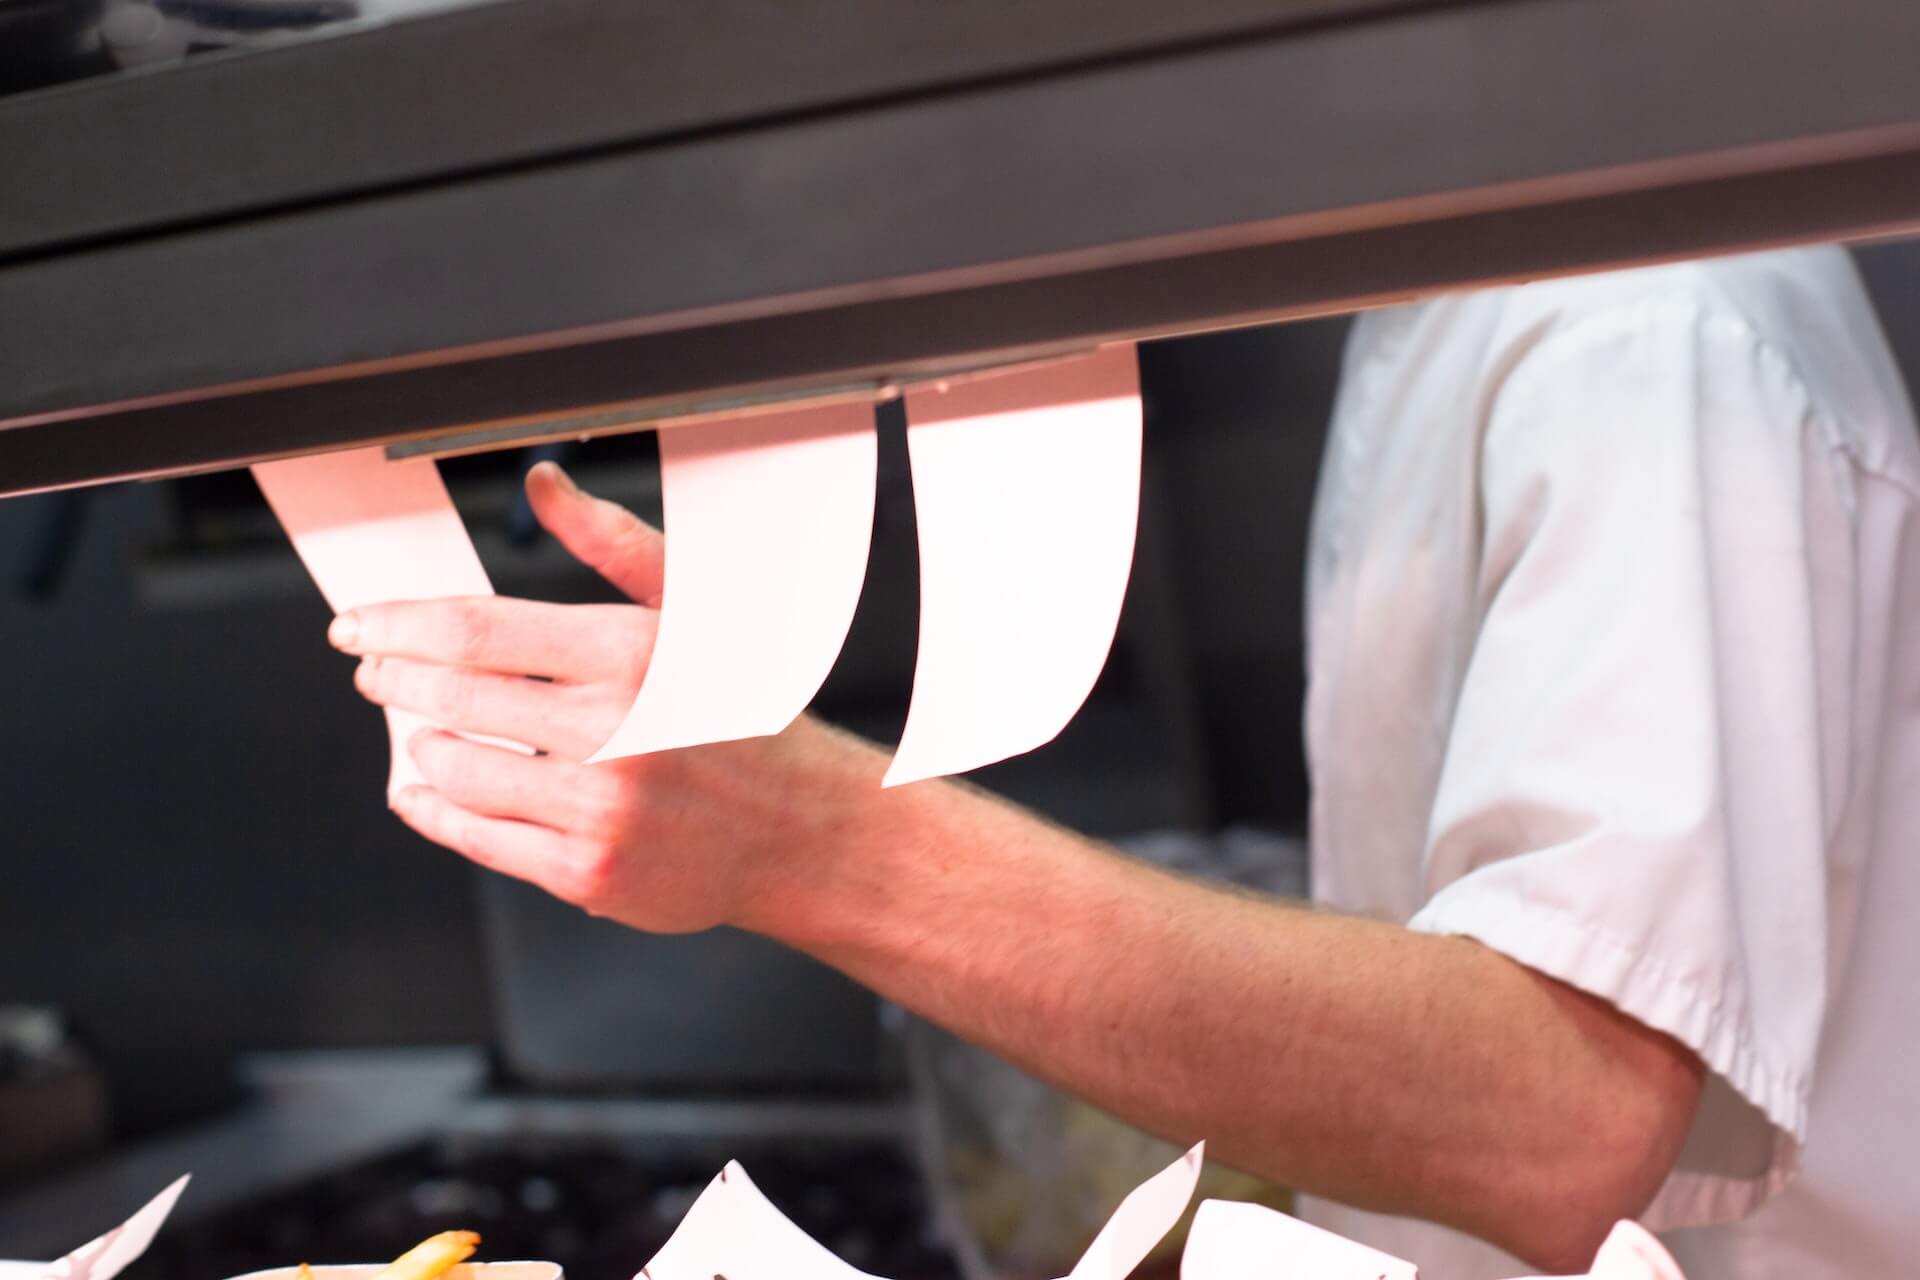
Chef checking tickets

The One Table 2022 report from Datassential focuses on the state of the operator and what the industry can expect moving forward.

This informative report shares survey results from 801 operators across America. While some of the findings are positive, it’s clear many operators are enduring significant challenges.

For some, traffic and sales are up. However, that’s not the situation others find themselves in.

To download and review the Datassential One Table 2022, please click here.

The Respondents

For this report, Datassential shares the survey answers from 801 respondents.

Most survey respondents are independent operators. In fact, they account for 71 percent of the participants. Making up the rest of the field are chain operators (15 percent) and franchise operators (14 percent).

As far as segment types, the majority of survey participants operate in the fast-casual space (18 percent). Unsurprisingly, fine dining is the smallest group of respondents at six percent. Thirteen percent operate midscale restaurants, and 12 percent are at the helm of casual-dining concepts. Somewhat surprisingly, just ten percent of participants operate QSRs.

Interestingly, the service format is fairly even among survey participants. Fifty-three percent of operators are full-service and 47 percent are limited-service.

Similarly, survey respondents represent the country’s regions pretty evenly:

  • South: 30 percent
  • Midwest: 29 percent
  • Northeast: 21 percent
  • West: 20 percent

In terms of market type, most respondents operate in the suburbs (49 percent). Following somewhat closely are urban-market operators, at 31 percent. Just 20 percent of survey participants operate in rural markets.

Traffic, Sales and Margins

At first glance, Datassential’s survey reveals positive news.

Now, I’m sure people find the terms “pandemic, “pre-pandemic,” and “post-pandemic” exhausting at this point. However, there’s no denying we continue to feel the aftershocks sent through the industry by the pandemic.

So, how do things look now in comparison to pre-pandemic traffic and sales levels?

First, the positives. Nearly half of survey respondents—47 percent—say their traffic is up in comparison to where it was pre-pandemic. Add to that the 14 percent who say their traffic is the same and 61 percent of operators appear to be in good shape.

In terms of sales, 51 percent of survey participants have good news. That news is that their sales are higher in comparison to pre-pandemic levels. Again, add the 14 percent who don’t see any change. So, that’s 65 percent of operators who appear to be performing well.

But with the good there’s bad. Unfortunately, 39 percent of respondents report lower traffic than pre-pandemic levels. And sales are lower than they were before the pandemic for 35 percent of survey participants.

Operator margins are lower for all respondents. Generally speaking, the profit margin for operators before the pandemic sat at 21 percent. Now, the average is 13 percent. QSRs and fast-casual restaurants are a bit higher among survey respondents: 17 percent and 15 percent, respectively.

On paper things do look up for many operators. However, the industry is still suffering, with a third struggling to rise to even pre-pandemic levels of traffic and sales.

Image: Daniel Bradley on Unsplash

by David Klemt David Klemt No Comments

Is There Demand for Non-alcohol?

As the Holidays Approach, is There Demand for Non-alcohol?

by David Klemt

Friends toasting with pink drinks

There’s no denying that non-alcohol is a growing beverage category, but does the data support the hype and operator consideration?

A report by behavioral research firm Veylinx offers compelling insight into non-alcohol and consumers.

By now, there’s really no excuse for failing to give non-alc serious consideration. When planning menus, operators should treat non-alc as much more than an afterthought.

Admitting fully that I’m repeating myself, giving alcohol-free beverages the same attention as their full-proof counterparts is crucial. Doing so is smart business; non-alc is capable of driving traffic and revenue.

And then there’s the guest experience element of the non-alc equation. Hospitality is about service, about ensuring every guest is comfortable. Giving guests who are abstaining from alcohol consumption a different experience than others isn’t hospitality—it’s alienation. Not only is that the antithesis of hospitality, it’s bad business.

Reviewing Veylinx data shows that non-alc is worthy of operators’ time and consideration. In my opinion, it’s even more important that non-alc menus and offerings be dialed in now. After all, the end-of-year holidays on our doorsteps.

The infamous Busiest Bar Night of the Year is nearly here. From November 23 through New Year’s Eve, people will be meeting up with family and friends. Many will also be seeking an escape from the stress of those gathering and the holidays.

Non-alcohol by the Numbers

One of the most important points made by Veylinx is this: Abstinence from alcohol isn’t limited to “social media” events like Dry January and Sober October.

Rather, consumers are choosing to abstain from alcohol throughout the year for myriad reasons. Specifically, Veylinx data reveals that more than 75 percent of Americans have abstained from alcohol consumption at some point for at least one moment.

Further, 46 percent of Americans plan to reduce their consumption of alcohol “right now.” As in, the holidays may be upon us but they’re actively working on a plan to drink less, not more.

Two major factors motivating this behavioral change are mental well-being and physical health. In service of those factors, more than half of LDA drinkers in America plan to replace beverage alcohol with non-alc beverages.

Interestingly, Veylinx finds that these consumers will pay more for non-alc alternatives in comparison to the general population.

Drilling down further, this shift in consumer behavior appears to be driven by a handful of consumer types:

  • 21- to 35-year-old consumers;
  • “light” drinkers; and
  • consumers who have set aside alcohol consumption for one month or more.

Speaking of the first group, demand for RTDs is 48 percent greater in comparison to those aged 35 or older. Add CBD to RTD and the demand among the 21 to 35 cohort grows by 18 percent.

However, not all non-alc growth comes from the 21-to-35 group. Non-alc beverages with mood boosters see an increase in demand from the 35-plus group of 29 percent.

In short, if an operator is ignoring the non-alc consumer, they’re harming their own business and reputation. Alcohol-free RTDs, cocktails, beer, and wine are growing.

Savvy operators will leverage that growth.

Image: Helena Yankovska via Unsplash

Top