Consumer behavior

by David Klemt David Klemt No Comments

2026: Animals vs. Plants?

2026: Animals vs. Plants?

by David Klemt

Fine-dining plating of beef at a gourmet dining experience in Alberta, Canada

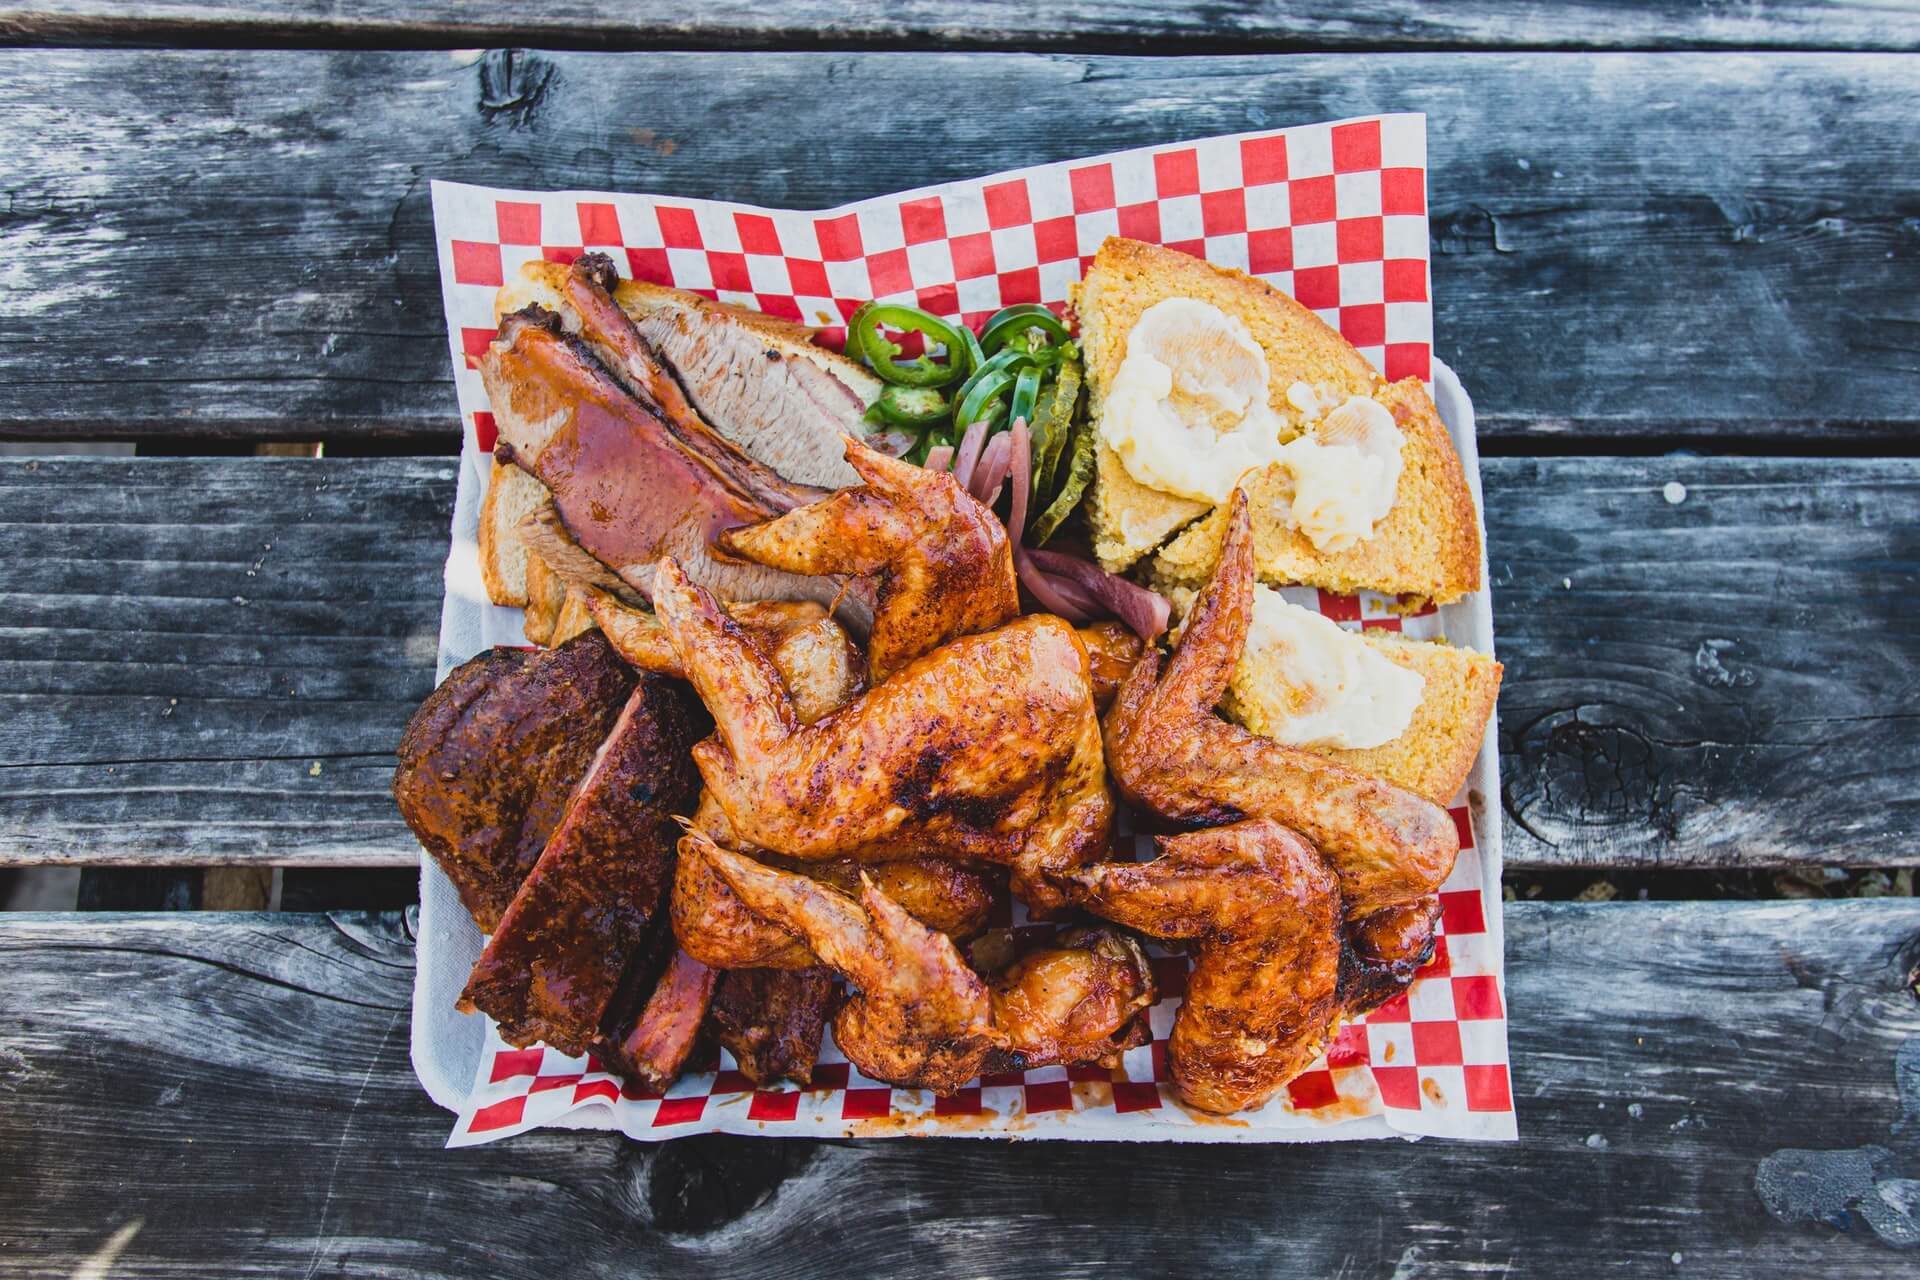
Gourmet dining experience featuring Canadian beef.

According to Datassential, plant-based meat and seafood alternatives have reached a plateau, meaning that animal meats should go hard in 2026.

Last September, the F&B intelligence platform surveyed 993 consumers who eat both animal and plant-based meats. Most indicated that they were more interested in the former than the latter.

There are three primary factors driving this sentiment, per Datassential. The top factor is how natural one category is in comparison to the other. Second is versatility. And third, which is perhaps the most important to operators with food programs, is craveability.

More Natural

Of the 993 survey respondents, 65 percent indicated that animal meat is more natural to consume than its plant-based counterparts. This appears to be the top concern or motivating factor, as it represents the greatest sentiment per respondents.

This does make some sense, at least to me. Over the past several years I’ve heard variations of this point of view at restaurants, inside kitchens, in discussions with F&B peers, while speaking with clients, and at trade shows. A common misgiving can be summed up thusly: “We don’t know exactly what they’re putting in these products.”

That doesn’t bode well for overall consumer perception.

More Versatile

Survey respondents also expressed that they feel animal meats are more versatile than plant-based alternatives. In fact, 61 percent shared that opinion.

Again, I’ve heard variations of this statement several times, and I’m sure I’m not the only one. You’ll hear “But what do I do with it?” at trade shows where there are plant-based brands exhibiting at booths and doing demos.

More Craveable

Finally, craveability. This is an interesting one. Nearly 60 percent of respondents (59%) stated that they crave animal meat on a regular basis. On its own, that’s not an incredible stat. However, that majority opinion consists of people who don’t follow through on that craving.

In other words, even people who don’t eat animal meat regularly feel its pull. That doesn’t necessarily include people who adhere to vegetarian or vegan diets, but it’s possible.

More Meat

Along with this comes some insight into consumption habits. Per the Datassential survey, 37 percent of respondents increased their consumption of animal meat more than they boosted their intake of plant-based counterparts.

This is logical when we take the three sentiments above into account as a whole. If something is more natural, more versatile, and more craveable, it stands to reason consumers are going to choose to consume it, and even consume more of it more often.

It’s also possible this increase relates to consumer interest in proteinmaxxing.

More Choices

So, where does this leave operators and their food programs?

Well, it leaves them needing to make programming, menu, and inventory choices.

Datassential suggests that plant-based meats have plateaued in the retail space. It certainly seems that consumer sentiment toward plant-based meats has also plateaued among consumers, based on their survey results.

However, that doesn’t mean operators should abandon plant-based meats and altogether. The better, more intentional approach is to run reports, analyze the data, and make choices with surgical, informed precision.

What do the numbers indicate? Are plant-based meats lagging, and are they taking up valuable inventory space? If orders for plant-based meats are declining, what do sales for “center-of-plate” vegetables look like? What can be leaned into harder, what can be adjusted, and what should be removed?

And, crucially: Are the choices for moving forward being made in a well-considered, intentional manner, or are they just knee-jerk reactions and guesses?

It’s worth noting that Datassential’s consumer sentiment survey focuses on plant-based meats, not just plants. The survey respondents didn’t indicate a decline in interest for items like cauliflower or portobello steaks.

Whatever choices are made, operators need to leverage data and facts, and follow the Three Ps: People, Processes, and Profits.

Image: Deane Bayas via Pexels

Client Intake Form - KRG Hospitality

by David Klemt David Klemt No Comments

Is 2026 the Year of ‘Maxxing?

Is 2026 the Year of ‘Maxxing?

by David Klemt

Stark image of a speed limit sign that reads "MAXIMUM 30"

If we pretend this is referring to grams of fiber, that’s excellent fibermaxxing.

If recent reports and consumer behaviors are any indication, and I think they are, health-conscious “maxxing” trends are on the menu in 2026.

Currently, proteinmaxxing appears to be king of Diet Trend Hill.

In 2026, though, protein may face a realistic contender for the crown: fiber.

Look it up and you’ll see it’s not an entirely new trend, and has been on the upswing since at least the middle of 2025.

For operators, this is yet another consumer signal. The interest (some would say obsession) in high-protein diets has inspired menu changes across categories. Whether a QSR with global reach, a regional chain, or a local independent, restaurants have been responding to their guests’ desire to consume more protein.

Now, it’s possible an interest in a high-fiber diet may inspire more menu changes and additions.

What is GLP-1?

Would you like a healthy dose of pedantry? Fantastic.

“GLP-1” stands for “glucagon-like peptide 1,” which is a hormone found in our bodies. When we eat something, GLP-1 stimulates insulin secretion.

A GLP-1 drug is an “agonist.” That is, it mimics, in this case, a hormone to cause a response.

So, when we talk about GLP-1, it’s a hormone; when we talk about the drug, it’s a substance humans take predominantly via injection. Pedantry: complete.

It may seem as though these drugs came onto the market just before Covid ravaged the world. However, the hormone was discovered around 50 years ago, and the first GLP-1 medication was approved by the FDA just over 20 years back to treat type 2 diabetes. From 2018 to 2023, according to multiple analytics sources, interest in, and use of, GLP-1 drugs for weight loss exploded.

GLP-1 medications cause the body to delay emptying the stomach. Further, the drugs tell the brain to reduce the desire to eat. Both actions curb appetite, and tend to result in significant weight loss.

Of course, side effects have been reported widely. Those who experience rapid weight loss may experience “Ozempic face.” According to Harvard Health Publishing (2004), this appearance is characterized by:

  • a hollowed look to the face
  • changes in the size of the lips, cheeks, and chin
  • wrinkles on the face
  • sunken eyes
  • sagging jowls around the jaw and neck.

There are also several gastrointestinal side effects one can experience, but I’ll let you use your imagination rather than list them.

What is Proteinmaxxing?

This one is quite a bit simpler to understand: It’s focusing on the consumption of protein, and “maxxing” it out. I assume there are two Xs to really drive home the point that something is being maximized.

Taken to the max (or “maxx,” I guess), there are proteinmaxxers who aim to consume 200 grams of protein per day. According to Cargill, a company that distributes high-protein products, there are “entire ‘social subcultures'” built around the consumption of high-protein diets. Essentially, for some proteinmaxxers, the diet is more like an ideology.

However, some doctors believe consuming that much protein can be harmful, not healthy.

Recognizing that there’s a range when it comes to protein consumption (age, activity level, etc.), there are some general guidelines one can follow.

Using the standard 2,000-calorie-per-day diet, common guidance is that 10 to 35 percent of calories should come from protein. For an “average” person, daily protein consumption can be calculated at 0.8 grams per kilogram of body weight. So, someone who weighs 150 pounds (68 kilograms) should consume 54 grams of protein per day.

People tend to face muscle loss in their 40s or 50s, and therefore should aim for 1.0 to 1.2 grams of protein per kilogram of body weight. On the high end, for that hypothetical person weighing 150 pounds, that’s an increase to 82 grams of protein.

Those who exercise regularly should increase protein consumption to 1.1 to 1.5 grams; that rises to 1.2 to 1.7 grams for people who lift weights or do other strenuous exercise on a regular basis. Using the high end, that’s 102 grams of protein per day for the former, and 115 to 116 grams for the latter.

Consuming 2.0 grams of protein per kilogram of body weight is considered “excessive” by some.

What is Fibermaxxing?

If you’re guessing that fibermaxxing is similar to proteinmaxxing, you’ve nailed it.

That said, the numbers are absolutely not the same in comparison to proteinmaxxing.

Unless something changes, the current definition of fibermaxxing appears to fall in line with current dietary recommendations: 25 to 38 grams of fiber per day.

Going deeper, nutrition guidelines state that the source of fiber should be food rather than supplements.

However, most Americans and Canadians consume just 14 to 15 grams of fiber per day. That’s a shortfall of 10 to 11 grams, every day.

It must be noted, however, that some people need to adhere to low-fiber diets for medical reasons. Further, while there’s some debate, some believe 50 grams of fiber is excessive; others feel that too much fiber is closer to 70 grams per day.

How does excessive fiber intake manifest? Again, that’s largely gastrointestinal, and, again, I’ll leave that to your imagination.

That’s all to say this: proceed with caution when trying out any diet, and try to find what’s best for you and your body.

Like protein, fiber can aid in weight loss. So, with the rise of GLP-1 medications, it’s unsurprising that some people trying to lose weight are focused on fiber while some have lasered in on protein.

What is the Point?

“David… Seriously, what the hell? Thanks for the dietary info, but what are we doing here?” I can hear some of you asking.

Simply put, operators need to be aware of large-scale consumer trends. They must consider how it can affect their people, processes, and profits.

Per Datassential, just 13 percent of operators are aware of fibermaxxing.

Borrowing from Datassential’s trend ranking system (Inception, Adoption, Proliferation, and Ubiquity), it’s fair to say fibermaxxing consumers are either on the cusp of moving on from inception to adoption or are already there.

As far as proteinmaxxing, that’s definitely in proliferation territory. What’s my evidence? A QSR, Arby’s, to be precise, introduced Steak Nuggets in Q4 of 2025. That’s an entirely different spin on nuggets in fast food, and even if it’s not stated explicitly, that certainly appears to be an appeal to proteinmaxxers looking for a snack.

There’s also the seeming addition or infusion of protein to all manner of food and drink items on menus across all categories of restaurants.

Protein-infused coffee drinks, protein-enhanced pastries, QSR meal combos for people leading a high-protein lifestyle… There are lists online of the top orders at various chains for consumers seeking protein. Of course, there are also lists online identifying high-fiber items offered by various well-known restaurants.

Then we can look to retail labeling. Unsurprisingly, food brands want to leverage increased consumer interest in protein, fiber, and other nutritional values. These companies are calling out their protein and fiber values to encourage purchases and brand loyalty.

Restaurants and bars can do the same. In some cases (more than you many think), a given menu already has high-protein and high-fiber options; it’s just not called out directly.

What is the Takeaway?

As we kick off 2026, let’s change the approach. If you want to appeal to health-conscious guests, tell them exactly what they want to know.

Review your menu, identify what falls in line with various diets, and call out those values or qualities in the descriptions.

Some consumers are proteinmaxxing. Others are fibermaxxing. Somehow, I expect balancemaxxing (maximizing the focus on a balanced diet; did I just coin a phrase?) to take hold in 2026 or 2027.

Similarly, operators need to focus on profitmaxxing for the financial health of their business, the financial stability of their hardworking teams, and longevity in serving their communities.

It all comes down to the Three Ps: People, Processes, and Profits. Serve the people (including your team members) and perfect your processes, thereby maxxing your profits.

Image: Erik Mclean via Pexels

Client Intake Form - KRG Hospitality

by David Klemt David Klemt No Comments

Are Snacks Right for Your Menu?

Are Snacks Right for Your Menu?

by David Klemt

A trio of protein shake bowls on a wooden plank, resting on a bar top

Wow, AI-generated food that actually looks like food!

The latest “-ification” to take root in food and beverage centers around people favoring consuming several meals throughout the day.

The “snackification” of F&B menus across the industry is joining “gamification” in moving from trend to standard.

So, what is snackification, and is it right for your concept, brand, and menus?

Let’s start by tackling the first part of that question.

What is Snackification?

Looking at this word from the consumer side, snackification is the replacement of full-size meals with multiple snacks.

There are several factors to which one can point to explain how this behavior went from trend to mainstay. One prevailing theory posits that people snacked more often throughout the day during the pandemic. That particular behavior simply hasn’t fallen to the wayside.

Another driver may be cost. A percentage of consumers perceive “traditional” daypart dining as more expensive than opting for smaller items whenever they feel hungry. Whether true, false, or somewhere in between, this perception exists, and it’s strengthening snacks as a viable menu category.

Of course, there’s also the treat factor. Some people simply like to treat themselves, and a snack several times a week helps them fulfill this desire.

On the operator side, snackification is the embracing of snacks as a revenue generator.

Several restaurants have created snack sections on their F&B menus. Indeed, more than a mere handful of quick-service and fast-casual concepts are leaning into snacks.

However, the creation of QSR brands that focus on snacks truly illustrates the strength of snackification.

Should You Snackify Your Menu?

Making changes to your concept and menu requires careful consideration.

Jumping on any trend should also be done with caution; the same goes for changing an element of operations to embrace a new standard.

There are several questions that need answers before deciding to snackify your menu.

  • What items will you offer as snacks? With the rise in usage of GLP-1 drugs, protein-rich snacks are growing in popularity. A focus on wellness is also motivating consumers to seek out snacks that are lower in sugar and calories. However, sweet treats are still sought after. Again, careful consideration is key.
  • How well do you know your guests? Using data, can you say with confidence that you can leverage snacks successfully? Do you know what types of snacks will resonate with guests? Are the snacks you’re considering in alignment with your brand and concept, or will the change confuse guests?
  • Will offering snacks increase your costs? You need to know know with certainty how snack items will affect labor and food costs.
  • Will the change to snacking impact other dayparts? It’s possible the shift can cannibalize dayparts, which will affect your costs, traffic, and revenue.
  • Can you transform items already on your menu into snacks? Doing so could keep your costs under control, and help you make the shift quickly. What on your menu is high in protein, craveable, and able to be produced in smaller portions easily?

It’s quite likely that snacks will resonate with your guests. However, you need to know, not guess. What does your data tell you about traffic, item sales, and guest preferences?

As I’ve said before, success in this business comes down to math, not magic.

Image: Microsoft Designer

Client Intake Form - KRG Hospitality

by David Klemt David Klemt No Comments

Watch These Drink Trends in 2025

Watch These Drink Trends in 2025

by David Klemt

AI-generated image of a bartender serving miniature Martinis

Bottle of Martinis, anyone? In case you were uncertain, this image is AI-generated.

We’re nearing the end of 2024, and that means F&B intelligence platforms are releasing their year-end reports and predictions.

Among these platforms is Datassential. Recently, they released their Future of Drink preview report. You can sign up for your own copy here.

I’ve sifted through Datassential’s latest reports and trend-focused articles, and I’ve pulled a handful I think are among those that may perform the strongest in 2025.

Cheers!

Posh Jello Shots

Or as Datassential calls them in their report summary, “highbrow” jello shots.

This is the 2025 trend prediction that stands out the most to me. Your bar team will know how to produce jello shots (or learn how to make them reliably and consistently), but it’s not a difficult skill to develop.

Jello shots, or gelatin shots if you want to be pedantic, are most often associated with house parties and dive bars. However, gelatin is an interesting cocktail canvas, offering at the very least a different way to experience drinks texturally.

The simplest way to embrace this trend would be to use upmarket alcohol to craft these shots. Premium or super premium vodkas, for example. Another way would be to convert your signature cocktail(s) into jello form. And yet another approach would be layered jello shots, with each layer crafted using premium or super-premium ingredients.

An Alternative

Of course, operators don’t need to produce specialty, higher-end shots in gelatin form. With a bit of thought and experimentation, bar teams can produce shots that are essentially miniature versions of cocktails. Further, these can be offered as flights.

So, do you have a few specialty cocktails on your menu? Offer them as a flight of shots. Want to craft themed flights, such as a Negroni and two variants (Boulevardier and Sbagliato, for example)? That idea may just take off with your guests in 2025.

Creating shootable versions of more sophisticated cocktails elevates your program. Further, doing so can help introduce guests to a range of cocktails during a single visit in what can be a more responsible manner.

Think so-called “Mar-tinies” for inspiration: miniature Martinis served in miniature Martini glasses.

Heirloom Grains

It’s likely that you’re going to see “heirloom” or “heritage” a lot more in 2025 in relation to beer.

As both terms imply, brewers who produce these types of beer use grains they can trace back decades. Often times, heirloom grains are significant historically.

For example, Hanabi Lager Co. produces Haná Pilsner. Per the brewer, Haná is an heirloom grain that was used to produce the first-ever pilsner. In case you’re a beverage history buff or like sharing stories with guests who are interested, the first pilsner was brewed in 1842 by Josef Groll in the city of Pilsen.

Hanabi Lager Co. credits British farmers with “rescuing” Haná, pulling it back from the brink of extinction in 2015. Click here to check out other Hanabi beers made with heirloom barley and other heritage grains.

Operators who are interested in leveraging beers with notable ingredients should look for the words “heirloom,” “heritage,” and “ancient grain.” Further, they should ensure they know these beers would be of interest to their guests, and serve their concept in an authentic manner.

More Beer Trends

Other beer-centric trend predictions include global beers, hazy IPA, beer cocktails, and beer with a hint of lime.

I’m confident you don’t need an explanation of each of these 2025 trend predictions. However, it’s smart to approach each with careful consideration before adding them to your menu.

To provide an example, consider flights that focus on each trend: three to four hazy IPAs, half-sized beer cocktails, or specialty global beers.

Focusing on beer cocktails, or beertails or hoptails as I’ve seen over the years, I’m somewhat skeptical how they’ll rise in popularity. In my experience, they’ve never quite “hit” throughout the years. But, maybe 2025 is the year.

As far as beers with a hint of lime, consider creating snack pairings that pair well with such beers. Snacking as a trend is expected to rise in 2025, so it’s wise to engage your kitchen team to come up with a snack menu for your bar.

Cocktails on Tap

While I don’t recommend cocktails on tap of keg cocktails for every concept, I have certainly crafted beverage programs that leverage this trend.

And, in fact, I don’t consider these drinks to be a trend at all. In my opinion, cocktails on tap may not be ubiquitous, but they’re certainly no fad.

Why do I like cocktails on tap? For several reasons.

One of those is the speed of service, which benefits the team and the guest. While labor is necessary prior to service to prepare these drinks, kegged cocktails make up for all that effort. When the right cocktails are selected for the taps, they make it easy on the bar team to serve, and make it into the hands of guests in mere moments.

Another reason is the “novelty” of cocktails on tap. These drinks aren’t new yet many guests find the idea interesting, which piques their curiosity. Engaging guests is always good for business.

Now, think about bars and restaurants that include self-pour walls as a core feature of the concept. Guests have shown they’re interested in pouring their own beers and wines from pour walls. There are myriad reasons, including trying before they commit to something new to them. This applies to cocktails as well, and kegged cocktails are perfect for self-pour concepts.

Finally, they work for just about every category of bar, from casual neighborhood watering hole to upscale cocktail bar. When an operator focuses on glassware, garnish, and presentation, a cocktail on tap can appeal to even the most discerning cocktailian.

Image: Microsoft Designer

KRG Hospitality Contact Request for Proposal 30 Minute Discovery Session

Book Below to Setup a 30-Minute Complimentary Discovery Call and Request for Proposal.


by David Klemt David Klemt No Comments

Are “Substituters” Leading NA Growth?

Are “Substituters” Leading NA Growth?

by David Klemt

Cocktails with edible flowers and dehydrated fruit for garnishes

No-ABV, low-ABV, or full strength?

Revelations shared by the IWSR recently suggest that the very generation driving non-alcohol growth may also be driving traditional beverage alcohol growth.

At least, according to the IWSR, a particular generation is over-indexing in the non-alc category and “full-strength” categories such as rum, whisky, Champagne, brandy and Cognac, and RTDs.

This is because Millennialsthere it is, the big reveal—appear to be “substituters.” That is, as explained by the IWSR, much of this cohort consumes alcohol on some occasions, and non-alc beverages on others.

Now, before we proceed, let me get this out of the way: No generation is a monolith. While there’s value in understanding a given generation’s behavior, it’s important to understand that we can really only do so in broad terms.

That said, broadly speaking, members of the Millennial generation appear to be driving the growth of non-alc overall. In comparison to other generations, Millennials are consuming more non-alc spirits, more non-alc beer, and more non-alc wine.

Of course, there’s another caveat I must address: Less than half of Gen Z is of legal drinking age. So, when compared to that generation, the numbers are a bit skewed.

Generally speaking, non-alc is growing across the board in the US. What was once relegated to two or three low-alc beers and barely considered “mocktails” for many, many years is now a viable category. The category has gone from an afterthought to inspiring entire alcohol-free bar concepts, and it hasn’t taken long to achieve this growth.

Numbers

When I say Millennials are consuming more non-alc than other generations, what does that mean? Is the difference subtle, or is it eyebrow raising?

Per IWSR data, it’s the latter.

Last year, 45 percent of all non-alc beer drinkers in the US were Millennials. That number has jumped to 61 percent in 2024. Change focus to non-alc spirits and Millennials make up 66 percent of overall US consumers. That number is 59 percent when we look at who’s drinking non-alc wine.

For some context, just 22 percent of non-alc beer drinkers in the US are Gen X. Take a look at legal-drinking-age Gen Z and that number shrinks to seven percent. Again, though, most of Gen Z isn’t yet LDA.

So, back to substituters. Just under half of all Millennials, according to IWSR findings, vacillate between non-alc and full-ABV. It would appear, then, that Millennials are the most interested in exploring and experimenting with non-alc beverages.

For obvious reasons, this makes it clear that operators need to do more than just toss a couple of alcohol-free beers and sugary zero-proof cocktail concoctions on their menus.

Further, and I know I’m repeating myself, operators need to ensure they deliver the same level of service and guest experience for those abstaining from alcohol as those ordering traditional adult beverages. Failing to do so can alienate guests who choose to not consume alcohol but want to visit and socialize at a bar or restaurant. Why would they return if they receive what they perceive to be a lower level of service?

IWSR’s deep dive and data make it clear that operators need to give the non-alc element of their menu due consideration. The category is growing, interesting is increasing, and it’s smart business.

To review this data yourself, follow this link.

Image: Rachel Claire via Pexels

KRG Hospitality Contact 60-Minute Impact Session

Looking to Start, Stabilize, or Scale? Book Below to Setup a 60-Minute Result-Driven Impact Session.


by David Klemt David Klemt No Comments

Is Demand for Delivery Down?

Is Demand for Delivery Down?

by David Klemt

AI-generated image of a person carrying takeout bags from restaurant to their motorcycle

I have done this. Cargo straps required.

Not too long ago, it seemed as delivery was going to overtake people’s desire to enjoy a restaurant in person, but that trend may be on a downward swing.

At first, this trend made perfect sense, for obvious reasons. For a while, the best way for consumers to enjoy their favorite restaurants and show support was to order delivery.

Rideshare companies jumped on delivery, as did several platforms. When guests were able to visit restaurants in person freely, delivery had become a habit for many of them. In fact, ordering delivery had become the de facto method of engaging with restaurants for a not-insignificant percentage of people.

However, operators and their teams weren’t shy about exposing their delivery “partners.” I think it’s fair to describe the fees operators were being charged by some of these partners as outrageous.

When the public found out about these fees, they didn’t sit well. Takeout, carryout, takeaway, order for pickup… Whatever your preferred nomenclature, people began seeing it as superior to delivery. This shift in consumer behavior was driven by a desire to support their favorite restaurants.

Of course, there are other factors that affected people’s move away from delivery. I’m confident in saying that most of us who have ordered delivery at some point in the last couple of years has experienced at least one of several downsides.

However, has delivery really fallen out of favor? Have takeout or drive-up pickup actually been passing up delivery?

Datassential’s 2024 Midyear Trends Report has some insights that can answer those questions. You can (and should) check it out for yourself here.

The State of Takeout and Delivery

To obtain a snapshot of the state of the performance of delivery and takeout, Datassential conducted a survey in May of this year. The F&B intelligence platform surveyed 400 US operators and more than 1,500 US consumers.

According to Datassential, nearly half of restaurant operators reported increases in guests dining in person at their restaurants.

Perhaps more telling, however, is that Datassential’s survey reveals that half of restaurants aren’t even offering delivery. I don’t know the breakdown of operators who once offered delivery and stopped doing so versus operators who never offered delivery.

What I do know is that there are, as I alluded to up top, many reasons for people to eschew delivery. Chief among these are cost, and the condition of the order when it arrives to the guest.

On the operator side, cost is once again a consideration, as are negative reviews and complaints. More than one study has shown that operators often get the blame when a third party botches an element of the delivery. These complaints can include food being delivered lukewarm or cold, parts of the delivery missing, or the wrong items being delivered to someone.

But, again, is demand for delivery slipping?

Per Datassential’s report, takeout and catering are outpacing the growth of delivery for US operators. Almost 40 percent of operators who participated in Datassential’s survey reported an increase in frequency for takeout and catering orders. In comparison, just 20 percent of respondents ordered an increase in delivery order.

Just eight percent of operators indicated a decrease in takeout and delivery. In fact, the greatest decrease impacts catering (14 percent), according to Datassential’s report.

Takeaway

Delivery, simply put, doesn’t work for every operator or every concept. Moreover, it looks like consumer desire for takeout is on a greater upswing in contrast to delivery.

For concepts that succeed with delivery, it’s imperative that operators control the process rather than cede to third parties, in my opinion.

The best way forward will vary from business to business. Operators and their teams need to be ruthless the quality, consistency, accuracy, and value of all orders, whether placed in person, for takeout, or for delivery. Further, when it comes to takeout and delivery, the ordering process must be convenient.

What’s clear is that every operator needs to dive into their data, determine how guests prefer to order from their restaurant, and pursue those preferences to enhance the guest experience.

Image: Microsoft Designer

KRG Hospitality Contact Request for Proposal 30 Minute Discovery Session

Book Below to Setup a 30-Minute Complimentary Discovery Call and Request for Proposal.


by David Klemt David Klemt No Comments

Did This Beer Win Super Bowl LVIII?

Did This Beer Win Super Bowl LVIII?

by David Klemt

A pint glass overflowing with beer

Now that the Super Bowl is over, behavioral insight platform Veylinx is revealing the impact on brands that advertised during this year’s big game.

If Veylinx sounds familiar to you, you may be a regular KRG Hospitality news reader. Last month we looked at their dive into alcohol-free canned cocktails. Last year, we shared a Veylinx report with a focus on whether Super Bowl ads really work on consumers. And in 2022, Veylinx wondered if the interest in zero-proof drinks was all hype or worth leveraging.

This month, Veylinx is at it again. This time, however, they’re revealing which brands—those that advertised during Super Bowl LVIII—saw the biggest ROI. For context, a 30-second spot during the big game cost approximately $7 million this year.

That’s a ton of cash to shell out in the hopes of seeing a sales increase on- and off-premise.

Speaking of on-premise, Veylinx’s findings should be of interest to operators. The beer that Veylinx says “won” the Super Bowl will likely be top of mind among your guests who watched the game and the accompanying ads.

So, it stands to reason that they’ll either expect to find that beer on a menu. Likewise, they may be swayed to order the beer if they see it when scanning a bar’s taps, menu, or fridges.

With that in mind, operators may want to watch their sales of Michelob Ultra.

Study Methodology

For their latest report, Veylinx used similar methodology to their Elixir non-alcoholic canned cocktail study.

A mix of 50 percent men and fifty percent women participated in the study. All 1,604 participants were US residents aged 21 or older. Looking deeper into the participants, the age breakdown is as follows:

  • 21 to 27: 30 percent
  • 28 to 43: 25 percent
  • 44 to 59: 25 percent
  • 60 and older: 20 percent

Like the Elixir (a fake brand invented by Veylinx) study, participants bid on products with their own money. The auction mix consisted of products that advertised during Super Bowl LVIII and those that did not advertise during the game.

Study Results

Among all viewers of Super Bowl LVIII, brands that advertised during the game saw an average lift of 16 percent.

However, those brands saw the biggest boost in demand—24 percent—among men. Gen Z followed, with demand in advertised brands growing by 11 percent. Among women, brands that advertised saw just a nine-percent boost in demand.

While Doritos Dinamita was the number-one brand among all viewers in general, and men and Gen Z in particular, Michelob Ultra is a close second. Interestingly, the beer brand was the top-performer among women in terms of demand growth.

For those wondering, no alcohol brands were among the top three performers for Gen Z.

So, operators who have noticed in uptick in Michelob Ultra sales may have Super Bowl LVIII to thank. If that’s the case, if sales of Michelob Ultra have increased in bars and restaurants since this year’s big game, it appears that yes, Super Bowl ads still work on consumers.

Image: cottonbro studio on Pexels

Bar Nightclub Pub Brewery Menu Development Drinks Food

by David Klemt David Klemt No Comments

Pizza Today’s 2024 Report Reveals Most Popular Cheeses

Pizza Today‘s informative 2024 Pizza Industry Trends Report is full of useful information, from top styles and toppings to new cheeses guests can choose.

Two weeks ago we did a deep dive into the top eleven pizza styles going into 2024, per Pizza Today. Click here to read that article.

Last week we checked out what the pizza publication had to say about top pizza styles by region. Additionally, we looked at the top toppings nationally and regionally. You can read that article here.

Now, we’re going to talk about what Pizza Today has learned about the top cheeses operators are putting on their menus.

by David Klemt

Cheese pull from cheese pizza

Top Pizza Styles, Nationally and Regionally

Before we jump into the cheeses, a quick recap of the top pizza styles in America.

  1. New York
  2. Traditional American
  3. Sicilian
  4. Deep Dish
  5. Neapolitan / Napoletana
  6. Chicago Thin / Tavern-style
  7. Detroit
  8. Grandma
  9. California / American Artisan
  10. NEOpolitan / Neo-Neapolitan and Chicago Thick (tie)

And now, the top trending pizza styles.

  1. Detroit
  2. Deep Dish and Grandma (tie)
  3. Sicilian
  4. New York
  5. Chicago Thin

Finally, the top pizza styles by region. For a more detailed explanation of each region, click here.

The West

  1. New York Style
  2. Traditional America
  3. California/American Artisan
  4. Sicilian
  5. Neapolitan

The South

  1. New York Style
  2. Traditional America
  3. Sicilian
  4. Deep Dish
  5. Neapolitan

The Midwest

  1. Traditional America
  2. Chicago Thin
  3. New York Style
  4. Deep Dish
  5. Detroit

The Northeast

  1. New York Style
  2. Sicilian
  3. Traditional America
  4. Neapolitan
  5. Grandma

Top Pizza Toppings, Nationally and Regionally

We’re almost to the cheeses. First, a recap of the most popular items to put on top of cheese.

Well, unless we’re talking a stuffed pizza. Click here and scroll to Deep Dish to see what I mean.

Now, the top toppings across the US.

  1. Pepperoni
  2. Sausage
  3. Mushroom
  4. Extra Cheese
  5. Bacon
  6. Chicken
  7. Onion
  8. Red/Green Bell Pepper
  9. Ham
  10. Black Olives
  11. Meatballs
  12. Canadian Bacon
  13. Jalapenos
  14. Pineapple
  15. Beef
  16. Basil
  17. Banana Peppers
  18. Fresh garlic
  19. Tomatoes
  20. Spinach

Below, how toppings break down regionally.

The West

  1. Pepperoni
  2. Sausage
  3. Mushroom
  4. Chicken
  5. Bacon

The South

  1. Pepperoni
  2. Sausage
  3. Mushroom
  4. Extra cheese
  5. Bacon

The Midwest

  1. Pepperoni
  2. Sausage
  3. Mushroom
  4. Bacon
  5. Onion

The Northeast

  • Pepperoni
  • Sausage
  • Mushroom
  • Extra cheese
  • Bacon

Top “New” Cheeses

Okay, so we’ve reviewed top pizza styles. We’ve done a recap for toppings.

So, what are some of the top “new” cheeses going onto those pizza styles and being covered in all those toppings?

It may seem odd the refer to the cheeses below as “new.” In this context, “new” means, “not mozzarella” or “not provolone,” for the most part. Or, if you’re in St. Louis, “not Provel.”

  • Ricotta
  • Cheddar
  • Fresh Mozzarella
  • Goat Cheese
  • Parmigiano Crema
  • Cotija Cheese
  • Scamorza
  • Vegan Cheese
  • Blue Cheese
  • Feta

Guests love personalization, and they love the opportunity to try new foods and new takes on foods they know.

Scamorza

For the most part, you’re likely familiar with all the cheeses above. However, if you’re like me, you may be unfamiliar with scamorza. If that’s the case, I looked into it for both of us.

Like mozzarella, scamorza is made from either stretched cow or water buffalo milk cheese curds. This cheese originates from Italy and comes in two styles: scamorza bianca or and scamorza affumicata. The former is white or natural, while the latter is smoked and brownish in appearance.

Further, bianca is a mild, somewhat sweet cheese. Affumicata, being smoked, delivers a more savory and, as one would expect, smoky flavor.

Vegan Cheese

If you aren’t offering vegan or plant-based cheese for your pizzas, you may not know what brands to use.

Well, don’t worry. I’ve also done some legwork into this topic.

Brands to check out are Violife, Diya, Chao, and Miyoko’s. As plant-based alternatives become more commonplace and expected by guests, I expect more commercial vegan-friendly cheeses to become available. Perhaps we’ll see some at this year’s National Restaurant Association Show.

Image: Pablo Pacheco on Unsplash

Related Reading

Work with Us

To work with us on your restaurant, bar, cafe, nightclub or other hospitality project, click the image below. Cheers!

Client Intake Form - KRG Hospitality

by David Klemt David Klemt No Comments

Can It? NA Canned Cocktail Performance

Can It? Zero-proof Canned Cocktail Performance

by David Klemt

Moth Margarita canned cocktails stacked on a black, wood table

Veylinx, a behavioral research platform trusted by some of the world’s biggest brands, has turned their attention alcohol-free canned cocktails for a recent study.

They’ve researched demand for non-alcohol before. In fact, you can find our analysis of their 2022 study here. We’ve also covered their look into the effectiveness of Super Bowl ads.

For their latest study, consumer demand for non-alcoholic canned cocktails, Veylinx showed how seriously they take research and methodology.

Conducted between November and December of 2023, the platform created a fictional canned cocktail brand, Elixir. This was done to account for brand bias.

Further, the “brand” produced two benchmark products—alcohol and alcohol-free—and four variations. These non-alcoholic variants offered four different benefits: CBD, mood boost, zero-calorie, and natural detox.

All participants were 21 or older:

  • 21 to 25
  • 26 to 35
  • 36 to 45
  • 46 to 55
  • 56 to 65
  • Older than 65

Half of the study identified as male, and the other half as female. Most, 73 percent, were alcohol drinkers, while 27 percent were not.

For the study, Veylinx had each participant, 410 in total, bid on the six Elixir products with their own money. The bidding took place in randomized, sequential auction.

After the auction, the participants completed a questionnaire. The following is a sample question:

“What would be the main reasons for you NOT to buy non-alcoholic beverages? Please select all that apply.”

Possible answers to that question were: Limited availability, Limited variety, Flavor, and/or Other.

With methodology explained, let’s check out the results.

Canned Cocktails by the Numbers

While demand for non-alcohol canned cocktails appears to be growing, their counterparts remain most popular.

Per Veylinx, demand for Elixir’s alcoholic canned cocktails surged by 20 percent in their study. In comparison, average demand for the fictional brand’s non-alcoholic benchmark and variants canned cocktails increased by four percent.

Further, the full-proof and zero-proof CBD products garnered the most interest. The alcoholic version saw an uplift of seven percent, and CBD saw a three-percent uplift. Consumers showed the least interest in non-alcohol, zero-calorie variants.

Comparing 2022 to 2023, demand for “standard” alcohol-free canned cocktails is up 14 percent. This is followed by the CBD variant with four-percent growth in consumer demand. Next, non-alcoholic canned cocktails with a “mood-boosting” benefit, which grew by two percent. Natural detox saw an increase in demand of just one percent. And consumer demand for zero-calorie, zero-alcohol canned cocktails fell by one percent.

So, today’s consumer, at least according to research conducted by Veylinx, is most interested in alcoholic canned cocktails. Still, there’s growing interest in alcohol-free canned cocktails, something for operators to keep in mind.

Changes in Behavior

Speaking of interest in zero-proof, Veylinx uncovered some other interesting information.

In 2022, around 56 percent of consumers expressed interest reducing their alcohol consumption. That number fell by 18 percent to 38 percent in 2023. That’s still a significant percentage of consumers looking to make a big change in their lives.

Forty-one percent of consumers aged 21 to 35 are trying to reduce their alcohol intake. That number drops slightly to 36 percent for those aged 36 and older.

Veylinx also found that half of consumers would drink less alcohol if one simple change took place. All it would take is better-quality, non-alcohol versions at better prices to hit the market.

In fact, per Veylinx, consumers cited flavor and price as the two top influences on their decision to consume zero-proof canned cocktails. So far, energy drinks are the go-to for most consumers trying to drink less alcohol.

If they’re smart, brands with an interest in producing successful non-alcohol canned cocktails will work to improve costs, flavors, and health benefits, if this Veylinx study is taken to heart.

To review this study in its entirety yourself, click here. The press release for the study is below.

The Year of Canned Cocktails: Consumer Demand Increases for Non-Alcholic and Alcoholic Variations

NEW YORK, December 20, 2023 —  According to a new, year-over-year study from behavioral research platform Veylinx, consumer demand is increasing for both non-alcoholic and alcoholic canned cocktails. Using Veylinx’s proprietary methodology—which measures actual demand rather than intent— the study found that demand for non-alcoholic canned cocktails grew by 4%, while demand for alcoholic canned cocktails surged by 20% over last year.   

While interest remains strong for non-alcoholic alternatives, the percentage of people trying to reduce their alcohol consumption fell by 18%, to 38%. This decline from 2022 could lead to lower participation in abstinence events like Dry January. 

Half of respondents claimed they would drink less alcohol if better non-alcoholic alternatives were available, showing opportunity for yet more innovation in the beverage sector. Those looking to reduce their alcohol consumption are 50% more interested in non-alcoholic cocktails.

In 2022, “Never tried before,” was the top reason consumers gave for not buying canned non-alcoholic beverages. That is no longer the case in 2023, suggesting that non-alcoholic canned cocktails increased their market penetration over the last year. Flavor and price are now the primary reasons people don’t buy non-alcoholic cocktails.

“Even with fewer people trying to reduce their alcohol consumption, demand for non-alcoholic canned cocktails continues to grow,” said Veylinx founder and CEO Anouar El Haji. “Drinkers and non-drinkers alike are receptive to ready-to-drink alternatives that are better for their health and wallets.”

The study also measured demand for non-alcoholic cocktails enhanced with functional benefits like mood boosters, detoxifiers and CBD. Demand for the standard non-alcoholic version increased 14% from last year, while the enhanced variations increased only slightly and the zero-calorie version fell by 1%. This suggests consumers might be losing interest in what they perceive as marketing gimmicks. The CBD version saw a 4% increase in demand, remaining the most popular non-alcoholic variation. 

Additional key findings: 

  • The optimal price for non-alcoholic canned cocktails that maximizes revenue for brands is $12 for a four-pack

  • The brands consumers have tried the most are: 1) Mocktail Club, 2) Wild Tonic, 3) Spiritless, 4) DRY,  and 5) Hella Cocktail Co

  • 44% of people expressed support for an additional 10% tax on alcohol as a public health measure for reducing consumption 

  • For those aiming to drink less alcohol by replacing it with other beverages, energy drinks experienced the greatest increase in popularity

  • Physical Health and Cost are the two most popular reasons for reducing alcohol consumption

  • Grocery stores are the most popular place to buy non-alcoholic canned cocktails

  • Flavor options have the most influence on which brand consumers choose

  • A lower price would convince 20% of consumers to buy more non-alcoholic cocktails

To download more detailed results from the 2023 Non-Alcoholic Canned Cocktail study or for more information about Veylinx, visit https://veylinx.com/canned-cocktails

About the research 

Unlike typical surveys where consumers are simply asked about their preferences, Veylinx uses behavioral research to reveal how much consumers will pay for a product through a real bidding process. Consumers reveal their true willingness to pay by placing sealed bids on products and then answering follow-up questions about their reasons to buy or not to buy. The research was conducted in November and December 2023 among U.S. consumers ages 21 and over. It is a follow-up to a similar study Veylinx conducted in October 2022. The 2022 study can be found at https://info.veylinx.com/non-alcoholic-cocktails

Image: Ambitious Studio* – Rick Barrett on Unsplash

Bar Nightclub Pub Brewery Menu Development Drinks Food

by David Klemt David Klemt No Comments

af&co. x Carbonate: 2024 Trends to Watch

af&co. x Carbonate: 2024 Trends to Watch

by David Klemt

Paddle and ball on pickleball court

Marketing and creative agencies af&co. and Carbonate Group‘s 16th annual Hospitality Trends Report provides in-depth insight across several categories.

This is an in-depth, insightful report operators should review in its entirety. The “Sweet Sixteen” edition of this yearly report is available for download here.

There are two interesting details toward the end of af&co. and Carbonate’s report. First, a list of 2023 clients. Second, an explanation for the design of the report itself.

This makes sense: Carbonate is a creative agency that works in the hospitality space, after all. Further, af&co. is a hospitality industry marketing agency.

Now, I won’t be sharing every trend or insight found in these two agencies’ report. Rather, I’m highlighting a number of items across four of the report’s six categories. Again, I think operators and leadership team members should download the report for themselves.

Food

While af&co. and Carbonate identify specific cuisines and items that are trending, it’s their 10,000-foot view of food that I find most compelling. In terms of the big picture, “rigid” adherence to authentic cuisine is falling out of favor.

Chefs, in the agencies’ opinions, are taking a more modern approach to menus. Instead of following the “rules” of certain cuisines, they’re creating dishes and programs that defy labels. Of course, for those who feel the need to label, one could call this approach “contemporary fusion.”

Examples given are Good Luck Gato’s Okonomiyaki Baked Potato, and the Birria Dumplings at Little Bull.

Cuisine Trends

Of course, af& co. and Carbonate also zoom in on food. Their Cuisine of the Year goes to Korean.

Dessert of the Year goes to the Pavlova or Eton Mess. So, one can argue that operators should connect with their back-of-house teams about meringue-based desserts.

Other food trends include making pastries with buckwheat; getting inventive with mortadella; serving borek in snack and entree size; and Brazilian-style pizza.

However, it’s a presentation trend that stood out the most to me. Accompanied by a timeline complete with images, the agencies state confidently that we’re in the “Crescent Moon” era of plating.

Visualize a plate, then place all of the food along the edge, with roughly two-thirds of the space open. That’s the crescent moon presentation.

Beverage

A number of the trends in this section aren’t exactly new. That tells me that some are likely on the brink of moving from trend to ubiquity.

That, or they’re at risk of bumping against their expiration date.

Two trends that have been popping their fins out of the sea of cocktails for a bit make it into the af&co. and Carbonate report. One is clarified cocktails.

Spend a bit of time looking up cocktails on social media and you’ll see these are a bit divisive. Some bartenders are all for them, some appear to absolutely despise this trend. Guests, however, seem to like the novelty of well-known, opaque or translucent classic turning transparent.

Another drink trend? Culinary cocktails. For food-driven concepts, it makes perfect sense to encourage the bar team to work closely with the kitchen team. Offering culinary cocktails is one method of pulling a concept’s threads tighter, telling a more complete story.

Along those lines, the agencies identify another divisive cocktail trend: cheese.

Personally, cocktails that feature cheese aren’t my thing. However, these drinks are, at the minimum, going to grab a guest’s attention. And those who order these drinks aren’t likely to forget the experience any time soon, good or bad.

That last point is important for operators and their teams to remember. A negative experience can be more powerful and stick with a guest longer than a positive one. So, pursue trends with caution.

Hotel

One of the biggest hotel developments the Hospitality Trends Report identifies is the dual-brand hotel. This is also a trend with which KRG Hospitality is well acquainted, both through industry research and client projects.

So far, the most common approach tends to include two towers, a shared lobby and fitness center, and shared F&B concepts. However, there are properties that incorporate not only brand-specific design for each tower but separate the bars and restaurants as well.

Notably, Marriott opened the first-ever tri-brand hotel in Nashville in 2019. The hotel and resort colossus combined an AC Hotel, a Residence Inn, and a SpringHill Suites.

Another interesting hotel trend? Eco-friendly, pre-fab construction. An excellent example of this approach is Moliving. To learn more about this brand, check out Bar Hacks podcast episode 68 with Jordan and Hanna Bem.

Interest by consumers in supporting eco-friendly brands informs two other trends identified by af&co. and Carbonate. One of these is hotels and resorts including e-bikes among their amenities.

Another is rewarding guests for engaging in a number of green initiatives. For example, cleaning up the beach in front of a hotel, or helping to plant trees on or near the property.

Speaking further of amenities, hotel and resort operators are likely aware that if they have courts for racquet sports, they need to include pickleball.

Design

Operators considering a refresh or starting from a clean slate for a new space may want to work with a designer on the following approach: maximalism.

According to the 16th annual Hospitality Trends Report, this bold, playful design language is on the rise. Following this trend, af&co. and Carbonate think that maximalism is working particularly well for “concept-driven, design-forward” bars.

As far as colors and materials operators may want to ask designers about, the agencies suggest pink, bronze, gold, and velvet. These colors are warm and welcoming, exactly what a hospitality venue should be.

To download the Hospitality Trends Report, click here. Two categories not covered in this article are Marketing Ideas and Social Media Trends, so follow that link!

Image: Mason Tuttle on Pexels

Bar Nightclub Pub Brewery Menu Development Drinks Food

by David Klemt David Klemt No Comments

Taco Bell Leveraging Subscriptions & LTOs

Taco Bell Leveraging Subscriptions & LTOs

by David Klemt

Taco Bell Grilled Cheese Nacho Fries

Not for the first time, Taco Bell is showing the industry the power of offering fan-favorite limited-time offers and leveraging subscriptions.

These days, everything seems to be subscription-based. We stream shows and movies via subscriptions. We can have food, clothing, gadgets, collectibles, and knick-knacks delivered to us by subcription.

Car features like heated seats, remote engine start, and self-driving? Subscriptions. Want to use software we used to buy once and install? Now we’re paying monthly to use it (or up front for a “discounted” yearly fee).

So, why should people find it odd to subscribe to one of their favorite restaurants? If the value is there for a consumer it’s no different than paying a monthly fee for other products and services to which they subscribe.

Clearly, Taco Bell has an acute understanding of people’s comfort with subscriptions. For many consumers, they’re the norm, just part of their daily routine.

As evidence, I introduce Exibit A, the Taco Lover’s Pass.

What makes this subscription noteworthy is the fact that it’s only a few years old, and it’s not even a permanent subscription. As Taco Bell Rewards members know all too well, only they can cop a Taco Lover’s Pass, and it only comes available every so often.

Most times, members have just one day to grab a pass. However, people had two whole days to decide the last time it became available.

And now, Exhibit B, the Nacho Fries Lover’s Pass.

An LTO Subscription and Item

Look, tens of millions of people love tacos. So, it’s logical that the Taco Lover’s Pass is so successful.

And if the past several years have shown us anything, millions of people also love Nacho Fries. The LTO menu item first appeared in Taco Bell restaurants in 2018. A few years later, in 2021, the Taco Lover’s Pass was tested in Arizona.

Why wouldn’t we eventually see a Nacho Fries Lover’s Pass, given the hype that follows every reintroduction of this popular item? Taco Bell has mastered the art of the LTO and the subscription. More specifically, they’ve mastered the recurring subscription. Remember, their passes aren’t permanent offerings.

Further, the iconic QSR also understands the power of the “drop.” At this point, it seems as though Taco Bell has noticed the rabid stir a limited-edition shoe or clothing drop can create for the fashion industry, studied it, and adapted it to foodservice.

With that said, the last Taco Lover’s Pass was accompanied by a menu item drop: the Toasted Breakfast Taco. If you think the Nacho Fries Lover’s Pass also ushered in an LTO, you’re correct.

The first-ever Nacho Fries Lover’s Pass comes along with the limited-time-only offer of Grilled Cheese Nacho Fries.

Take the Nacho Fries, slather them in a sauce of melted mozzarella, monterey pepper jack, and cheddar cheeses, add Taco Bell nacho cheese and chipotle sauce, and toss on some marinated steak. There you go—Grilled Cheese Nacho Fries. They’re just $4.99 while supplies last, and there’s a spicy version made with jalapeños.

It’s no surprise that Taco Bell is BrandVue’s most-loved Mexican restaurant brand, and number eight on their overall list of most-loved restaurant brands.

Takeaway

Loyalty and rewards programs, subscription services, hyped LTO menu drops… These aren’t the exclusive domain of global chain restaurants.

Independent operators can absolutely leverage LTOs and subscriptions. Moreover, indies can do so with as much—if not more—specificity. Independent and regional chain operators tend to be far more nimble than their large chain counterparts.

After all, it’s much easier to implement change in one or a handful of restaurants than it is hundreds or thousands of locations. In theory, single-unit operators also know their loyal guests on a more intimate level. Where that’s the case, they should know what levers to pull to generate interest and encourage repeat visits.

It’s no small task to create a subscription program, let alone a free-to-use-but-engaging, branded rewards program. And that’s to say nothing of coming up with menu item so powerful that taking it away for months at a time is a feasible, profitable thing to do. Although, if you’ve shrunk your menu and eliminated a decent food or drink performer, you may have somewhere to start.

With time and thoughtful consideration, independent and regional operators can absolutely nail rewards, subscriptions, and LTOs.

Image: Taco Bell

Bar Nightclub Pub Brewery Menu Development Drinks Food

by David Klemt David Klemt No Comments

DoorDash Names 2023 Global F&B Trends

DoorDash Names 2023 Global F&B Trends

by David Klemt

Chef torching salmon sushi

As we get close to winding down 2023 and welcoming 2024, DoorDash takes a shot at identifying the global F&B trends to watch.

This is an exciting and insightful time of year for our industry. In the last quarter, different sources start publishing their data-backed F&B predictions for the year ahead.

Take, for example, Technomic’s Global, Canadian, and American trend predictions for 2023. Oh, and don’t worry—we’ll be taking a look at their predictions for 2024 soon.

Today, however, we’re checking in on DoorDash. Admittedly, I’m not the biggest fan of third-party delivery. It’s no secret I favor direct delivery for operators.

There’s no denying, though, that third-party delivery companies have access to valuable data. From the top food and drink orders to the dayparts seeing the most delivery and pickup order growth, they can help operators see shifts in consumer behavior.

So, I’m happy to take a look at what food trends DoorDash thinks operators should watch moving forward.

Before we jump in, I’m happy that DoorDash includes this cautionary statement in their article: “Finally, always consider whether or not a trend actually fits in at your restaurant.”

At KRG Hospitality, we couldn’t agree more. Jumping on every trend, as tempting as that may be, is unwise and can do harm than good. So, while the lists below identify trends that are gaining traction currently, operators need to be discerning.

Food Trends

Let’s start with a trend multiple sources identified toward the end of 2022 that appears to still be on an upward trajectory: pickles.

Seriously, it seems that people can’t get enough pickles. Pickle pizza appears to the current darling when it comes to this food trend. Speaking of pizza, DoorDash sees square pizzas as a trend to watch.

Another trend that multiple sources have been keeping tabs on is chimichurri. According to DoorDash, this condiment is finding its way onto all manner of food item.

Other food trends that operators should be aware of are bowls (deconstruct a sandwich, burrito, etc., and you have a bowl); oyster mushrooms subbing in for meat; higher-end tinned fish; and gluten-free menu options.

To be honest, I don’t think that last one is just a trend. At this point, offering gluten-free options or entire menus is mainstream.

Now, there are two more food trends I want to address separately. One, smaller menus. This is a trend I believe most operators can and should get behind. Shrinking a menu can result in lower food and labor costs, and a happier team. Making a menu smaller can also make a restaurant more nimble and engaging as LTOs may have more impact.

And then there’s aburi sushi, which is presented after the top of the fish is torched. This gives sushi a smoky flavor and brings in a different texture element.

To be fair, I’ve expected this to take off for the past several years. Now, it appears it’s taking hold and moving from fad to trend.

TikTok Trends

Yes, we have to talk about TikTok. There’s no question that the platform is a trend-producing powerhouse.

Clearly, TikTok has an influence on food trends. If you want to know what your younger guests want to try, check TikTok. The same goes for your guests who are highly engaged with social media influencers.

Below, the trends DoorDash sees taking hold.

  • Chopped sandwiches. Do you have sandwiches on your menu? Can your guests watch as your team makes them? You may want to create a chopped version of your signature or best-selling sandwich.
  • Pasta salad summer. Apparently, this summer was the Summer of Pasta Salad. Specifically, pasta salads made with fresh ingredients, and made without ingredients like mayonnaise.
  • Cottage cheese. According to DoorDash, TikTokers are putting cottage cheese in scrambled eggs, adding it to pasta sauce, and using it to make cheese toasts. I’ve personally tried the TikTok trend of using cottage cheese to make nacho cheese sauce.

One word of caution: TikTok trends come and go in the blink of an eye. So, operators need to hop on trends that work with their restaurant or bar before they’re already out of favor. It’s a daunting task.

To review this DoorDash report in its entirety, including beverage and grocery trends, follow this link.

Image: Ivan Samkov on Pexels

Bar Nightclub Pub Brewery Menu Development Drinks Food

by David Klemt David Klemt No Comments

2023 DoorDash Ordering Trends

2023 DoorDash Ordering Trends: Canada & US

by David Klemt

Canada and the United States of America on a globe

After checking out this year’s annual Cravings Report we’re turning our attention to the 2023 DoorDash restaurant ordering trends reports.

Luckily, there are two reports available from DoorDash: one that focuses on Canada, and one for the US.

These two countries are, of course, KRG Hospitality’s primary markets. So, the data in these DoorDash reports is relevant and compelling for our current and future clients.

Perhaps unsurprisingly, Canadian and American DoorDash users are somewhat similar by a few metrics. However, where there are differences they’re fairly glaring.

For example, 78 percent of Canadian DoorDash survey respondents picked up a takeout order from a restaurant in the month prior to being surveyed. That number is 76 percent for American survey respondents.

Regarding in-person restaurant dining, 62 percent of respondents had done so the month prior. Among American survey respondents that number is 61 percent.

But when it comes to placing an order for delivery we see a notable difference. For Canada, 58 percent of survey respondents had ordered delivery. That number jumps to 77 percent among Americans.

This tells me a few (fairly obvious) things. Generally speaking, it appears consumers in Canada and America—according to DoorDash—prefer delivery and takeout to in-person dining. Going further, it seems that overall, Canadians prefer pickup or takeout to delivery. However, Americans seem to place delivery and pickup orders at nearly identical rates.

If it’s true that consumers favor delivery or takeout to in-person dining currently, there could be a couple of simple reasons. First, convenience.

Second, fees. It’s possible that today’s consumer perceives delivery fees are lower than in-person dining fees, unfortunately. If that’s the case, third-party delivery services can exploit this perception.

More Similar than Different

In comparing both DoorDash reports, I find that Canadian and American consumers who use DoorDash are rather similar.

Survey respondents in both countries indicate that Friday is the most popular day of the week to order food. Further, 6:00 PM is the most common local time to place orders in both countries.

And when it comes to the fastest-growing dayparts for order placement? In both Canada and the US it’s late-night and breakfast. Although, I most note that both dayparts are growing faster in Canada.

Nearly half of American respondents and a little over half of Canadian respondents indicate they want to try new restaurants and dishes.

Definitely not surprisingly, consumers in both countries primarily focus on menu selection and pricing when seeking a new restaurant to try. In fact, these numbers are identical for Canadians and Americans, at 55 percent and 51 percent, respectively.

Top Canadian Food Orders

When we look at the top items ordered via DoorDash, we don’t find anything out of the ordinary.

  1. Burgers
  2. Fries
  3. Pizza
  4. Salad
  5. Sandwiches

Looks like standard fare and comfort foods to me. This tells me that operators who have these items on their menus need to ensure they’re of the highest quality to stand out from other restaurants and bars.

Top American Food Orders

Interestingly but not too surprisingly, the list below is quite similar to the list above.

  1. French fries
  2. Burgers
  3. Tacos
  4. Salad
  5. Pizza

With the exception of tacos and sandwiches, the list is nearly identical.

Hey, who wants to debate whether tacos and sandwiches are in the same food family?

I encourage you to review both reports in their entirety for yourself. For the Canadian Edition of DoorDash’s report, click here. And click here for the US edition.

Image: Lara Jameson on Pexels

Bar Pub Brewery Nightclub Club Nightlife Technology Plan Tech Stack

by David Klemt David Klemt No Comments

2023 Cravings Report: “The Most” Orders

2023 Uber Eats Cravings Report: “The Most…” Orders

by David Klemt

Kentucky Fried Chicken packaged for delivery or pickup

Let’s take a look at the top orders, delivery requests, order combinations, surprising pairings, and more from the 2023 Uber Eats Cravings Report.

It appears that the chicken sandwich dominance we’ve seen over the years is winding down. At least, that seems to be the case among Uber Eats users.

As you’ll see below, not only is the chicken sandwich not the most popular item, it’s not even among the top five. It does edge out the cheeseburger and wings among the most popular combos, but it doesn’t outperform French fries and salt as a combo.

Another eyebrow-raising detail? Pizza doesn’t show up anywhere among the most ordered items, most popular combos, or even the most surprising combos.

Now, if you’re curious about the 2022 Uber Eats Cravings Report, you’re in luck. You can click here for the top food orders from that report, and here for the top beverage orders.

The Most…Ordered Items

  • French fries
  • Garlic naan
  • Pad Thai
  • Miso soup
  • California roll

Am I the only one who expected to see burgers, chicken sandwiches, and pizza on this list?

The Most…Popular Combos

  1. Burrito bowl + cheese
  2. French fries + salt
  3. Chicken sandwich + shredded lettuce
  4. Cheeseburger + mustard
  5. Wings + ranch

Fairly standard, really. Every one of these orders makes complete sense. Now, the category coming up next…it’s a different story.

However, before we move on, let’s compare these items to those found on the 2022 Uber Eats Cravings Report.

Interestingly, the number-one item is nearly identical: burrito + cheese. And French fries + salt is the second most-popular item on both lists.

The Most…Surprising Combos

  1. Steak + jelly
  2. Cottage cheese + mustard
  3. Condensed milk + avocado
  4. Seaweed + pasta sauce
  5. Butter + pickled onions

I really have nothing to say after reviewing this short list. I mean…hey, do your thing, everyone. Make your order yours.

To the operators out there, be ready for some odd order combos.

The Most…Popular Requests

  1. No onions
  2. Dressing on the side
  3. Ranch
  4. Extra soy sauce
  5. Spicy
  6. Sauce on the side
  7. No lettuce
  8. No jalapenos
  9. Extra gravy
  10. No slaw

Looking at the top request, Uber Eats has a theory as to what’s driving it: the return to the office.

People, it appears, are self-conscious about their breath in an in-person, face-to-face setting.

The Most…Popular Food and Alcohol Combos

  1. Ribeye + Vodka
  2. Cheeseburger + Frozen Margarita
  3. Chicken + Frozen Piña Colada
  4. Lobster tail + Apple whiskey
  5. Tamales + Daiquiris

Last year’s report reveals the following combos:

  1. Steak + Margaritas
  2. Pizza + White Claw
  3. Burritos + Margaritas
  4. Chicken + Sangria
  5. Wings + Beer

Overall, a lot of change from the 2022 Cravings Report to this year’s report.

Image: Nik on Unsplash

Bar Nightclub Pub Brewery Menu Development Drinks Food

by David Klemt David Klemt No Comments

Fantasy Sports, Sports Betting on the Rise

Interest in Sports Betting and Fantasy Sports Grows

by David Klemt

Wall full of American footballs behind large NFL logo

A recent CGA by NIQ On Premise Impact Report for August, 2023 reveals an interesting insight into consumer behavior and expectations.

To be clear, all the data on this new one-pager is useful. However, a particular revelation stands out from the rest, for me.

The CGA by NIQ US On Premise Impact Report for August 24, 2023 addresses:

  • total on-premise sales;
  • dining versus drinking occasions;
  • cost of living impact in the past month; and
  • consumer interest in fantasy sports and sports betting.

It’s that final bullet point that I find compelling. However, let’s check out the numbers for the first three points before we jump into sports.

To download your own copy, please click here.

August by the Numbers

In comparison to August 20, 2022, check value is up one percent to $50.09. Ticket count, however, is down one percent to 1,569.

As one would expect, dining occasions outweigh drinking occasions. Seventy percent of consumers have dined out in a restaurant or bar in the past two weeks.

Compared to July 2o23, that’s a two-percent increase in dining traffic.

Over the course of the same amount of time, 40 percent of consumers have gone drinking in a bar or restaurant. That’s a decrease of one percent in comparison to July 2023.

Considering that many families travel in the month of August before kids head back to school (or to drop them off at university), these numbers make sense.

Of course, cost of living may also be impacting dining and drinking occasion. Most consumers report no changes to the frequency with which they go out for drinks. Some consumers even report going out more frequently for drinks. But some are also cutting back.

For example, 28 percent of consumers have decreased how often they go out for drinks. Eleven percent are consuming lower quality drinks when they do go out, and nine percent are decreasing the “quality” of the establishments they visit.

That said, 20 percent of consumers are increasing drink quality and 21 percent are increasing establishment quality per visit. Seventeen percent are increasing how often they go out for drinks.

Fantasy Sports & Betting

This, as you may have guessed, is the statistic that I find most compelling.

Fantasy sports and sports betting has been on the rise for some time in the US. Who among us isn’t the target of sports-betting-app ads when streaming or watching sports?

Sports bar operators and operators who can position themselves as sports fans’ “third spot” will find this next number interesting.

According to CGA by NIQ’s latest report, 63 percent of consumers revealed they had plans for NFL week one. Those plans included participating in daily fantasy sports or sports betting.

So, it would be wise for operators who will air NFL games this season to ensure they’re catering to fantasy football and sports betting fans. Becoming the hub for fantasy sports groups in your area can increase traffic, sales, and loyalty. And, of course, it opens up the door to many traffic- and revenue-generating sport- and team-themed LTOs.

Again, to download this new report for yourself, please click here.

Image: Adrian Curiel on Unsplash

KRG Hospitality. Gaming. Entertainment. Consultant. Food Service. Bowling Alley. Golf. Simulator. Arcades. Eatertainment.

by David Klemt David Klemt No Comments

Top-performing Menu Items in the US

Top-performing Menu Items in the US (So Far)

by David Klemt

Barbecue chicken wings, chili peppers, and chili flakes

Thanks to a recent mid-year report from F&B intelligence platform Datassential, we now know the top-performing menu items in the US.

For the low, low price of filling out a handful of fields, you can download a copy of Datassential’s “Foodbytes: 2023 Midyear Trend Report” for yourself.

There’s plenty of useful data packed into this short report. You may find some of the top food items a bit surprising.

But First…

Datassential does more than just list the top mid-year menu performers in their latest report. There are also a couple of interesting datapoints for operators to consider.

The first piece of information is an alarming statistic: 54 percent of consumers are of the belief that “tipping culture has gotten out of control.”

As we’ve reported earlier, it’s likely that a major driver of “tip fatigue” comes from retail. The expectation for consumers to tip at a restaurant, bar or nightclub is ingrained deeply in American culture.

However, consumers throughout America are being prompted to tip after just about every transaction they’re attempting to complete. In fact, it’s not just retail that has been encouraging (in some cases, guilting) people to tip. Some contractors are also adding tip lines when handing over tablets to clients so they can pay their invoices.

One result is that servers and bartenders are reporting lower tips; guests are so over tipping that they’re pushing back against the practice in venues where they’d traditionally have no problem doing so.

Of course, tip fatigue isn’t the only reason consumers are pushing back against tipping. Many people feel that operators should increase what they pay staff. Indeed, some people feel that operators are asking them to subsidize their employee pay. Whether they’d be happy to pay higher prices remains to be seen.

Fads Aren’t Bad?

Whenever we cover trends or discuss them with clients, we caution against chasing too many (or the “wrong” trends). And fads? It can be even riskier to hop on the bandwagon of something that may never even reach the trend stage of its lifecycle.

However, likely due to the ubiquity of TikTok, consumers expect restaurants to embrace fads. According to Datassential, 67 percent of consumers overall “want to see more fads at restaurants and retail.”

That number jumps to 74 percent when focusing on Millennials and Gen Z.

So, while we still caution operators about jumping on fads (or “micro trends”) and trends, that doesn’t mean be too cautious. If a fad or trend works with your brand and won’t cost much to feature, at least give it consideration.

Not sure you’re great at identifying fads that will work for your business? Ask your staff which fads and trends are hot at the moment.

Speaking of Hot…

Alright, let’s take a look at the F&B items Datassential identifies as popular at the midway point of 2023.

Again, I encourage you to download the report in its entirety. You can do just that by clicking here.

But for those who want instant gratification, check out these menu items:

  • Super Duper: Let’s kick things off with the hottest chain LTO, the Denny’s Super Slam. Per Datassential, restaurant chains have already featured in excess of 2,000 LTOs in 2023. The F&B intel agency tests them all, and the Super Slam is wearing the LTO crown at the moment.
  • Chef Chatbot: Datassential tapped ChatGPT to create a burger recipe and had Midjourney create an image for the resulting Caprese Avocado Burger. More than half of consumers surveyed—57 percent—want to try it at a restaurant.
  • Big Winner: Datassential asked consumers a simple question: Which would you rather eat for the rest of your life, a hamburger or a hot dog? A staggering 87 percent chose hamburgers, meaning just 13 percent of consumers would choose a hot dog over it’s burger buddy.
  • What a Pickle: Back in March we checked out Slice’s Slice of the Union report, and it predicted pickle pizzas would be a hot trend this year. Well, Datassential has crunched the numbers and says 40 percent of consumers are aware of this pizza style already. Looks like Slice may be proven right by the end of the year.
  • Speed Demon: Curious about the fastest-growing menu item on the US? Well, wonder no more: Datassential says it’s the barbecue chicken wing. Over the past year, they’ve grown 373 percent on menus across the States. Datassential posits the overall growth of chicken and the embracing of flavor trends like Carolina gold barbecue sauce are contributing factors.

There’s a lot to unpack here, so I’ll leave you to it. Just remember that when it comes to fads and trends, there’s a fine line between what’s hot, what’s not, and jumping on the wrong one. Good luck!

Image: Ahmed Bhutta on Pexels

KRG Hospitality Start-Up Restaurant Bar Hotel Consulting Consultant Solutions Plans Services

by David Klemt David Klemt No Comments

Do Super Bowl Ads Work on Consumers?

Do Super Bowl Ads Work on Consumers?

by David Klemt

Pepsi Zero Sugar bottle

One of the biggest Super Bowl ad winners is Pepsi Zero Sugar.

Brands spent hundreds of millions of dollars to advertise during Super Bowl LVII, but do their ads actually translate to demand for their products?

A week ago we shared our ten favorite beverage-focused Big Game ads. Along with those ads we shared some numbers.

One of those numbers was $7 million, the cost of a 30-second Super Bowl ad on Fox. Other numbers? $500 million and $700 million, the range of revenue it’s estimated that Fox generated this year from Super Bowl ads.

At this point, these ads and the Halftime Show have essentially become their own entities. Some people watch the Big Game for the ads, some for the show halfway through. It stands to reason that brands are well aware of this development. So, they try to create the most impactful ad possible in the hopes of generating consumer demand.

In other words, these brands aren’t spending all this money just so they’re commercial can be deemed cool. Sure, brands want that buzz. But they also want an ROI on the millions they spend.

The big question is, then, are they seeing a return? Well, it just so happens that behavioral insight platform Veylinx has a data-driven answer to that question.

In short, the answer is yes. Of course, it’s a nuanced yes. For example, it appears Gen Z doesn’t care much about Super Bowl ads, as you’ll see below. Also, non-advertisers in the same categories as Super Bowl advertisers appear to see a benefit from the ads.

You’ll learn more from the Veylinx press release below. It’s an interesting read with valuable data for restaurant, bar, and hotel operators.

NEW YORK, Feb. 22, 2023 — A new study from behavioral research company Veylinx determined whether or not Super Bowl commercials boost consumer demand for the products advertised. The results show that 2023 Super Bowl advertising fueled a 6.4% increase in demand among viewers.

The overall increase in consumer demand was driven by women, who accounted for a 21% increase in demand growth. The commercials had minimal impact on men, yielding just 1% demand growth for the brands tested. Gen Z viewers were largely unimpressed by the Super Bowl ads, with demand among 18 to 25 year olds actually shrinking by 1%.

2023 Veylinx impact of Super Bowl ads on consumers chart

“It’s not really a surprise to see that Super Bowl ads improve sales, but the short term bump alone may not be enough to justify the $7 million price tag,” said Veylinx founder and CEO Anouar El Haji. 

Using Veylinx’s proprietary methodology—which measures actual demand rather than intent—the study tested purchase behavior during the week before the Super Bowl and again the week after. The research focused on measuring the change in consumer demand for eight brands with Super Bowl ads: Michelob Ultra, Heineken 0.0%, Hellmann’s Mayo, Downy Unstopables, Crown Royal Whisky, Frito-Lay PopCorners, Pringles and Pepsi Zero Sugar. 

Super Bowl Advertising Winners Overall

Michelob Ultra – 19% increase in demand

Pepsi Zero Sugar – 18% increase in demand

Frito-Lay PopCorners – 12% increase in demand

Heineken 0.0% – 11% increase in demand

Super Bowl Advertising Winners Among Women

Pepsi Zero Sugar – 45% increase in demand

Michelob Ultra – 40% increase in demand

Heineken 0.0% – 40% increase in demand

Crown Royal Whisky – 26% increase in demand

Veylinx, top performing brands during 2023 Super Bowl

Halo Effect for Non-Advertisers

The biggest winners were arguably brands in the same product categories as Super Bowl advertisers. Non-advertisers in those categories appeared to benefit nearly as much as the advertisers: demand grew by 4.2% percent for the study’s control group of non-advertising competitors. Corona Extra, Kraft Mayo and Lay’s STAX were the greatest beneficiaries in a control group that also included Budweiser Zero, Arm & Hammer Clean Scentsations, Canadian Club Whisky, Popchips, and Coke Zero Sugar. Notably, every non-advertiser saw at least a slight increase in post-Super Bowl demand.

“The goal of our study was to look specifically at how consumer demand is affected by running a commercial during the Super Bowl,” El Haji said. “It’s possible that the non-advertisers deployed other marketing efforts to offset or take advantage of the Super Bowl advertising—or they simply benefited from increased exposure for their categories.” 

Additional Findings

Study participants also answered a series of follow-up questions about their preferences, perceptions and how they watched the Super Bowl. More than three-quarters watched at home through various platforms, the most popular being the live cable/satellite broadcast (38%), followed by YouTube TV (15%) and Hulu (10%). When asked why they watched, it’s no surprise that participants were all about the game (64%)—but the commercials were the next most popular reason for watching (39%), followed by halftime (35%), the social aspect (26%) and fear of missing out (13%). 

About the Research

Veylinx studied the behavior of 1,610 U.S. consumers pre- and post- Super Bowl LVII. Unlike typical surveys where consumers are simply asked about their purchase intent, Veylinx measures whether consumers will pay for a product through a real bidding process. Consumers reveal their true willingness to pay by placing sealed bids on products and then answering follow-up questions.

For more information about the study and the Veylinx methodology, visit info.veylinx.com/super-bowl

About Veylinx

Veylinx is the most realistic behavioral insights platform for confidently answering critical business questions during all stages of product innovation. To reliably predict demand, Veylinx captures insights through a Nobel Prize-winning approach in which consumers have real skin in the game. This is a major advance from traditional market research practices that rely on what consumers say they would hypothetically buy. Veylinx’s unique research methodology is trusted by the world’s largest and most innovative consumer goods companies.

Main article image: PepsiCo / Article body images: Veylinx

KRG Hospitality Bars & Lounges, 2023 icon

by David Klemt David Klemt No Comments

Global Trends 2023: Technomic

Global Trends 2023: Technomic

by David Klemt

Shawarma stacked with fire in the background

Not content to focus solely on North America, foodservice research firm Technomic is predicting foodservice trends that will span the globe in 2023.

As the firm points out themselves, making predictions is a best-guess proposition. Many of Technomic’s 2022 predictions for Canada, the USA, and the globe have proven true. However, a handful of their trend predictions have yet to manifest.

Further, not all trends will work for all operators and their concepts. Chasing every passing fad or trend is great if you like to watch your costs spiral. Doing so is also an excellent way to confuse guests and stress staff.

So, when considering any trend, make sure it works with your concept, has some staying power, and will resonate with your guests. Speaking to that last point, this is one reason it’s crucial to collect guest data. Making important menu and guest-impacting operational decisions without data just doesn’t make sense.

When you’re done with this article, take a look at our examination of Technomic’s other predictions. The firm’s Canadian predictions are here. And you can read the American trends by clicking this link.

For your own copy of Technomic’s international trends report, click here.

Operations

For 2023, Technomic is making predictions that certainly appear plausible. A number of them pertain to operations.

Kicking things off, sustainability. Driven in part by the global impact of the pandemic, the health of our planet is top of mind for many people.

For example, Canada’s single-use plastics ban is now in effect. England plans to move forward with a similar ban by October of this year.

Alongside such bans, Technomic believes operators—small independents and global chains alike—will implement entire sustainability strategies. These will range “from packaging and restaurant operations to marketing and menu development.”

Does your concept have a dedicated pickup window? Perhaps a takeaway counter? Maybe even a drive-thru? If not, 2023 may be the year you make that change. Not only that, you’ll likely want to position them front and center.

Per Technomic, many consumers are done with delivery. From rising costs outweighing convenience to delivery failures, pickup may become more appealing. Pickup is still convenient, it’s less expensive, and the consumer is in control.

Additionally, many people are well aware of how costly third-party platforms are to operators. In fact, Technomic identifies these platforms and their fees as “the biggest industry villain” of 2023.

Menu

One of Technomic’s predictions is particularly enticing: Lebanese street foods. To clarify, the firm believes all manner of street foods from around the globe will perform well in 2023.

However, they feel Lebanon’s street foods will stand out from the rest. So, think shawarma, labneh, kibbe, and pickled vegetables. That last item, by the way, follows Technomic’s prediction that pickling and fermenting will be hot trends in the US and Canada.

Of course, there are other items that Technomic thinks will shine in 2023. If the firm is correct, there’s a new “holy trinity” to keep an eye on and consider for your menu: sushi, poke, and ceviche. According to Technomic, each performs very well when it comes to takeout.

Interestingly, the research firm suggests that this particular holy trinity will spawn new virtual brands. If Technomic’s predictions prove accurate, some of these brands will focus on fried chicken or plant-based versions.

Speaking to that last point, Technomic is predicting that plant-based will “evolve” in 2023. This evolution will focus on more traditional meat counterparts. Providing examples, Technomic suggests that avocado, modern takes on black bean patties, cauliflower, tofu, tempeh, and seitan will be this year’s plant-based rock stars.

Are this year’s 2023 Technomic predictions going to prove accurate? It’s far too early to tell. However, one thing I can say with confidence is this: their predictions are rooted deeply in data. When Technomic makes a “guess,” it’s always an informed one.

Click here to read Technomic’s report in its entirety.

Image: Slashio Photography on Unsplash

KRG Hospitality Restaurants & Cafes, 2023 icon

by David Klemt David Klemt No Comments

What’s Up with Meat, Poultry and Seafood?

What’s Up with Meat, Poultry and Seafood?

by David Klemt

Barbecue food plate on wooden table

We know how plant proteins are performing with consumers but what do we know about how meat, poultry, and seafood are doing?

Well, because of a recent report from Datassential, we know many consumers are “meat-limiters.” And research from the World Resources Institute shows that plant-based performance is nuanced.

Interestingly, the performance of animal proteins on-premise appears to be following a beverage trend: Moderation. According to Datassential, more consumers are reducing their consumption of meat and poultry than increasing it in comparison with 2021.

So, meat-limiters may be indicative of the future of meat consumption.

Consumer Shifts

As the name implies, meat-limiters are limiting or otherwise reducing their consumption of animal proteins. Importantly, it doesn’t appear that a significant percentage of consumers are eliminating animal proteins from their diets.

Rather, many people are simply increasing the amount of plant-based items they’re eating. However, that increase is more aspirational than real in some cases.

Per Datassential’s survey of 1,500 consumers in the US, just over 70 percent of people are meat eaters. In contrast, nearly 25 percent are “flexitarian.” Just two percent are vegan or pescatarian, and only three percent are vegetarian.

So, the vast majority of Americans are still consuming meat, poultry, and seafood. We just now have reason to believe that more consumers may be leaning toward a flexitarian diet.

A bit over a quarter of consumers consume meat every day. Still, many people aspire to eat more vegetables, fruits, and whole grains, per Datassential.

However, there are more pescatarians, vegans, and vegetarians among Gen Z than the overall population. According to Datassential, this could indicate a shift away from animal proteins in the future.

Meat Performance is Nuanced

Just like plant-based performance, meat performance is nuanced. There are many factors at play.

Shifts in what consumers value are driving changes to the performance of proteins. Health, sustainability, the climate, taste, and affordability have an effect on all proteins, animal and plant.

Undeniably, inflation and shaken consumer confidence are impacting protein performance. Everything, it seems, is more expensive at the moment. Generally speaking, animal proteins are pricier than plant-based items.

It makes sense, then, that some consumers are reducing their intake of animal proteins and filling that void with fruits, veggies, and legumes.

Of particular note are shifts in daily and weekly consumption of animal proteins in 2022. Meat consumption once or more per week—beef, lamb, pork, veal—is up three percent. However, there’s a ten-percent increase in consumers eating poultry once or more per week.

Interestingly, daily poultry consumption is down seven percent in comparison with 2021. Likewise, daily consumption of seafood is also down seven percent, and fewer people are consuming it less than once per week.

Plant-based is Down

Despite what some would think, meat-limiters don’t appear to be driving up plant proteins significantly.

In fact, according to Datassential, the daily consumption of plant-based proteins is down. Per the research firm, seitan, tempeh, and tofu are the experiencing the greatest drop in daily consumption.

The fact is that across generations, more consumers eat animal proteins on a daily basis than their plant-based counterparts. Gen Z, per Datassential, consumes more animal proteins on a daily basis than other generations.

So, how does it make sense that people are reducing their meat intake but plant-based isn’t seeing a sizable jump in consumption?

In part, the answer is the growing popularity of plant-forward dishes. These are items, like bowls, that offer a small amount of meat, poultry, seafood or dairy. The majority of these menu items consists of plants but are not free of animal proteins completely.

The path forward may indeed be a plant-forward menu. Of course, this is heavily reliant on a specific concept or brand. Still, it’s likely many restaurants can do well offering mixed dishes, those heavier on plant proteins than animal proteins.

Image: Peter Pham on Unsplash

Note: This article is based on information from Datassential’s “2022 Plant-Forward Opportunity” report. To access a number of free reports, sign up with Datassential today.

by David Klemt David Klemt No Comments

What Consumers Expect from Delivery

What Consumers Expect from Delivery

by David Klemt

Delivery or takeout food order in brown paper bag

Consumers are developing specific behaviors and opinions regarding delivery that impact their perception of restaurants and brands.

Over the course of two years and three surveys, Deloitte has attempted to learn more about consumers and delivery.

In total, Deloitte surveyed 1,550 restaurant customers. Additionally, the multinational interviewed highly positioned executives from ten casual, fast-casual, and QSR brands.

What Consumers Want

First, it should come as no surprise that delivery is here to stay. None of Deloitte’s survey results indicate otherwise.

In fact, it appears that some consumers are showing an interest in additional delivery methods. Half of survey respondents are willing to try driverless or drone delivery.

More than half—64 percent—don’t expect to return to pre-pandemic dining habits by March of this year. Illustrating the habit of ordering takeout and delivery, 61 percent of respondents engage with restaurants that way at least once per week. That represents a 32-percent increase from June 2020 to September 2021.

When dining off-premise, 57 percent of Deloitte survey respondents prefer to place orders via an app. However, 40 percent of respondents prefer a restaurant’s own branded website or app. That shows that:

  1. A restaurant’s website matters. A significant percentage of consumers want to get information, get a feel for a restaurant, and place orders with a business directly.
  2. Direct delivery is feasible. Consumers want to know and feel as though they’re supporting a restaurant directly rather than a third-party business.

Own the Delivery Experience

Of course, quality is a concern with consumers who place delivery orders. This points to another pitfall regarding third-party delivery beyond the fees.

Unfair as it is, three out of five restaurant customer survey respondents have quality expectations. Specifically, they expect the same food experience off-premise as they receive on-premise. That means the same quality and the same freshness.

They also indicate that wait times of up to 30 minutes are acceptable. Here’s where the risk to restaurants comes into play. Consumers will fault the restaurant for late orders; cold food (or melted or room-temperature food for cold items); iced drinks becoming watered down; and other order issues even if they’re delivered by third-party services.

So, operators must look into and invest into what they can to improve the quality of delivery orders. Containers that keep hot food hot, French fries and other fried foods crisp, and cold foods cold are paramount.

Unfortunately, problems that occur after an order has left a restaurant—which are out of the business’ hands—are often attributed to the venue. Another reason, then, to consider and implement direct delivery.

Image: Yu Hosoi on Unsplash

by David Klemt David Klemt No Comments

Square: 2022 Threats & Opportunities

Square: 2022 Threats & Opportunities

by David Klemt

Square terminal in restaurant kitchen

As all hospitality professionals know, the past nearly two years is imposing rapid change on the industry, necessitating rapid, strategic adaptation.

The key word in the above sentence isn’t “adaptation,” it’s “strategic.”

Of course, it’s hard to make strategic choices without as much information as possible.

To that end, we’ve reviewed Square‘s recently released “Future of Restaurants: 2022 Edition.” This is the company’s second annual Future of Restaurants report.

Square partnered with Wakefield Research, surveying 500 operators and 1,000 consumers to identify 2022 threats and opportunities.

Threat: Labor Shortage

Most operators aren’t going to want to read this prediction from Square. However, we can’t identify and adapt for opportunities if we don’t acknowledge threats.

Per Square’s report, the labor shortage may never see a correction. In other words, welcome to yet another new normal.

More than 70 percent of operators say they’re facing a labor shortage, per Square. Just over 20 percent of available positions were, at the time the survey was conducted, unfilled.

Instead, operators will likely, according to Square, need to make operational and work culture changes:

  • Improve working conditions. For example, encouraging and acting on team feedback. Another example? Modernizing scheduling.
  • Ensure workers are being mentored and not simply managed.
  • Hire, train, assign tasks, and schedule more strategically to operate with a smaller team.
  • Offering incentives that entice higher-quality candidates to work for you.

One participant quoted in the Square report claims that QR code ordering dropped their labor cost percentage by 150 percent.

Threat: Lack of Tech

As SevenRooms suggested when looking forward to 2022, technology solutions can lessen the burden of labor shortages. That leads us to another big threat: failing to embrace tech.

Some operators bristle at the word “automation.” For many, it conjures an image of robots in the kitchen and delivering food to tables.

Obviously, we’re opposed to replacing staff with any form of automation. However, we support automating tasks if that means team members are better utilized.

Why not automate inventory? Why not automate online order filling? If it improves operations and the guest experience, automation is less threatening.

According to Square’s report, 62 percent of operators think automation is appealing for managing online, delivery, and contactless orders. Ninety percent of operators say that back-of-house automation—if staff can focus on more important tasks—is a good idea.

More than 90 percent think automated inventory is an appealing solution.

It has taken a lot of time for hospitality to catch up to other industries in embracing tech. But Square reports that 36 percent of restaurants upgraded their business tech in 2021.

Of course, automation will become a threat if operators lean too heavily into it and stop paying attention to detail.

Phrased another way, be tech-savvy, not tech-reliant.

Opportunity: Omni-channel

Square see implementing an omni-channel strategy as the way forward. In fact, their general manager for Square Restaurants, Bryan Solar, said the following:

“We see the time of the dine-in only or takeout only as largely done forever.”

Going omni-channel (diversifying) in the restaurant space means making online ordering and delivery important elements within the overall business strategy. To that end, Solar posits kitchens will grow in size to better handle online orders.

Square’s survey reveals some intriguing numbers:

  • 13 percent of consumers say they’ll avoid restaurants that don’t offer online ordering.
  • Among restaurants with online ordering, those channels generate 34 percent of their revenue.
  • Over the past year, 54 percent of restaurants either added or expanded online ordering channels.
  • Online ordering is likely here to stay: 69 percent of respondents plan to offer it post-Covid-19.
  • 24 percent of operators are planning to allow guests to order alcohol from them online.

Another interesting set of numbers pertains to first- and third-party delivery. As we’ve stated several times, we much prefer operators offer first-party or direct delivery. According to Square, 49 percent of operators plan go direct delivery. More than half—62 percent—will pursue third-party delivery. That suggests that some operators will offer both.

Opportunity: Direct Ordering

When it comes to engaging online guests, operators need to control the experience. As I wrote for another publication years ago, a restaurant or bar’s website is still very important.

This statistic proves that statement true: Per Square, 68 percent of online guests want to order via a restaurant’s website or app, not a third-party.

More than likely, a significant portion of those guests want to know they’re supporting a restaurant and its staff directly. Hence the importance placed on ordering via the website or their own branded app.

So, operators would do well to ensure their websites feature an ordering widget. Or, they can opt to have an app built (or at least skinned) for their business.

Opportunity: Kiosks

According to Square’s survey results, 79 percent of consumers prefer ordering from kiosks over ordering from staff.

Most consumers and operators likely associate ordering kiosks with fast food restaurants. However, other categories can also benefit from these devices.

Close to half—45 percent—identified it as a preference when ordering at a casual-dining restaurant.

And fine dining isn’t immune to the convenience of tech. A little over 20 percent of consumers prefer to order via kiosk in the fine-dining space.

Overall, kiosks speak to the guest desires for convenience and safety. More than a third indicated that ordering via digital menu is appealing because they don’t have to touch a menu someone else has touched. And 37 percent like a digital option because they don’t have to wait for a server to bring them a physical menu.

Eleven percent of Square survey respondents will avoid a restaurant if they don’t offer digital menus.

Nearly half (45 percent) of restaurants are planning to offer QR code menus post-Covid-19. Another benefit of digital menus is dynamic pricing. As costs fluctuate, operators can increase or reduce prices easily without printing new menus.

Outlook

Representing a stark contrast from 2020 survey results, nearly 60 percent of operators say the survival of their restaurants is a concern in 2022.

That’s still a high number but vastly lower than how operators answered about 2021. Last year, 92 percent of operators surveyed said they were worried about survival.

According to Square’s report, operators are looking past surviving and making long-term plans. That’s a welcome sign that confidence is improving.

To review Square’s “Future of Restaurants: 2022 Edition” report in its entirety, click here.

Image: Patrick Tomasso on Unsplash

by David Klemt David Klemt No Comments

Consumers May Keep Eating at Home

Consumers May Keep Eating at Home

by David Klemt

Friends and family around a dinner table at home

A recent report suggests that consumer interest in eating at home more will continue even after we return to “normal.”

This is the finding from a survey conducted by the Food Industry Association (FMI)l, formerly known as the Food Marketing Institute.

The FMI surveyed grocery shoppers to determine habits influenced by the pandemic.

Emphasis on Nutrition

I look to a wide variety of sources to analyze consumer behavior. Even their grocery habits can be valuable for operators to know.

In this case, knowing about the dining habits of today’s consumer provides important insights. For instance, knowing what types of food items shoppers are purchasing can be very telling.

Per the FMI, nearly half of survey respondents (49 percent) indicate they’re choosing healthier foods when grocery shopping. Clearly, living through a public health crisis is influencing this decision.

Today’s consumer, with more information at their fingertips and the purchasing power to demand more transparency from company’s, has become increasingly focused on their health. That interest grew stronger during the pandemic as a healthier lifestyle can lead to a reduced risk for illness.

This particular finding should tell operators a few things. First, they may want to consider updating their menus with healthier items. Second, that’s not limited to food—many guests are interested in no- and low-ABV drinks. Third, operators who use healthier ingredients should make that clear via their menu item descriptions.

At-home Dining

The FMI also found that 41 percent of survey respondents plan to prepare and enjoy more meals at home moving forward than they did before the pandemic.

That ties directly to 44 percent saying they “like” or ‘love” cooking at home more now.

While this survey was intended to provide consumer behavior insights for grocers, there’s clearly value for operators.

As many learned during the pandemic, guests are interested in supporting restaurants and bars buy ordering meal and cocktail kits.

Since it’s important to meet guests where they are, operators may want to keep such kits on offer. People have shown they’re eager to engage with restaurants and bars via virtual tastings and cooking classes. Clearly, many are also happy to order meal kits from restaurants to make in the comfort of their own homes.

Yes, there’s pent-up demand set to be unleashed. And yes, people are eager to get back out there and socialize. But there are also financial, health, and safety concerns that will keep some people from dining out as often as they did pre-pandemic.

That doesn’t mean they’re out of reach of restaurants and bars entirely. However, it does mean operators will need to adapt and get creative to earn their business.

Image: fauxels from Pexels

by David Klemt David Klemt No Comments

Rediscovering Your Guests in 2021

Rediscovering Your Guests in 2021

by David Klemt

Guests in a restaurant and bar

Labatt Breweries of Canada wants operators to get to know their guests all over again in 2021.

Luckily, this isn’t a massive undertaking. However, it requires commitment and an understanding of altered consumer behavior.

During the 2021 Restaurants Canada Show, Labatt presented “Rediscover Your Guest: The 2021 Consumer.”

Christina Veira, bar and beverage curator for the RC Show, hosted the digital session. Labatt panelists included Michelle Tham, head of education and certified Cicerone, and Megan Harris, director of insights and strategy. Casey Ferrell, vice president of US and Canada Monitors for Kantar Consulting rounded out the panel.

Who’s Your 2021 Guest?

The good news is that Canadians are still consuming beverage alcohol. The less-good news is that they’ve gotten used to drinking mainly at home.

In fact, per Megan Harris, 95 percent of beverage alcohol occasions now happen at home. Harris also says there’s excitement about a return to in-person restaurant and bar service. However, several pandemic-driven behaviors will persist, including:

  • Takeout
  • Delivery
  • Daytime drinking
  • Working from home

Guests are set to unleash a torrent of pent-up demand when they can safely return to restaurants and bars. They want to indulge themselves, have fun and new experiences, but also feel safe.

Generally speaking, younger guests are more tolerant of risk. Conversely, guests over 50 years old are more cautious.

Vaccine Influence

Per Ferrell, there are four distinct vaccine groups in Canada and the United States:

  • People have gotten a Covid-19 vaccine.
  • People who can’t wait to get a Covid-19 vaccine.
  • People who are unsure about Covid-19 vaccines.
  • People who refuse to get a Covid-19 vaccine.

Ferrell says to remove the final group on that list. Doing so shows that about two-thirds of Canadians (and Americans) are in the process of getting the vaccine. Therefore, operators need consider how to address vaccination safety along with vaccination requirements for guests and employees. For Ferrell, the best lever to pull is the one that addresses Covid-19 and vaccine risks.

Additionally, just because the calendar ticked over to 2021 doesn’t mean everything is different. Accordingly, Ferrell feels that Q1 is the “More of 2021” stage of this year. He expects people to open up their bubbles during possibly Q2 or Q3, the “Less Covid-19” stage. Parties that include multiple households will return in force in Q4.

How to Meet 2021 Guest Expectations

First, we must be cautious when people return to restaurants, bars and other venues en masse. That initial boost in traffic driven by pent-up demand will ebb quicker than one would expect.

To get people through the doors, operators will need to focus on:

  1. health and safety;
  2. staff expectations and training;
  3. social interactions and the joy deficit; and
  4. guest experience and journey.

Harris sums up the first point succinctly: Anything that can be touchless, should be touchless. Operators should expect contactless features to remain moving forward. The expectation for hygiene will also remain. Guests will want to see employees cleaning and sanitizing, for instance.

Speaking of employees, operators must address the role they’ll plan in crowd management. Unfortunately, management and employees will have to be ready to enforce health and safety protocols strongly.

As Ferrell notes, long-term lockdown means large swaths of the population need to re-learn how to interact with others. One way to drive guests through restaurant or bar doors is promoting the role they play in socializing. Hospitality businesses facilitate social interaction—it’s one of the industry’s greatest strengths. Equally, restaurants and bars fill people’s joy deficits.

Operators, says Harris, need to consider:

  • every way they can offer an experience guests can’t have at home;
  • how they can capitalize on the daytime drinking experience;
  • how to extend the guest experience—pre-visit and post-visit;
  • how to attract older guests to their venues;
  • leveraging patio spaces; and
  • focusing on messaging that promotes escapism and excitement.

Another interesting consideration concerns table distances. Every operator needs to weigh square feet per guest and distancing tables. Social distance will likely remain important to guests for at least a little while post-pandemic.

Bonus

Ferrell answered a question I asked about Las Vegas specifically. Dayclubs, which largely focus on elevating pool parties, are an integral part of Vegas hospitality.

So, how can they signal their commitment to health and safety as relates to infections?

Ferrell’s answer is that evidence appears to indicate that pools are Covid-19 infection spreaders. Therefore, dayclub operators should focus more on the crowd control aspect of health and safety. Additionally, messaging should focus on indulgence.

After all, says Ferrell, not much is more indulgent than saying, “I’m going to take the day for myself and go to a daylife venue.”

Image: Nick Hillier on Unsplash

Top