Consumer behavior

by David Klemt David Klemt No Comments

Fantasy Sports, Sports Betting on the Rise

Interest in Sports Betting and Fantasy Sports Grows

by David Klemt

Wall full of American footballs behind large NFL logo

A recent CGA by NIQ On Premise Impact Report for August, 2023 reveals an interesting insight into consumer behavior and expectations.

To be clear, all the data on this new one-pager is useful. However, a particular revelation stands out from the rest, for me.

The CGA by NIQ US On Premise Impact Report for August 24, 2023 addresses:

  • total on-premise sales;
  • dining versus drinking occasions;
  • cost of living impact in the past month; and
  • consumer interest in fantasy sports and sports betting.

It’s that final bullet point that I find compelling. However, let’s check out the numbers for the first three points before we jump into sports.

To download your own copy, please click here.

August by the Numbers

In comparison to August 20, 2022, check value is up one percent to $50.09. Ticket count, however, is down one percent to 1,569.

As one would expect, dining occasions outweigh drinking occasions. Seventy percent of consumers have dined out in a restaurant or bar in the past two weeks.

Compared to July 2o23, that’s a two-percent increase in dining traffic.

Over the course of the same amount of time, 40 percent of consumers have gone drinking in a bar or restaurant. That’s a decrease of one percent in comparison to July 2023.

Considering that many families travel in the month of August before kids head back to school (or to drop them off at university), these numbers make sense.

Of course, cost of living may also be impacting dining and drinking occasion. Most consumers report no changes to the frequency with which they go out for drinks. Some consumers even report going out more frequently for drinks. But some are also cutting back.

For example, 28 percent of consumers have decreased how often they go out for drinks. Eleven percent are consuming lower quality drinks when they do go out, and nine percent are decreasing the “quality” of the establishments they visit.

That said, 20 percent of consumers are increasing drink quality and 21 percent are increasing establishment quality per visit. Seventeen percent are increasing how often they go out for drinks.

Fantasy Sports & Betting

This, as you may have guessed, is the statistic that I find most compelling.

Fantasy sports and sports betting has been on the rise for some time in the US. Who among us isn’t the target of sports-betting-app ads when streaming or watching sports?

Sports bar operators and operators who can position themselves as sports fans’ “third spot” will find this next number interesting.

According to CGA by NIQ’s latest report, 63 percent of consumers revealed they had plans for NFL week one. Those plans included participating in daily fantasy sports or sports betting.

So, it would be wise for operators who will air NFL games this season to ensure they’re catering to fantasy football and sports betting fans. Becoming the hub for fantasy sports groups in your area can increase traffic, sales, and loyalty. And, of course, it opens up the door to many traffic- and revenue-generating sport- and team-themed LTOs.

Again, to download this new report for yourself, please click here.

Image: Adrian Curiel on Unsplash

KRG Hospitality. Gaming. Entertainment. Consultant. Food Service. Bowling Alley. Golf. Simulator. Arcades. Eatertainment.

by David Klemt David Klemt No Comments

Top-performing Menu Items in the US

Top-performing Menu Items in the US (So Far)

by David Klemt

Barbecue chicken wings, chili peppers, and chili flakes

Thanks to a recent mid-year report from F&B intelligence platform Datassential, we now know the top-performing menu items in the US.

For the low, low price of filling out a handful of fields, you can download a copy of Datassential’s “Foodbytes: 2023 Midyear Trend Report” for yourself.

There’s plenty of useful data packed into this short report. You may find some of the top food items a bit surprising.

But First…

Datassential does more than just list the top mid-year menu performers in their latest report. There are also a couple of interesting datapoints for operators to consider.

The first piece of information is an alarming statistic: 54 percent of consumers are of the belief that “tipping culture has gotten out of control.”

As we’ve reported earlier, it’s likely that a major driver of “tip fatigue” comes from retail. The expectation for consumers to tip at a restaurant, bar or nightclub is ingrained deeply in American culture.

However, consumers throughout America are being prompted to tip after just about every transaction they’re attempting to complete. In fact, it’s not just retail that has been encouraging (in some cases, guilting) people to tip. Some contractors are also adding tip lines when handing over tablets to clients so they can pay their invoices.

One result is that servers and bartenders are reporting lower tips; guests are so over tipping that they’re pushing back against the practice in venues where they’d traditionally have no problem doing so.

Of course, tip fatigue isn’t the only reason consumers are pushing back against tipping. Many people feel that operators should increase what they pay staff. Indeed, some people feel that operators are asking them to subsidize their employee pay. Whether they’d be happy to pay higher prices remains to be seen.

Fads Aren’t Bad?

Whenever we cover trends or discuss them with clients, we caution against chasing too many (or the “wrong” trends). And fads? It can be even riskier to hop on the bandwagon of something that may never even reach the trend stage of its lifecycle.

However, likely due to the ubiquity of TikTok, consumers expect restaurants to embrace fads. According to Datassential, 67 percent of consumers overall “want to see more fads at restaurants and retail.”

That number jumps to 74 percent when focusing on Millennials and Gen Z.

So, while we still caution operators about jumping on fads (or “micro trends”) and trends, that doesn’t mean be too cautious. If a fad or trend works with your brand and won’t cost much to feature, at least give it consideration.

Not sure you’re great at identifying fads that will work for your business? Ask your staff which fads and trends are hot at the moment.

Speaking of Hot…

Alright, let’s take a look at the F&B items Datassential identifies as popular at the midway point of 2023.

Again, I encourage you to download the report in its entirety. You can do just that by clicking here.

But for those who want instant gratification, check out these menu items:

  • Super Duper: Let’s kick things off with the hottest chain LTO, the Denny’s Super Slam. Per Datassential, restaurant chains have already featured in excess of 2,000 LTOs in 2023. The F&B intel agency tests them all, and the Super Slam is wearing the LTO crown at the moment.
  • Chef Chatbot: Datassential tapped ChatGPT to create a burger recipe and had Midjourney create an image for the resulting Caprese Avocado Burger. More than half of consumers surveyed—57 percent—want to try it at a restaurant.
  • Big Winner: Datassential asked consumers a simple question: Which would you rather eat for the rest of your life, a hamburger or a hot dog? A staggering 87 percent chose hamburgers, meaning just 13 percent of consumers would choose a hot dog over it’s burger buddy.
  • What a Pickle: Back in March we checked out Slice’s Slice of the Union report, and it predicted pickle pizzas would be a hot trend this year. Well, Datassential has crunched the numbers and says 40 percent of consumers are aware of this pizza style already. Looks like Slice may be proven right by the end of the year.
  • Speed Demon: Curious about the fastest-growing menu item on the US? Well, wonder no more: Datassential says it’s the barbecue chicken wing. Over the past year, they’ve grown 373 percent on menus across the States. Datassential posits the overall growth of chicken and the embracing of flavor trends like Carolina gold barbecue sauce are contributing factors.

There’s a lot to unpack here, so I’ll leave you to it. Just remember that when it comes to fads and trends, there’s a fine line between what’s hot, what’s not, and jumping on the wrong one. Good luck!

Image: Ahmed Bhutta on Pexels

KRG Hospitality Start-Up Restaurant Bar Hotel Consulting Consultant Solutions Plans Services

by David Klemt David Klemt No Comments

Do Super Bowl Ads Work on Consumers?

Do Super Bowl Ads Work on Consumers?

by David Klemt

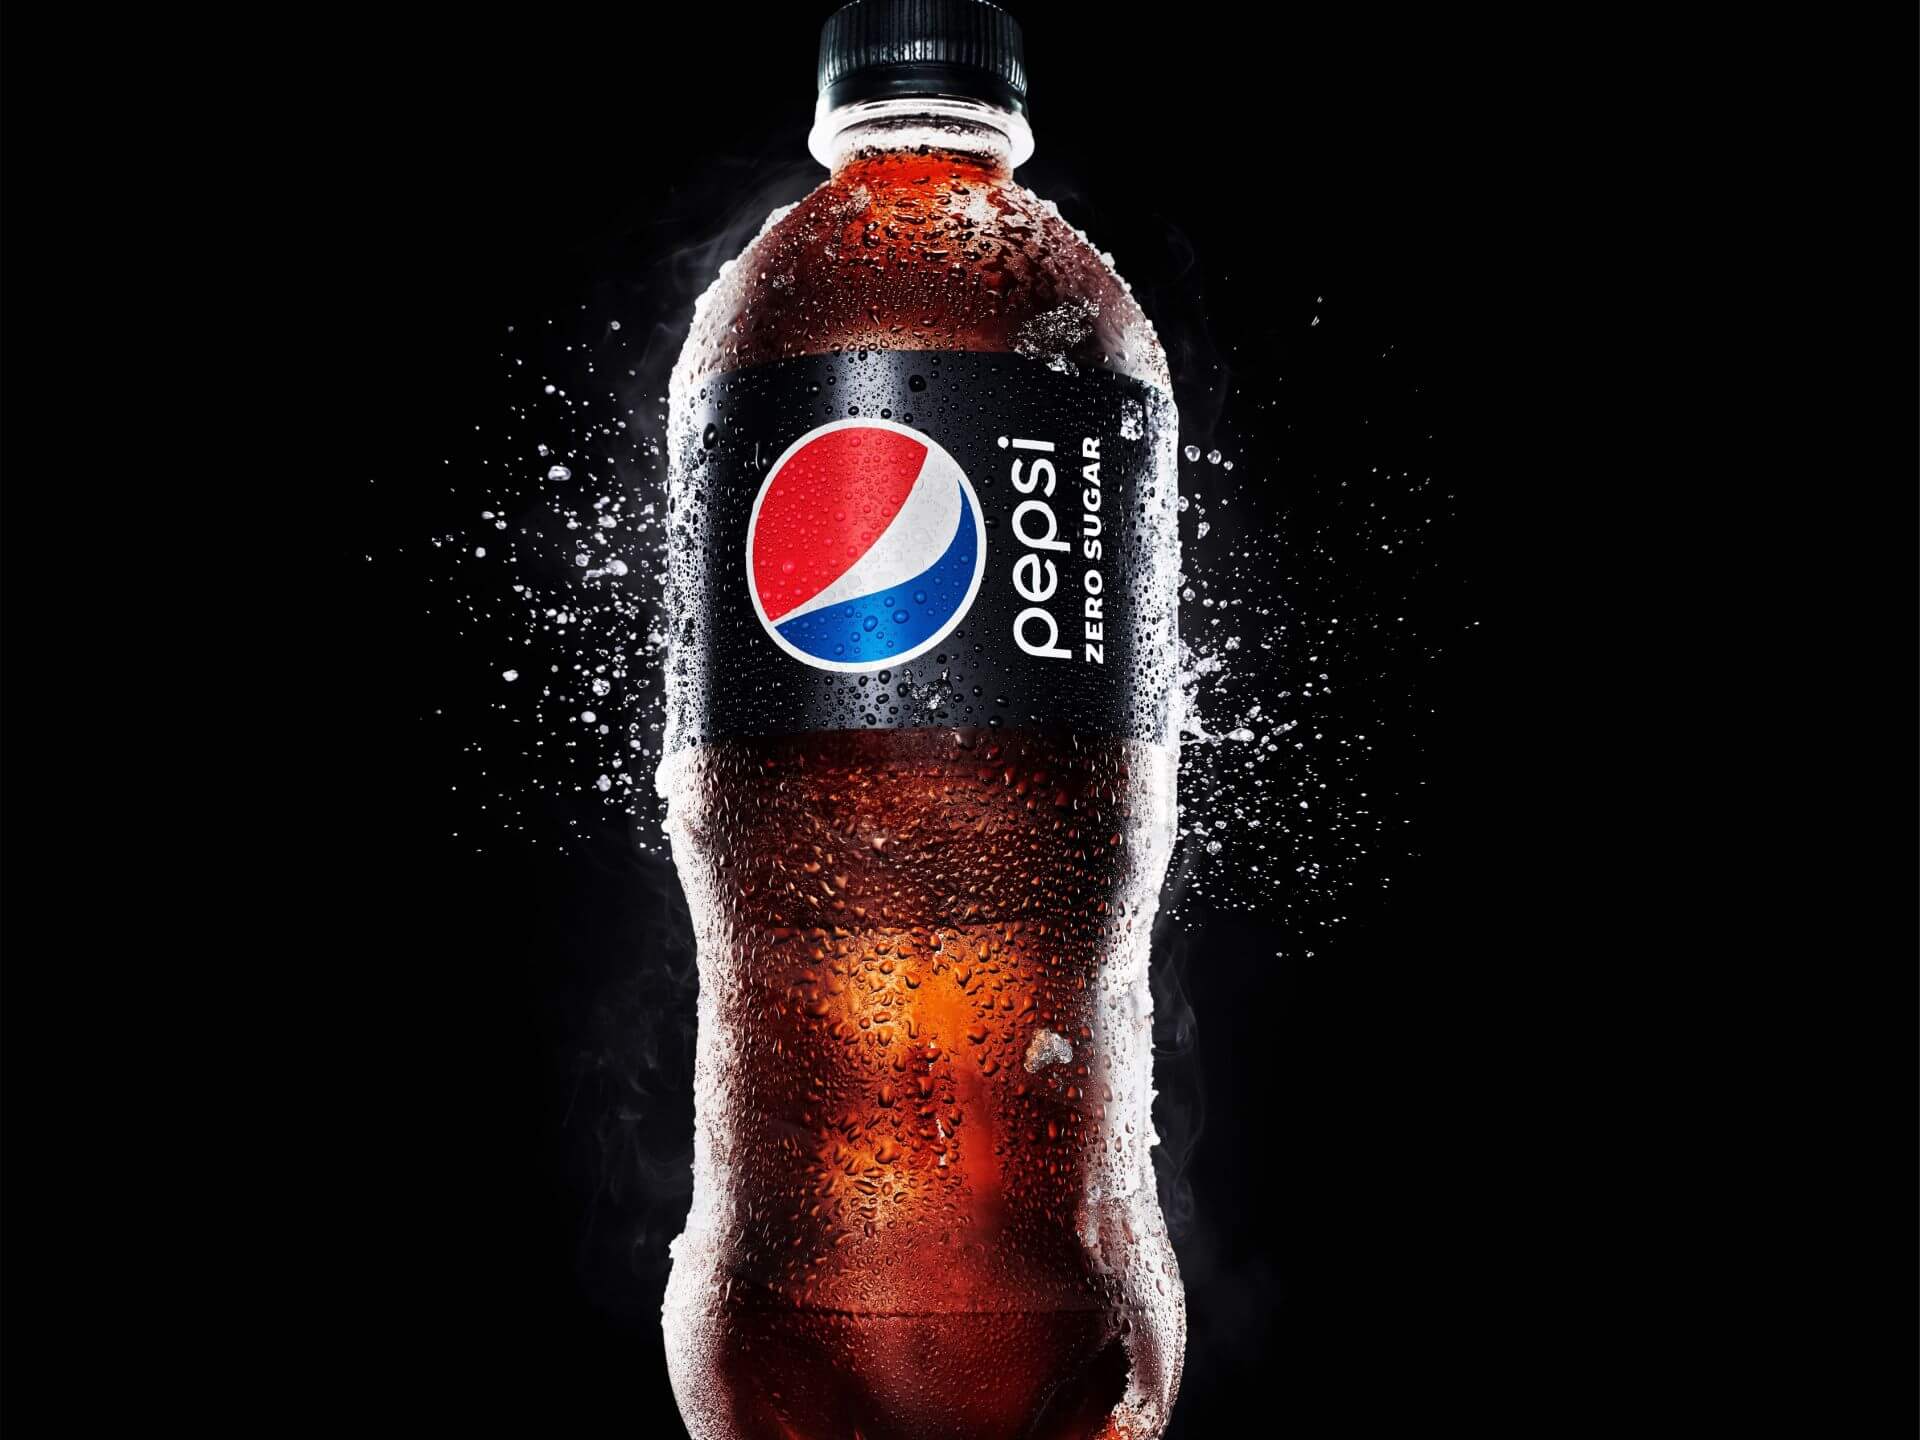
Pepsi Zero Sugar bottle

One of the biggest Super Bowl ad winners is Pepsi Zero Sugar.

Brands spent hundreds of millions of dollars to advertise during Super Bowl LVII, but do their ads actually translate to demand for their products?

A week ago we shared our ten favorite beverage-focused Big Game ads. Along with those ads we shared some numbers.

One of those numbers was $7 million, the cost of a 30-second Super Bowl ad on Fox. Other numbers? $500 million and $700 million, the range of revenue it’s estimated that Fox generated this year from Super Bowl ads.

At this point, these ads and the Halftime Show have essentially become their own entities. Some people watch the Big Game for the ads, some for the show halfway through. It stands to reason that brands are well aware of this development. So, they try to create the most impactful ad possible in the hopes of generating consumer demand.

In other words, these brands aren’t spending all this money just so they’re commercial can be deemed cool. Sure, brands want that buzz. But they also want an ROI on the millions they spend.

The big question is, then, are they seeing a return? Well, it just so happens that behavioral insight platform Veylinx has a data-driven answer to that question.

In short, the answer is yes. Of course, it’s a nuanced yes. For example, it appears Gen Z doesn’t care much about Super Bowl ads, as you’ll see below. Also, non-advertisers in the same categories as Super Bowl advertisers appear to see a benefit from the ads.

You’ll learn more from the Veylinx press release below. It’s an interesting read with valuable data for restaurant, bar, and hotel operators.

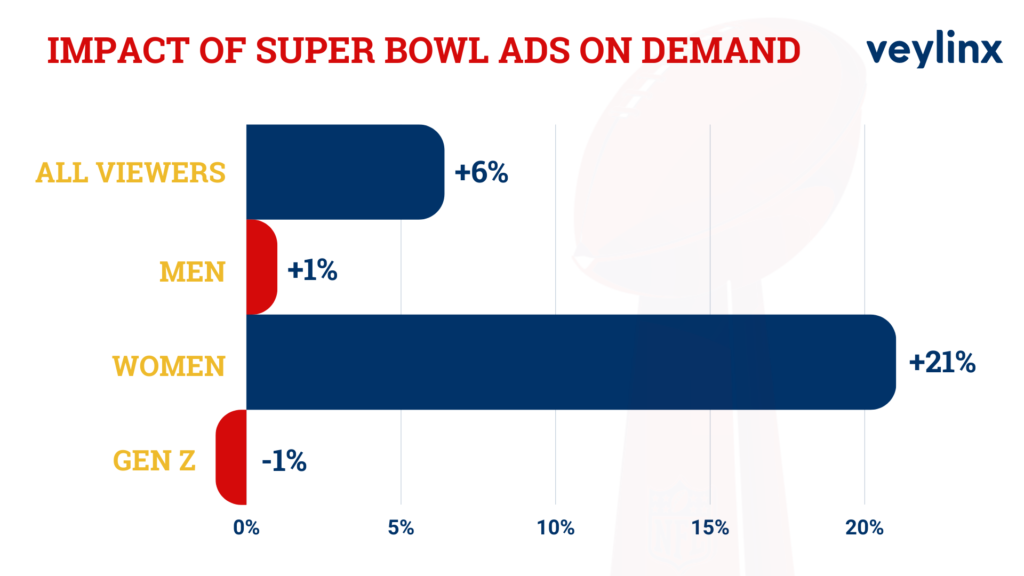
NEW YORK, Feb. 22, 2023 — A new study from behavioral research company Veylinx determined whether or not Super Bowl commercials boost consumer demand for the products advertised. The results show that 2023 Super Bowl advertising fueled a 6.4% increase in demand among viewers.

The overall increase in consumer demand was driven by women, who accounted for a 21% increase in demand growth. The commercials had minimal impact on men, yielding just 1% demand growth for the brands tested. Gen Z viewers were largely unimpressed by the Super Bowl ads, with demand among 18 to 25 year olds actually shrinking by 1%.

2023 Veylinx impact of Super Bowl ads on consumers chart

“It’s not really a surprise to see that Super Bowl ads improve sales, but the short term bump alone may not be enough to justify the $7 million price tag,” said Veylinx founder and CEO Anouar El Haji. 

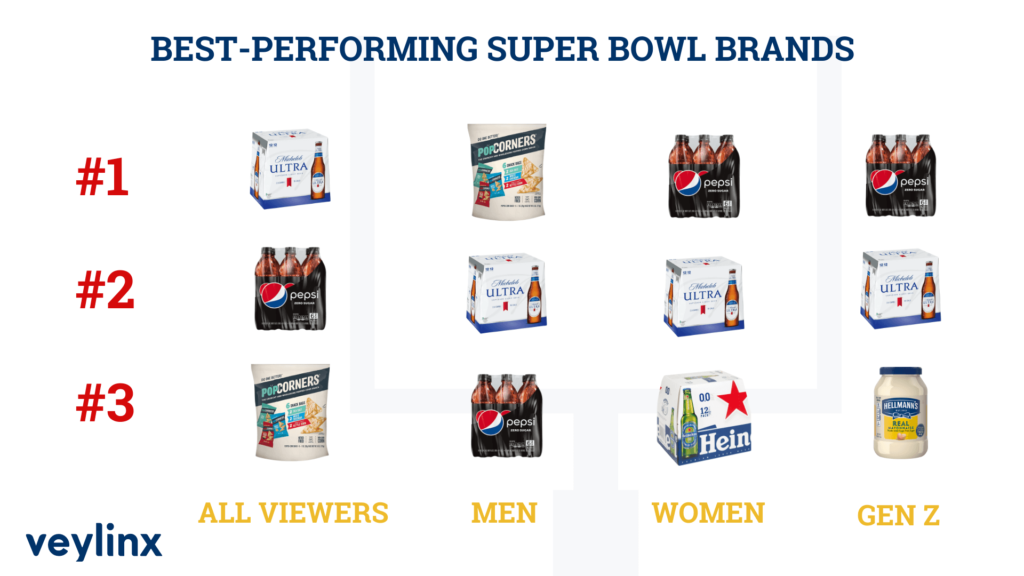
Using Veylinx’s proprietary methodology—which measures actual demand rather than intent—the study tested purchase behavior during the week before the Super Bowl and again the week after. The research focused on measuring the change in consumer demand for eight brands with Super Bowl ads: Michelob Ultra, Heineken 0.0%, Hellmann’s Mayo, Downy Unstopables, Crown Royal Whisky, Frito-Lay PopCorners, Pringles and Pepsi Zero Sugar. 

Super Bowl Advertising Winners Overall

Michelob Ultra – 19% increase in demand

Pepsi Zero Sugar – 18% increase in demand

Frito-Lay PopCorners – 12% increase in demand

Heineken 0.0% – 11% increase in demand

Super Bowl Advertising Winners Among Women

Pepsi Zero Sugar – 45% increase in demand

Michelob Ultra – 40% increase in demand

Heineken 0.0% – 40% increase in demand

Crown Royal Whisky – 26% increase in demand

Veylinx, top performing brands during 2023 Super Bowl

Halo Effect for Non-Advertisers

The biggest winners were arguably brands in the same product categories as Super Bowl advertisers. Non-advertisers in those categories appeared to benefit nearly as much as the advertisers: demand grew by 4.2% percent for the study’s control group of non-advertising competitors. Corona Extra, Kraft Mayo and Lay’s STAX were the greatest beneficiaries in a control group that also included Budweiser Zero, Arm & Hammer Clean Scentsations, Canadian Club Whisky, Popchips, and Coke Zero Sugar. Notably, every non-advertiser saw at least a slight increase in post-Super Bowl demand.

“The goal of our study was to look specifically at how consumer demand is affected by running a commercial during the Super Bowl,” El Haji said. “It’s possible that the non-advertisers deployed other marketing efforts to offset or take advantage of the Super Bowl advertising—or they simply benefited from increased exposure for their categories.” 

Additional Findings

Study participants also answered a series of follow-up questions about their preferences, perceptions and how they watched the Super Bowl. More than three-quarters watched at home through various platforms, the most popular being the live cable/satellite broadcast (38%), followed by YouTube TV (15%) and Hulu (10%). When asked why they watched, it’s no surprise that participants were all about the game (64%)—but the commercials were the next most popular reason for watching (39%), followed by halftime (35%), the social aspect (26%) and fear of missing out (13%). 

About the Research

Veylinx studied the behavior of 1,610 U.S. consumers pre- and post- Super Bowl LVII. Unlike typical surveys where consumers are simply asked about their purchase intent, Veylinx measures whether consumers will pay for a product through a real bidding process. Consumers reveal their true willingness to pay by placing sealed bids on products and then answering follow-up questions.

For more information about the study and the Veylinx methodology, visit info.veylinx.com/super-bowl

About Veylinx

Veylinx is the most realistic behavioral insights platform for confidently answering critical business questions during all stages of product innovation. To reliably predict demand, Veylinx captures insights through a Nobel Prize-winning approach in which consumers have real skin in the game. This is a major advance from traditional market research practices that rely on what consumers say they would hypothetically buy. Veylinx’s unique research methodology is trusted by the world’s largest and most innovative consumer goods companies.

Main article image: PepsiCo / Article body images: Veylinx

KRG Hospitality Bars & Lounges, 2023 icon

by David Klemt David Klemt No Comments

Global Trends 2023: Technomic

Global Trends 2023: Technomic

by David Klemt

Shawarma stacked with fire in the background

Not content to focus solely on North America, foodservice research firm Technomic is predicting foodservice trends that will span the globe in 2023.

As the firm points out themselves, making predictions is a best-guess proposition. Many of Technomic’s 2022 predictions for Canada, the USA, and the globe have proven true. However, a handful of their trend predictions have yet to manifest.

Further, not all trends will work for all operators and their concepts. Chasing every passing fad or trend is great if you like to watch your costs spiral. Doing so is also an excellent way to confuse guests and stress staff.

So, when considering any trend, make sure it works with your concept, has some staying power, and will resonate with your guests. Speaking to that last point, this is one reason it’s crucial to collect guest data. Making important menu and guest-impacting operational decisions without data just doesn’t make sense.

When you’re done with this article, take a look at our examination of Technomic’s other predictions. The firm’s Canadian predictions are here. And you can read the American trends by clicking this link.

For your own copy of Technomic’s international trends report, click here.

Operations

For 2023, Technomic is making predictions that certainly appear plausible. A number of them pertain to operations.

Kicking things off, sustainability. Driven in part by the global impact of the pandemic, the health of our planet is top of mind for many people.

For example, Canada’s single-use plastics ban is now in effect. England plans to move forward with a similar ban by October of this year.

Alongside such bans, Technomic believes operators—small independents and global chains alike—will implement entire sustainability strategies. These will range “from packaging and restaurant operations to marketing and menu development.”

Does your concept have a dedicated pickup window? Perhaps a takeaway counter? Maybe even a drive-thru? If not, 2023 may be the year you make that change. Not only that, you’ll likely want to position them front and center.

Per Technomic, many consumers are done with delivery. From rising costs outweighing convenience to delivery failures, pickup may become more appealing. Pickup is still convenient, it’s less expensive, and the consumer is in control.

Additionally, many people are well aware of how costly third-party platforms are to operators. In fact, Technomic identifies these platforms and their fees as “the biggest industry villain” of 2023.

Menu

One of Technomic’s predictions is particularly enticing: Lebanese street foods. To clarify, the firm believes all manner of street foods from around the globe will perform well in 2023.

However, they feel Lebanon’s street foods will stand out from the rest. So, think shawarma, labneh, kibbe, and pickled vegetables. That last item, by the way, follows Technomic’s prediction that pickling and fermenting will be hot trends in the US and Canada.

Of course, there are other items that Technomic thinks will shine in 2023. If the firm is correct, there’s a new “holy trinity” to keep an eye on and consider for your menu: sushi, poke, and ceviche. According to Technomic, each performs very well when it comes to takeout.

Interestingly, the research firm suggests that this particular holy trinity will spawn new virtual brands. If Technomic’s predictions prove accurate, some of these brands will focus on fried chicken or plant-based versions.

Speaking to that last point, Technomic is predicting that plant-based will “evolve” in 2023. This evolution will focus on more traditional meat counterparts. Providing examples, Technomic suggests that avocado, modern takes on black bean patties, cauliflower, tofu, tempeh, and seitan will be this year’s plant-based rock stars.

Are this year’s 2023 Technomic predictions going to prove accurate? It’s far too early to tell. However, one thing I can say with confidence is this: their predictions are rooted deeply in data. When Technomic makes a “guess,” it’s always an informed one.

Click here to read Technomic’s report in its entirety.

Image: Slashio Photography on Unsplash

KRG Hospitality Restaurants & Cafes, 2023 icon

by David Klemt David Klemt No Comments

What’s Up with Meat, Poultry and Seafood?

What’s Up with Meat, Poultry and Seafood?

by David Klemt

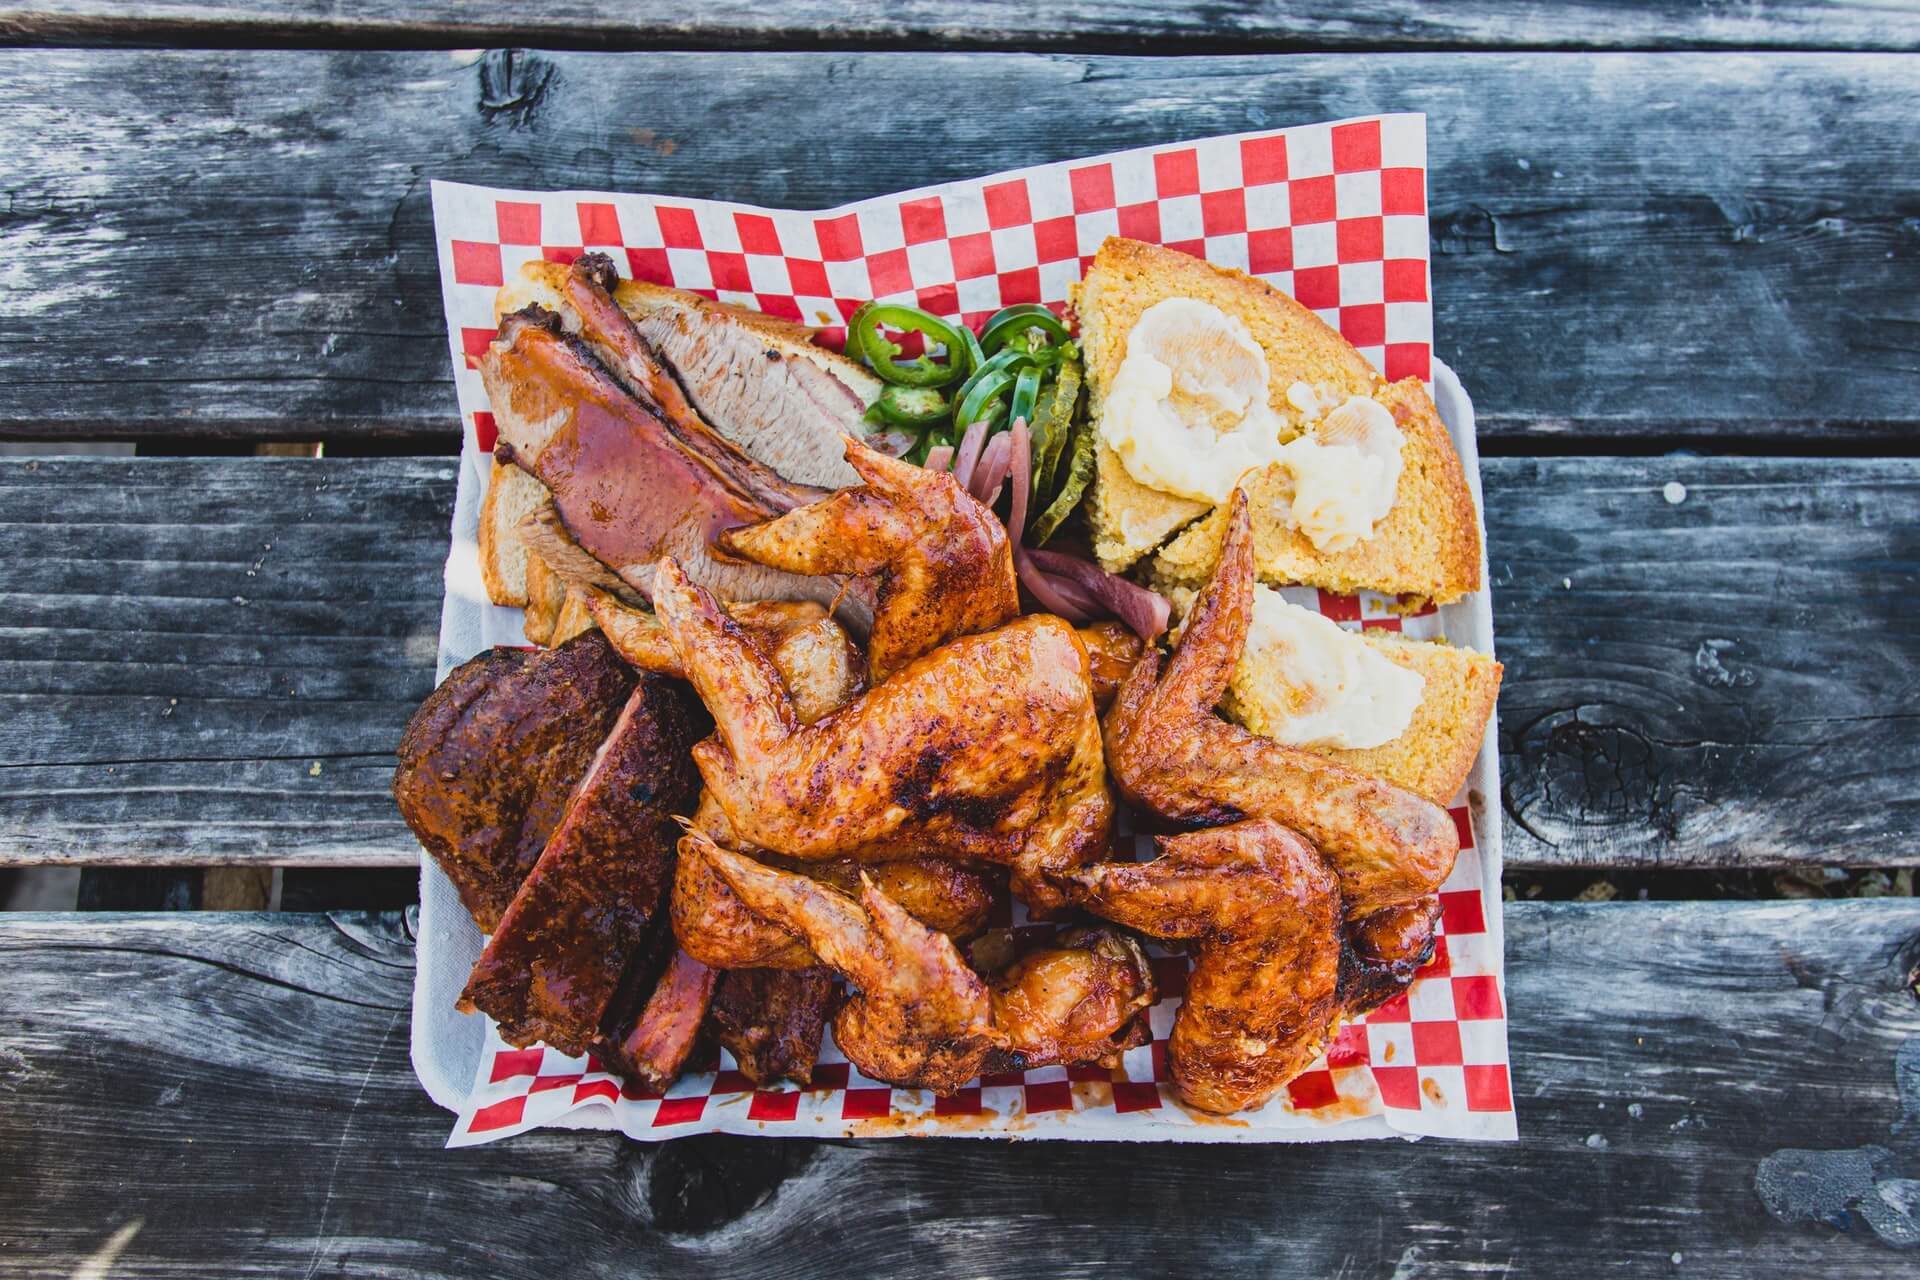
Barbecue food plate on wooden table

We know how plant proteins are performing with consumers but what do we know about how meat, poultry, and seafood are doing?

Well, because of a recent report from Datassential, we know many consumers are “meat-limiters.” And research from the World Resources Institute shows that plant-based performance is nuanced.

Interestingly, the performance of animal proteins on-premise appears to be following a beverage trend: Moderation. According to Datassential, more consumers are reducing their consumption of meat and poultry than increasing it in comparison with 2021.

So, meat-limiters may be indicative of the future of meat consumption.

Consumer Shifts

As the name implies, meat-limiters are limiting or otherwise reducing their consumption of animal proteins. Importantly, it doesn’t appear that a significant percentage of consumers are eliminating animal proteins from their diets.

Rather, many people are simply increasing the amount of plant-based items they’re eating. However, that increase is more aspirational than real in some cases.

Per Datassential’s survey of 1,500 consumers in the US, just over 70 percent of people are meat eaters. In contrast, nearly 25 percent are “flexitarian.” Just two percent are vegan or pescatarian, and only three percent are vegetarian.

So, the vast majority of Americans are still consuming meat, poultry, and seafood. We just now have reason to believe that more consumers may be leaning toward a flexitarian diet.

A bit over a quarter of consumers consume meat every day. Still, many people aspire to eat more vegetables, fruits, and whole grains, per Datassential.

However, there are more pescatarians, vegans, and vegetarians among Gen Z than the overall population. According to Datassential, this could indicate a shift away from animal proteins in the future.

Meat Performance is Nuanced

Just like plant-based performance, meat performance is nuanced. There are many factors at play.

Shifts in what consumers value are driving changes to the performance of proteins. Health, sustainability, the climate, taste, and affordability have an effect on all proteins, animal and plant.

Undeniably, inflation and shaken consumer confidence are impacting protein performance. Everything, it seems, is more expensive at the moment. Generally speaking, animal proteins are pricier than plant-based items.

It makes sense, then, that some consumers are reducing their intake of animal proteins and filling that void with fruits, veggies, and legumes.

Of particular note are shifts in daily and weekly consumption of animal proteins in 2022. Meat consumption once or more per week—beef, lamb, pork, veal—is up three percent. However, there’s a ten-percent increase in consumers eating poultry once or more per week.

Interestingly, daily poultry consumption is down seven percent in comparison with 2021. Likewise, daily consumption of seafood is also down seven percent, and fewer people are consuming it less than once per week.

Plant-based is Down

Despite what some would think, meat-limiters don’t appear to be driving up plant proteins significantly.

In fact, according to Datassential, the daily consumption of plant-based proteins is down. Per the research firm, seitan, tempeh, and tofu are the experiencing the greatest drop in daily consumption.

The fact is that across generations, more consumers eat animal proteins on a daily basis than their plant-based counterparts. Gen Z, per Datassential, consumes more animal proteins on a daily basis than other generations.

So, how does it make sense that people are reducing their meat intake but plant-based isn’t seeing a sizable jump in consumption?

In part, the answer is the growing popularity of plant-forward dishes. These are items, like bowls, that offer a small amount of meat, poultry, seafood or dairy. The majority of these menu items consists of plants but are not free of animal proteins completely.

The path forward may indeed be a plant-forward menu. Of course, this is heavily reliant on a specific concept or brand. Still, it’s likely many restaurants can do well offering mixed dishes, those heavier on plant proteins than animal proteins.

Image: Peter Pham on Unsplash

Note: This article is based on information from Datassential’s “2022 Plant-Forward Opportunity” report. To access a number of free reports, sign up with Datassential today.

by David Klemt David Klemt No Comments

What Consumers Expect from Delivery

What Consumers Expect from Delivery

by David Klemt

Delivery or takeout food order in brown paper bag

Consumers are developing specific behaviors and opinions regarding delivery that impact their perception of restaurants and brands.

Over the course of two years and three surveys, Deloitte has attempted to learn more about consumers and delivery.

In total, Deloitte surveyed 1,550 restaurant customers. Additionally, the multinational interviewed highly positioned executives from ten casual, fast-casual, and QSR brands.

What Consumers Want

First, it should come as no surprise that delivery is here to stay. None of Deloitte’s survey results indicate otherwise.

In fact, it appears that some consumers are showing an interest in additional delivery methods. Half of survey respondents are willing to try driverless or drone delivery.

More than half—64 percent—don’t expect to return to pre-pandemic dining habits by March of this year. Illustrating the habit of ordering takeout and delivery, 61 percent of respondents engage with restaurants that way at least once per week. That represents a 32-percent increase from June 2020 to September 2021.

When dining off-premise, 57 percent of Deloitte survey respondents prefer to place orders via an app. However, 40 percent of respondents prefer a restaurant’s own branded website or app. That shows that:

  1. A restaurant’s website matters. A significant percentage of consumers want to get information, get a feel for a restaurant, and place orders with a business directly.
  2. Direct delivery is feasible. Consumers want to know and feel as though they’re supporting a restaurant directly rather than a third-party business.

Own the Delivery Experience

Of course, quality is a concern with consumers who place delivery orders. This points to another pitfall regarding third-party delivery beyond the fees.

Unfair as it is, three out of five restaurant customer survey respondents have quality expectations. Specifically, they expect the same food experience off-premise as they receive on-premise. That means the same quality and the same freshness.

They also indicate that wait times of up to 30 minutes are acceptable. Here’s where the risk to restaurants comes into play. Consumers will fault the restaurant for late orders; cold food (or melted or room-temperature food for cold items); iced drinks becoming watered down; and other order issues even if they’re delivered by third-party services.

So, operators must look into and invest into what they can to improve the quality of delivery orders. Containers that keep hot food hot, French fries and other fried foods crisp, and cold foods cold are paramount.

Unfortunately, problems that occur after an order has left a restaurant—which are out of the business’ hands—are often attributed to the venue. Another reason, then, to consider and implement direct delivery.

Image: Yu Hosoi on Unsplash

by David Klemt David Klemt No Comments

Square: 2022 Threats & Opportunities

Square: 2022 Threats & Opportunities

by David Klemt

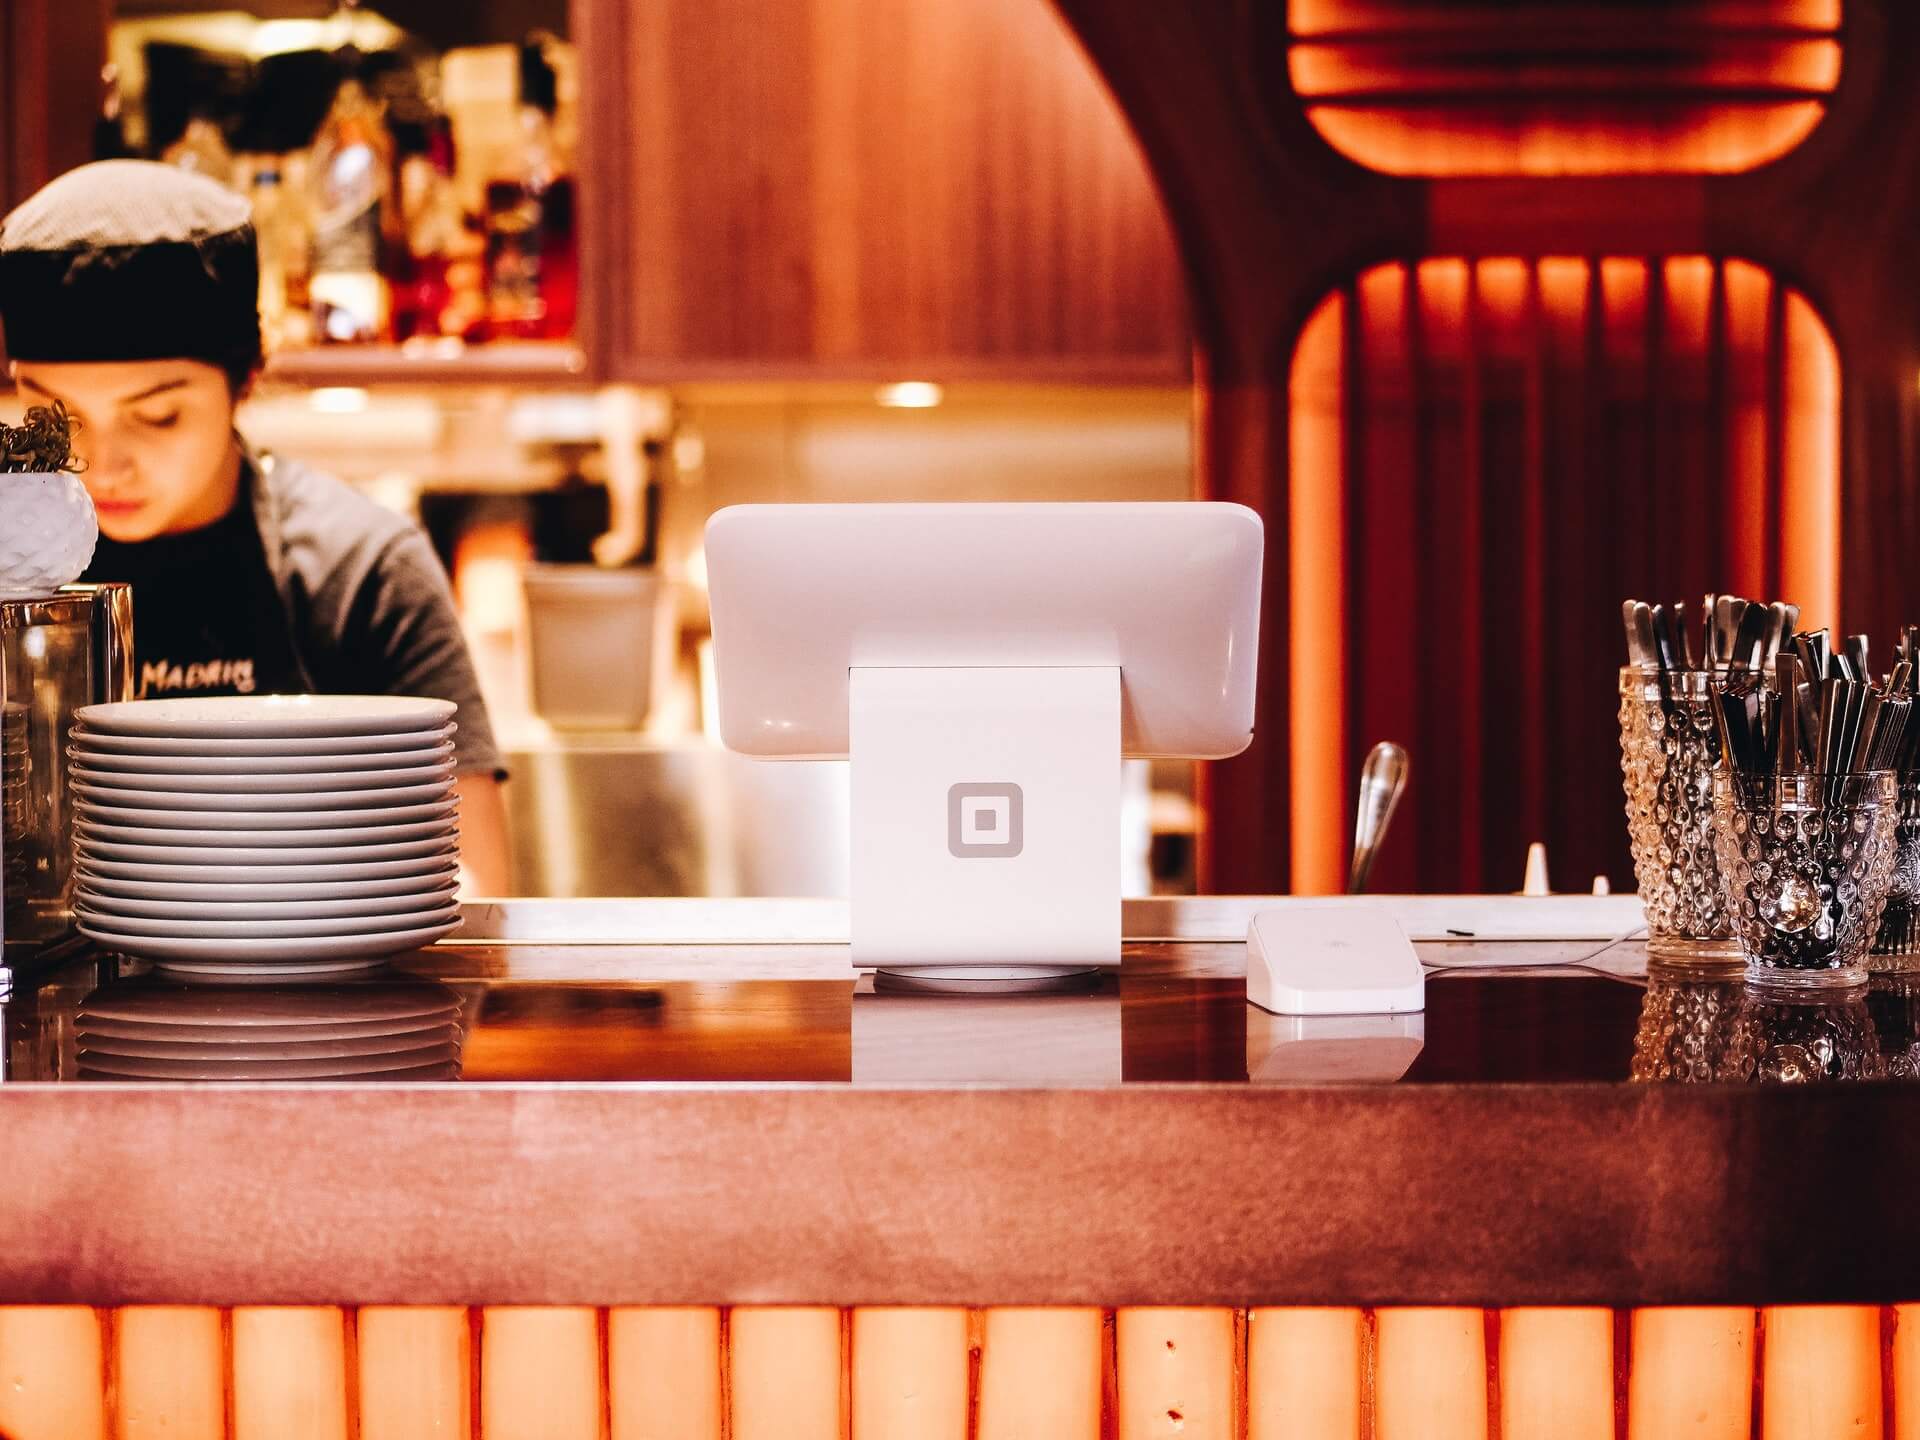
Square terminal in restaurant kitchen

As all hospitality professionals know, the past nearly two years is imposing rapid change on the industry, necessitating rapid, strategic adaptation.

The key word in the above sentence isn’t “adaptation,” it’s “strategic.”

Of course, it’s hard to make strategic choices without as much information as possible.

To that end, we’ve reviewed Square‘s recently released “Future of Restaurants: 2022 Edition.” This is the company’s second annual Future of Restaurants report.

Square partnered with Wakefield Research, surveying 500 operators and 1,000 consumers to identify 2022 threats and opportunities.

Threat: Labor Shortage

Most operators aren’t going to want to read this prediction from Square. However, we can’t identify and adapt for opportunities if we don’t acknowledge threats.

Per Square’s report, the labor shortage may never see a correction. In other words, welcome to yet another new normal.

More than 70 percent of operators say they’re facing a labor shortage, per Square. Just over 20 percent of available positions were, at the time the survey was conducted, unfilled.

Instead, operators will likely, according to Square, need to make operational and work culture changes:

  • Improve working conditions. For example, encouraging and acting on team feedback. Another example? Modernizing scheduling.
  • Ensure workers are being mentored and not simply managed.
  • Hire, train, assign tasks, and schedule more strategically to operate with a smaller team.
  • Offering incentives that entice higher-quality candidates to work for you.

One participant quoted in the Square report claims that QR code ordering dropped their labor cost percentage by 150 percent.

Threat: Lack of Tech

As SevenRooms suggested when looking forward to 2022, technology solutions can lessen the burden of labor shortages. That leads us to another big threat: failing to embrace tech.

Some operators bristle at the word “automation.” For many, it conjures an image of robots in the kitchen and delivering food to tables.

Obviously, we’re opposed to replacing staff with any form of automation. However, we support automating tasks if that means team members are better utilized.

Why not automate inventory? Why not automate online order filling? If it improves operations and the guest experience, automation is less threatening.

According to Square’s report, 62 percent of operators think automation is appealing for managing online, delivery, and contactless orders. Ninety percent of operators say that back-of-house automation—if staff can focus on more important tasks—is a good idea.

More than 90 percent think automated inventory is an appealing solution.

It has taken a lot of time for hospitality to catch up to other industries in embracing tech. But Square reports that 36 percent of restaurants upgraded their business tech in 2021.

Of course, automation will become a threat if operators lean too heavily into it and stop paying attention to detail.

Phrased another way, be tech-savvy, not tech-reliant.

Opportunity: Omni-channel

Square see implementing an omni-channel strategy as the way forward. In fact, their general manager for Square Restaurants, Bryan Solar, said the following:

“We see the time of the dine-in only or takeout only as largely done forever.”

Going omni-channel (diversifying) in the restaurant space means making online ordering and delivery important elements within the overall business strategy. To that end, Solar posits kitchens will grow in size to better handle online orders.

Square’s survey reveals some intriguing numbers:

  • 13 percent of consumers say they’ll avoid restaurants that don’t offer online ordering.
  • Among restaurants with online ordering, those channels generate 34 percent of their revenue.
  • Over the past year, 54 percent of restaurants either added or expanded online ordering channels.
  • Online ordering is likely here to stay: 69 percent of respondents plan to offer it post-Covid-19.
  • 24 percent of operators are planning to allow guests to order alcohol from them online.

Another interesting set of numbers pertains to first- and third-party delivery. As we’ve stated several times, we much prefer operators offer first-party or direct delivery. According to Square, 49 percent of operators plan go direct delivery. More than half—62 percent—will pursue third-party delivery. That suggests that some operators will offer both.

Opportunity: Direct Ordering

When it comes to engaging online guests, operators need to control the experience. As I wrote for another publication years ago, a restaurant or bar’s website is still very important.

This statistic proves that statement true: Per Square, 68 percent of online guests want to order via a restaurant’s website or app, not a third-party.

More than likely, a significant portion of those guests want to know they’re supporting a restaurant and its staff directly. Hence the importance placed on ordering via the website or their own branded app.

So, operators would do well to ensure their websites feature an ordering widget. Or, they can opt to have an app built (or at least skinned) for their business.

Opportunity: Kiosks

According to Square’s survey results, 79 percent of consumers prefer ordering from kiosks over ordering from staff.

Most consumers and operators likely associate ordering kiosks with fast food restaurants. However, other categories can also benefit from these devices.

Close to half—45 percent—identified it as a preference when ordering at a casual-dining restaurant.

And fine dining isn’t immune to the convenience of tech. A little over 20 percent of consumers prefer to order via kiosk in the fine-dining space.

Overall, kiosks speak to the guest desires for convenience and safety. More than a third indicated that ordering via digital menu is appealing because they don’t have to touch a menu someone else has touched. And 37 percent like a digital option because they don’t have to wait for a server to bring them a physical menu.

Eleven percent of Square survey respondents will avoid a restaurant if they don’t offer digital menus.

Nearly half (45 percent) of restaurants are planning to offer QR code menus post-Covid-19. Another benefit of digital menus is dynamic pricing. As costs fluctuate, operators can increase or reduce prices easily without printing new menus.

Outlook

Representing a stark contrast from 2020 survey results, nearly 60 percent of operators say the survival of their restaurants is a concern in 2022.

That’s still a high number but vastly lower than how operators answered about 2021. Last year, 92 percent of operators surveyed said they were worried about survival.

According to Square’s report, operators are looking past surviving and making long-term plans. That’s a welcome sign that confidence is improving.

To review Square’s “Future of Restaurants: 2022 Edition” report in its entirety, click here.

Image: Patrick Tomasso on Unsplash

by David Klemt David Klemt No Comments

Consumers May Keep Eating at Home

Consumers May Keep Eating at Home

by David Klemt

Friends and family around a dinner table at home

A recent report suggests that consumer interest in eating at home more will continue even after we return to “normal.”

This is the finding from a survey conducted by the Food Industry Association (FMI)l, formerly known as the Food Marketing Institute.

The FMI surveyed grocery shoppers to determine habits influenced by the pandemic.

Emphasis on Nutrition

I look to a wide variety of sources to analyze consumer behavior. Even their grocery habits can be valuable for operators to know.

In this case, knowing about the dining habits of today’s consumer provides important insights. For instance, knowing what types of food items shoppers are purchasing can be very telling.

Per the FMI, nearly half of survey respondents (49 percent) indicate they’re choosing healthier foods when grocery shopping. Clearly, living through a public health crisis is influencing this decision.

Today’s consumer, with more information at their fingertips and the purchasing power to demand more transparency from company’s, has become increasingly focused on their health. That interest grew stronger during the pandemic as a healthier lifestyle can lead to a reduced risk for illness.

This particular finding should tell operators a few things. First, they may want to consider updating their menus with healthier items. Second, that’s not limited to food—many guests are interested in no- and low-ABV drinks. Third, operators who use healthier ingredients should make that clear via their menu item descriptions.

At-home Dining

The FMI also found that 41 percent of survey respondents plan to prepare and enjoy more meals at home moving forward than they did before the pandemic.

That ties directly to 44 percent saying they “like” or ‘love” cooking at home more now.

While this survey was intended to provide consumer behavior insights for grocers, there’s clearly value for operators.

As many learned during the pandemic, guests are interested in supporting restaurants and bars buy ordering meal and cocktail kits.

Since it’s important to meet guests where they are, operators may want to keep such kits on offer. People have shown they’re eager to engage with restaurants and bars via virtual tastings and cooking classes. Clearly, many are also happy to order meal kits from restaurants to make in the comfort of their own homes.

Yes, there’s pent-up demand set to be unleashed. And yes, people are eager to get back out there and socialize. But there are also financial, health, and safety concerns that will keep some people from dining out as often as they did pre-pandemic.

That doesn’t mean they’re out of reach of restaurants and bars entirely. However, it does mean operators will need to adapt and get creative to earn their business.

Image: fauxels from Pexels

by David Klemt David Klemt No Comments

Rediscovering Your Guests in 2021

Rediscovering Your Guests in 2021

by David Klemt

Guests in a restaurant and bar

Labatt Breweries of Canada wants operators to get to know their guests all over again in 2021.

Luckily, this isn’t a massive undertaking. However, it requires commitment and an understanding of altered consumer behavior.

During the 2021 Restaurants Canada Show, Labatt presented “Rediscover Your Guest: The 2021 Consumer.”

Christina Veira, bar and beverage curator for the RC Show, hosted the digital session. Labatt panelists included Michelle Tham, head of education and certified Cicerone, and Megan Harris, director of insights and strategy. Casey Ferrell, vice president of US and Canada Monitors for Kantar Consulting rounded out the panel.

Who’s Your 2021 Guest?

The good news is that Canadians are still consuming beverage alcohol. The less-good news is that they’ve gotten used to drinking mainly at home.

In fact, per Megan Harris, 95 percent of beverage alcohol occasions now happen at home. Harris also says there’s excitement about a return to in-person restaurant and bar service. However, several pandemic-driven behaviors will persist, including:

  • Takeout
  • Delivery
  • Daytime drinking
  • Working from home

Guests are set to unleash a torrent of pent-up demand when they can safely return to restaurants and bars. They want to indulge themselves, have fun and new experiences, but also feel safe.

Generally speaking, younger guests are more tolerant of risk. Conversely, guests over 50 years old are more cautious.

Vaccine Influence

Per Ferrell, there are four distinct vaccine groups in Canada and the United States:

  • People have gotten a Covid-19 vaccine.
  • People who can’t wait to get a Covid-19 vaccine.
  • People who are unsure about Covid-19 vaccines.
  • People who refuse to get a Covid-19 vaccine.

Ferrell says to remove the final group on that list. Doing so shows that about two-thirds of Canadians (and Americans) are in the process of getting the vaccine. Therefore, operators need consider how to address vaccination safety along with vaccination requirements for guests and employees. For Ferrell, the best lever to pull is the one that addresses Covid-19 and vaccine risks.

Additionally, just because the calendar ticked over to 2021 doesn’t mean everything is different. Accordingly, Ferrell feels that Q1 is the “More of 2021” stage of this year. He expects people to open up their bubbles during possibly Q2 or Q3, the “Less Covid-19” stage. Parties that include multiple households will return in force in Q4.

How to Meet 2021 Guest Expectations

First, we must be cautious when people return to restaurants, bars and other venues en masse. That initial boost in traffic driven by pent-up demand will ebb quicker than one would expect.

To get people through the doors, operators will need to focus on:

  1. health and safety;
  2. staff expectations and training;
  3. social interactions and the joy deficit; and
  4. guest experience and journey.

Harris sums up the first point succinctly: Anything that can be touchless, should be touchless. Operators should expect contactless features to remain moving forward. The expectation for hygiene will also remain. Guests will want to see employees cleaning and sanitizing, for instance.

Speaking of employees, operators must address the role they’ll plan in crowd management. Unfortunately, management and employees will have to be ready to enforce health and safety protocols strongly.

As Ferrell notes, long-term lockdown means large swaths of the population need to re-learn how to interact with others. One way to drive guests through restaurant or bar doors is promoting the role they play in socializing. Hospitality businesses facilitate social interaction—it’s one of the industry’s greatest strengths. Equally, restaurants and bars fill people’s joy deficits.

Operators, says Harris, need to consider:

  • every way they can offer an experience guests can’t have at home;
  • how they can capitalize on the daytime drinking experience;
  • how to extend the guest experience—pre-visit and post-visit;
  • how to attract older guests to their venues;
  • leveraging patio spaces; and
  • focusing on messaging that promotes escapism and excitement.

Another interesting consideration concerns table distances. Every operator needs to weigh square feet per guest and distancing tables. Social distance will likely remain important to guests for at least a little while post-pandemic.

Bonus

Ferrell answered a question I asked about Las Vegas specifically. Dayclubs, which largely focus on elevating pool parties, are an integral part of Vegas hospitality.

So, how can they signal their commitment to health and safety as relates to infections?

Ferrell’s answer is that evidence appears to indicate that pools are Covid-19 infection spreaders. Therefore, dayclub operators should focus more on the crowd control aspect of health and safety. Additionally, messaging should focus on indulgence.

After all, says Ferrell, not much is more indulgent than saying, “I’m going to take the day for myself and go to a daylife venue.”

Image: Nick Hillier on Unsplash

Top