Industry news

by David Klemt David Klemt No Comments

SevenRooms and CSV form Partnership

SevenRooms and Competitive Social Ventures form Partnership

by David Klemt

The word "play" painted on a wall

Guest experience and retention platform SevenRooms will kick off 2023 with a partnership with Competitive Social Ventures.

This new partnership is yet another example of SevenRooms’ continuous growth. For technology in general and our industry in particular, this is excellent news.

Consider how long it has taken, up until recently, for hospitality to embrace tech innovations. Navigating tech solutions can be daunting. Equally intimidating can be the cost of implementing new tech in a restaurant, bar, or hotel.

Watching a tech platform continue to innovate and grow, therefore, is good news for operators and their teams.

SevenRooms traces their founding to 2011. In comparison, many “solutions” never escape the vaporware stage, existing only on paper. With more than a decade of operation under its belt, SevenRooms is established and positioned for longevity.

In other words, the platform is worthy of operator consideration and investment. We make no secret of our preference for SevenRooms at KRG Hospitality. Unless they prove we should think otherwise, the platform is our favorite tech-based guest retention solution.

Beyond functionality, ease of use, and effectiveness, the company’s continuous growth motivates our support. Look at how SevenRooms grew in 2021 alone:

The platform also started 2022 with the hiring of a chief revenue officer, Brent-Stig Kraus.

Social Entertainment

With its headquarters in Alpharetta, Georgia, Competitive Social Ventures blends sports, socializing, and entertainment.

In fact, the company refers to the brands it has brought to market as “competitive socializing entertainment concepts.”

Last year, CSV brought Fairway Social Alpharetta and Roaring Social Alpharetta to market. The former focuses on sports simulators. Roaring Social, on the other hand, delivers a speakeasy experience combined with bowling.

Arriving in 2023, the real estate holding company plans to launch Pickle & Social concepts throughout the Metro Atlanta. As the name suggests, the concept features indoor and outdoor pickleball courts. Guests will also have access to table tennis. And like Fairway Social and Roaring Social, Pickle & Social will feature live music and an elevated F&B experience.

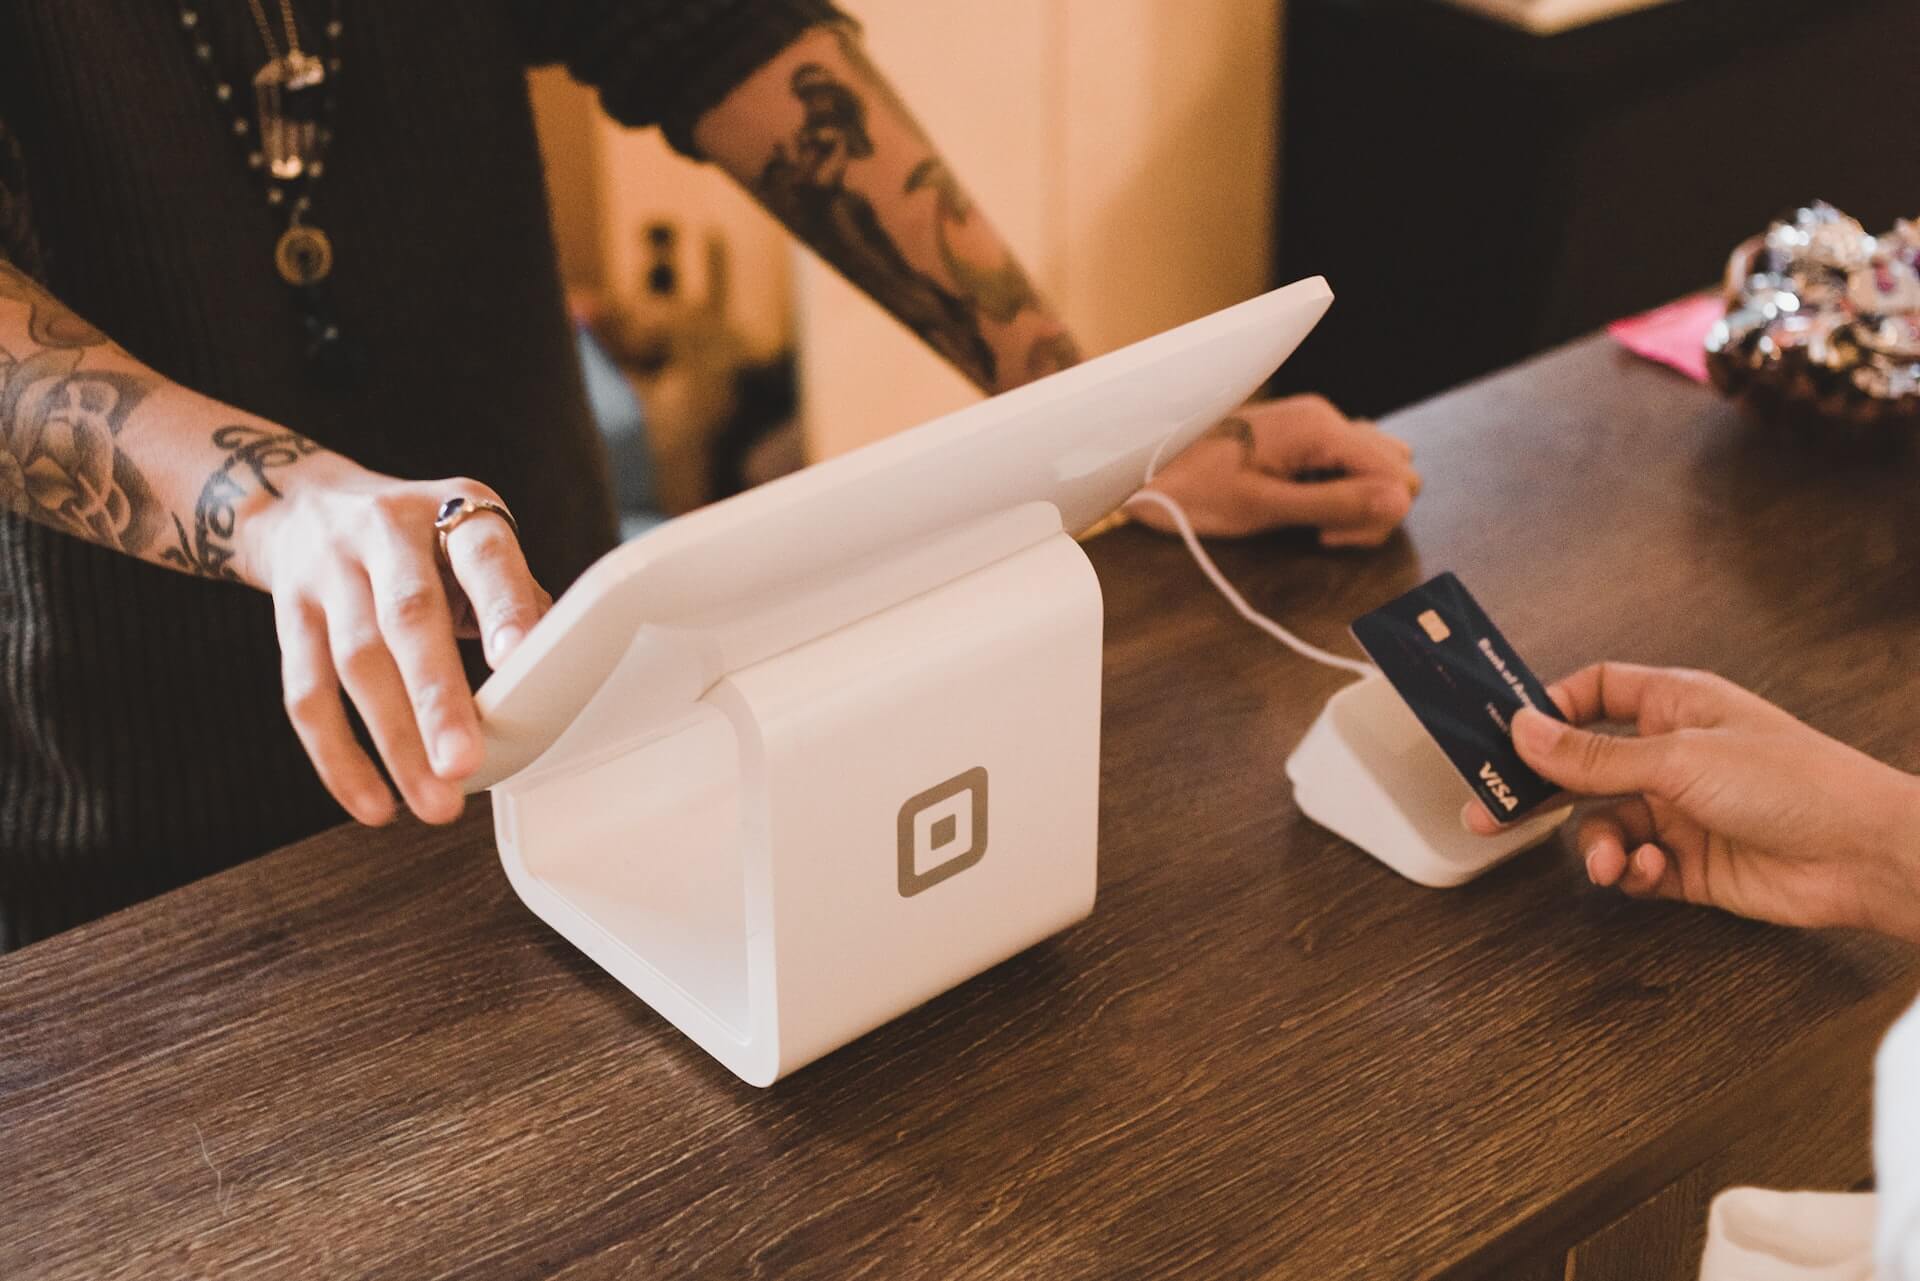
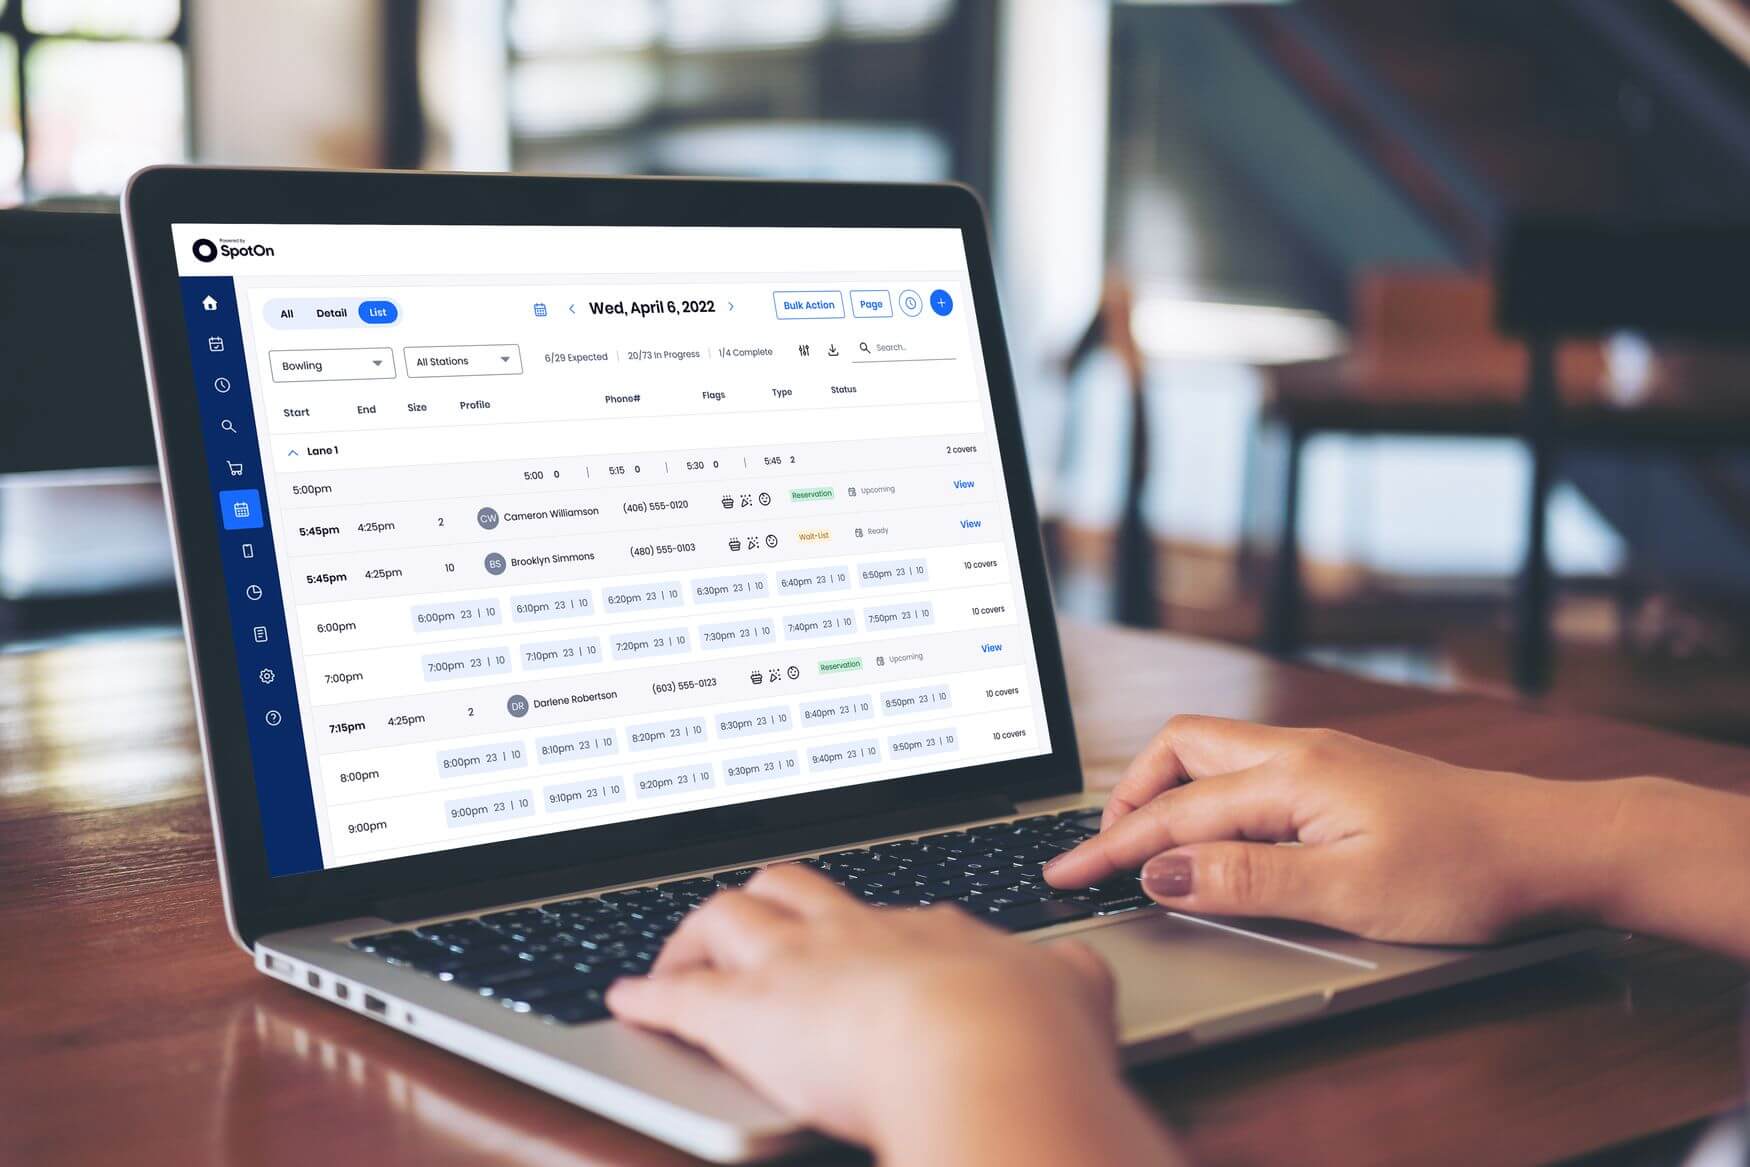
CSV already makes use of SevenRooms’ reservation and guest data management tools. Going into 2023, this partnership will evolve into review aggregation, marketing automation, and table waitlist management. The latter makes it easier for any concept to handle walk-ins as painlessly as possible.

Most importantly, the partnership with SevenRooms empowers CSV to pursue their growth plans. While the growth of SevenRooms is impressive and confidence-inspiring, their commitment to client growth is the real story here.

When choosing their tech stack, operators need to know the relationship is mutually beneficial. In fact, they need to be confident that each platform is here for long-term success.

In fact, operators should look at every relationship through this lens: Is every partner working to help you grow?

Image: Ben Hershey on Unsplash

by krghospitality krghospitality No Comments

KRG Hospitality Adds to Team

KRG Hospitality Enters New Era of Growth with Addition to Team

by David Klemt

KRG Hospitality Licensing Program logo

Kim Richardson joins the KRG Hospitality team, representing Philadelphia and the Northeastern US region via the agency’s new license program.

PHILADELPHIA, PA—KRG Hospitality today announces an exciting new addition to the consulting agency’s team. Following several years of success, KRG is now entering a new phase of growth.

Kim Richardson, who has more than 23 years of experience in the hotel and restaurant industry, will represent KRG at the agency’s Philadelphia office. Further, Richardson will be KRG’s representative for the Northeastern region of the United States, serving Connecticut, Delaware, Maine, Massachusetts, New Hampshire, Maryland, New Jersey, New York, Pennsylvania, Rhode Island, and Vermont.

As the newest member of the KRG team, Richardson is excited to bring all her hospitality industry knowledge and experience to the Philadelphia area. From Five Diamond Hotels to brick-and-mortar restaurants, she has had her hands in the Philadelphia hospitality scene since moving to the city in 2003. With an admiration for the industry since a very young age, she has a passion for all things hospitality. Most importantly, Richardson brings with her a passion and eagerness to help grow the industry and lead others to success.

“There’s nothing more rewarding than understanding a client’s dream, perfecting it, and bringing that vision to life,” says Richardson.

This exciting new addition to the KRG team represents the launch of the agency’s new licensed consultant program. KRG operates in several key markets—Toronto, Las Vegas, Calgary, Vancouver, Philadelphia, Nashville, Orlando, and the Caribbean—and is planning to add more partners as regional representatives throughout 2023.

“As we move forward from the pandemic era, we look forward to positioning the brand for continued and further success,” says KRG Hospitality president Doug Radkey. “Creating a licensed consultant program provides us the opportunity to reach a wider audience, provide additional value and support for our clients, and help push this exciting industry forward.”

About KRG Hospitality

KRG Hospitality is a storied and respected agency with proven success over the past decade, delivering exceptional and award-winning concepts throughout a variety of markets found within Canada, the United States, and abroad since 2009. Specializing in startups, KRG is known for originality and innovation, rejecting cookie-cutter approaches to client projects. The agency provides clients with a clear framework tailored to their specific projects, helping to realize their vision for a scalable, sustainable, profitable, memorable, and consistent business. Learn more at KRGHospitality.com. Connect with KRG Hospitality and the Bar Hacks podcast on social: KRG Twitter, Bar Hacks Twitter, KRG Media Twitter, KRG LinkedIn.

Image: KRG Hospitality

by David Klemt David Klemt No Comments

The NRA’s 2023 Culinary Trend Forecast

The National Restaurant Association’s 2023 Culinary Trend Forecast

by David Klemt

Cheesy chicken sandwich on paper wrapper

Ahead of the beginning of a new year, the National Restaurant Association unveils their culinary trend predictions for 2023.

The report is the result of a collaboration between the NRA, Technomic, and the American Culinary Federation (ACF).

For those unfamiliar, Technomic is at the forefront of foodservice trend tracking, industry research, and analysis. Likewise, the ACF is a premier industry organization. Tracing its founding to 1929, the ACF promotes “the professional image of American chefs worldwide through education of culinarians at all levels.”

To predict what will be “hot” next year, the NRA, Technomic, and ACF sent the 17th annual What’s Hot survey to thought leaders and chefs. In direct partnership with the Technomic Menu Research & Insights Division, the NRA predicted the top menu trends from 110 items spanning 11 categories.

Now, this isn’t a full dive into the report in its entirety. Rather, we strongly encourage our readers to download a copy of What’s Hot 2023 Culinary Forecast for themselves and their teams.

What readers will find below are the top 10 trends for 2023. Additionally, we’ll share the top three macro trends for next year, as forecast by the NRA and their partners.

More than Food

Somewhat surprisingly, the NRA’s top-ten list of culinary trends isn’t just a list of food items. Instead, this forecast paints a picture of where restaurants are heading in 2023.

While there are some specific cuisine predictions, the NRA’s top culinary predictions show us, in part, how consumers want to experience the restaurants they visit.

  1. Southeast Asian cuisines (examples: Vietnamese, Singaporean)
  2. Zero waste/Sustainability/Upcycled foods
  3. Globally inspired salads
  4. Sriracha variations
  5. Menu streamlining
  6. Flatbread sandwiches/Healthier wraps
  7. Comfort fare
  8. Charcuterie boards
  9. Fried chicken sandwiches and Chicken sandwiches “3.0” (example: fusion of flavors)
  10. Experiences/Local culture and community

As we can see, operators and consumers expect tighter, more concept-specific menus. Also, comfort foods; shareable (and “Instagrammable”) items like charcuterie boards; and items that show local and global influences may be hot in 2023.

One can consider, then, streamlining their menu to include their top sellers along with local and/or global flavors authentic to their brand.

Below, readers will see that three of the trends above make up the NRA’s top-three 2023 macro trends:

  1. Menu streamlining
  2. Comfort fare
  3. Experiences/Local culture and community

Operator and Consumer Behavioral Shifts

Looking at the macro trends, it’s reasonable to believe the past few years will influence 2023 heavily.

Operators are dealing with inflation, higher costs for everything, labor shortages. Further, according to Datassential, more than a third of American operators are experiencing low traffic and sales levels.

We can expect these issues to follow us into 2023, at least for Q1 and Q2. Therefore, the NRA’s macro trends forecast makes sense. Streamlining menus often leads to streamlining the back and front of house. In turn, doing so can lower costs and boost staff retention.

On the consumer side, it appears comfort foods, chicken sandwiches, and experiences are driving visits and online orders. These are, as we all know, behavioral shifts we can trace back to the start of the pandemic.

We always suggest proceeding with caution, logic, and data when considering embracing trends. Missing out on trends can be just as costly as latching onto a trend too late.

That said, the macro trends certainly seem reasonable. Only time will tell, but the NRA’s 2023 forecast certainly contains several items operators and their teams should give serious consideration.

Image: Arabi Ishaque on Unsplash

by David Klemt David Klemt No Comments

169 Grants May be the End of the RRF

169 Grants May be the End of the RRF

by David Klemt

Empty, broken plate on floor

UPDATE: According to some sources, the report of $180 million in “leftover” RRF money are inaccurate. The disbursement of $83 million represents the final release of RRF funds.

The $83 million in grants going out this week to 169 recipients may be the end of the Restaurant Revitalization Fund in its entirety.

Unfortunately, it’s possible last week’s awards represent the final grants. This, despite the Government Accountability Office (GAO) finding $180 million in funds in July.

As far as the sources of these funds, that topic remains a bit vague.

However, the story is that more than $150 million are the result of clawbacks. More than a third, if reporting is accurate, is the result of recipients or financial institutions returning grants. Reports indicate another $24 million come from the SBA setting aside $24 million for litigation.

Per the National Restaurant Association months ago, the American Rescue Plan Act of 2021 does not include a provision for a litigation fund. Therefore, the NRA called for the SBA to disburse that money to RRF applicants.

What we do know is that last week’s RRF grant recipients should be receiving their funds this week. According to the SBA, 169 recipients were awarded a portion of $83 million in RRF money.

Again, that’s money the GAO found back in July. It’s also less than half of the reported $180 million the government agency found this summer.

Given the fact that the SBA announced a disbursement of just 46 percent of the “leftover” funds, many believed another round was in the works. Sadly, that may not be the case. It’s possible—and increasingly likely, regrettably—that the rest of the $180 million in funds won’t go to grant applicants.

Now, I want to be clear on one important point: I’m relieved for the 169 grant recipients. I truly hope the funds arrive in time to help them and their teams.

While I’ll feel disappointment if a second round of the $180 million never materializes, I’m happy for those who received a portion of the $83 million awarded last week.

Frustration

So, where does the industry go from here? The failure of Congress to replenish the RRF left a reported 150,166 applicants with zero assistance. According to Nation’s Restaurant News, it would have taken $41 billion to award each applicant a grant. Obviously, $180 million was never going to serve to help that many applicants.

Frustratingly, the answer to the question above appears to be: Move forward on our own. And that unsatisfactory answer has flooded with me opinions.

One opinion? Our industry, it seems, is always left to fend for itself. Despite the millions of people hospitality employs, lawmakers and politicians don’t seem willing to assist us—and therefore their constituents—in meaningful ways.

Another opinion? Perhaps we need to build a more powerful lobby to have our voices heard. Such an effort began in earnest to support the RRF. However, too many elected officials were comfortable refusing to replenish the fund.

A third opinion was shaped by Eileen Wayner, CEO of Tales of the Cocktail. As a guest on the Bar Hacks podcast she addressed the perception of operators and hospitality workers as being adaptable and resilient.

While those characteristics can be admirable, Wayner expressed something I think we all feel: Sometimes, we’re tired of being resilient. Sometimes, we’re tired of being expected to adapt. There are times our industry needs help.

When you’re constantly seen as resilient, people believe you don’t need assistance. What we’ve seen with the RRF and its failed replenishment is that too many people with the power to help can write us off. “They’re resilient,” they say. “They’ll figure it out. They’ll be fine.”

Well, we’re not all “fine.” We needed help, and we deserved it.

Image: CHUTTERSNAP on Unsplash

by David Klemt David Klemt No Comments

$28.82 per Hour for NYC Delivery Workers?

$28.82 per Hour for NYC Delivery Workers?

by David Klemt

Delivery worker on bicycle on city street

In response to the New York City Council’s proposal of $23.82 per hour for delivery workers, some “deliveristas” are asking for more.

Now, before we proceed, no, this isn’t a re-run of an article from last week. This isn’t a case of déjà vu—it’s the evolution of a news story that’s developing rapidly.

So, how much more do delivery workers in NYC want? Well, they’re after a significant bump over the council’s minimum hourly wage proposal.

Requesting that the NYC Council more accurately account for deliverista expenses, some delivery workers are asking for $28.82 per hour.

Early last week, a group consisting of Los Deliveristas Unidos and the Worker’s Justice Project members came together. They gathered at New York City Hall to make their stance on the NYC Council’s minimum wage proposal.

As the deliveristas see it, an increase from $23.82 to $28.82 more accurately reflects their operating expenses. The argument is compelling when one considers costs beyond fuel.

Asking for More

After all, not every delivery worker in NYC (and other markets) uses a car, truck or SUV to make deliveries. That should explain the use of the term “delivery worker,” not “delivery driver.” Some deliveristas ride motorcycles, mopeds, or bicycles. I’m willing to bet some even use scooters, rollerblades, or skateboards.

Using any mode of transportation as a delivery worker comes with requirements, both legal and practical. For example, deliveristas must maintain insurance, maintain their transportation, and purchase and maintain safety equipment.

And yes, that safety equipment is crucial. According to some reports, around a third of NYC those who deliver on two wheels have been injured on the job. Tragically, 33 delivery workers have been killed since 2020. In fact, NYC says delivery workers have the highest injury rate.

Another interesting development may seem semantic. However, when one takes time to truly consider the point it’s rather poignant.

In asking for the proposal of $23.82 to rise by $5 by 2025, are asking for a living wage. Not minimum wage, as the proposal frames the hike, but a living wage.

One worker, Antonio Solís, as quoted by The City, a non-profit NYC news publication, explained: “We are asking the city to make a $5 adjustment, to go that extra mile to ensure we get to a living wage.”

A Request, not a Rejection

It’s also important to note that NYC’s delivery workers aren’t rejecting the council’s minimum wage proposal. Rather, the request is that the council considers updating their proposal ahead of a December 16 public hearing on the matter.

So far, companies like DoorDash, Grubhub, and Uber Eats haven’t released much in the way of statements. However, there have been reports quoting a handful of representatives. In pushing back against the proposal, they’ve mentioned increased costs; reduced deliveries; and the possibility of “locking out” deliveristas if delivery demand is low at a given time.

Should legislation go into effect after the public hearing, it’s likely we’ll see lawsuits from the delivery companies.

Image: Patrick Connor Klopf on Unsplash

by David Klemt David Klemt No Comments

SBA Releases 46% of Held RRF Funds

SBA Releases 46% of Held RRF Funds

by David Klemt

Single one-hundred-dollar bill

After receiving pressure from members of Congress and scrutiny from the industry and media, the SBA has released some RRF funds.

This comes after several months of inaction from the Small Business Administration.

The amount released on Wednesday, November 23 isn’t insignificant. However, the SBA disbursed less than half of the RRF money they’re sitting on.

Still, the news is welcome, particularly to the RRF applicants who finally received a grant.

$180 Million in RRF Funds

Several months ago, the Government Accountability Office (GAO) investigated the handling of the Restaurant Revitalization Fund. Back in July, the fruits of that investigation came to light: $180 million of the $28.6 billion in RRF funding had not been disbursed.

Further, it was reported in back August that the SBA was partnering with the Department of Justice to “formulate a plan on how to distribute” the money.

Now, nearing the end of November, it appears the SBA and DoJ have finalized a plan. Two days ago, on the eve of Thanksgiving, the SBA released $83 million of the $180 million that was discovered in July of this year. If every applicant received the same amount, that works out to $491,124 per grant.

With any hope, this means the remaining $97 million will go to deserving grant applicants very soon.

Where did the Money Go?

We don’t yet know which RRF grant recipients received a portion of the $83 million released this week.

What we do know is:

  • 169 applicants received this week’s grants;
  • applicants were selected by the order in which they applied for grants in 2021;
  • each recipient was alerted about their grant award this week;
  • the recipients are expected to actually receive the money some time next week;
  • grant recipients have until March 2023 to spend the funds; and
  • the recipients won’t have to repay the money if they spend it on “approved purchases.”

It’s logical that the disbursement of the $97 million in remaining RRF grants will follow the same procedure.

Statements on this Week’s Developments

This week, both the Small Business Administration and National Restaurant Association made statements about the release of $83 million in RRF funds.

“This week, the U.S. Small Business Administration (SBA) began distribution of returned funding in the Restaurant Revitalization Fund (RRF) program, following the program’s closure in June 2021. In doing so, the SBA worked with the advice of the Department of Justice on a plan to distribute the remaining funds, approximately $83 million,” reads a press release from the SBA.

“In addition to other SBA assistance programs, the RRF has helped more than 100,000 restaurants and other food and beverage business owners survive the pandemic,” continues the administration’s statement.

Sean Kennedy, executive vice president of public affairs for the NRA, said the following about this week’s disbursement:

“The SBA’s action represents the final chapter of our nearly three-year effort to secure dedicated federal pandemic relief dollars for local restaurants. Today’s announcement is great news for those 169 operators fortunate enough to receive an RRF grant, but hundreds of thousands more are struggling with uncertainty.

“We must continue to look forward because the enormous challenges of the industry will continue beyond today. From the recruitment of employees to the constantly rising costs for food, running a restaurant right now is a daily struggle. There are steps the government can take to support restaurants in every community, and we will continue to press for solutions at the federal, state, and local level.”

Image: AR on Unsplash

by David Klemt David Klemt No Comments

Merchants Support Credit Card Act

100s of Merchants Support Credit Card Competition Act

by David Klemt

Customer paying via Square terminal

Perhaps at least somewhat unsurprisingly, support for the Credit Card Competition Act is growing rapidly among merchants.

In fact, 1,802 merchants are making their position on the bill clear. Those hundreds of merchants drafted, signed, and sent a letter to the House and Senate.

The crux of that letter? To tell our lawmakers to support and pass the Credit Card Competition Act.

To view the letter, sent by the Merchants Payments Coalition (MPC), please click here. For the bill and its status, follow this link.

The Credit Card Competition Act: A Quick Summary

According to the MPC, credit and debit card transactions just in the US reached $3.49 trillion in 2021. Along with those transactions came $77.48 billion in merchant fees—just for Visa and MasterCard.

Why call those out those two processors in particular? Well, it’s because they’re behind about 576 million credit cards. Oh, and they also control 87 percent of the processing market.

In the span of just one decade, Visa and MasterCard swipe fees have risen 137 percent. So, it’s not surprising that merchants are supportive of the Credit Card Competition Act.

There are, indeed, restaurant and hospitality groups attached to the MPC’s letter to Congress. Taking a quick glance, Denny’s franchisees, Dutchman Hospitality Group, and Mandalay Hospitality Group are among the signees.

Obviously, this makes sense—swipe fees are among the highest costs operators face every day.

Where’s this Bill Currently?

It shouldn’t be too shocking to find that this has yet to make much progress. The bill’s sponsors, Sens. Richard Durbin (D-IL) and Richard Marshall (R-KS), introduced it in the senate at the end of July.

Three months later, October 28, an attempt was made to include the bill in the National Defense Authorization Act (NDAA). For those who are unfamiliar, the NDAA is known as a “must-pass” bill. After all, it specifies the US Department of Defense’s (DoD) budget and expenditures each year.

Along with a reported 900 other “riders,” Sens. Durbin and Marshall tried to get their bill passed within the NDAA. Unfortunately for the senators and supporters of the bill, the NDAA vote was pushed until the middle of November…which we’re now past.

Of course, the US did just undergo a mid-term election cycle. So, I suppose it’s reasonable to be a bit more patient with the Senate and the progress of this bill.

Those who work in or support our industry can make their opinion of this bill known. Just follow this link to the National Restaurant Association Credit Card Competition Act portal.

Image: Clay Banks on Unsplash

by David Klemt David Klemt No Comments

$23.82 Minimum Wage for Delivery Workers?

$23.82 Minimum Wage for Delivery Workers in NYC?

by David Klemt

Red "New York" sign on building

With a public hearing on the docket for December 16, the New York City Council is proposing “fairer pay for delivery workers.”

The move is a year in the making. Last year, the NYC Council approved legislation with the goal of improving delivery worker pay and working conditions.

Now, the council is moving to increase minimum wage for the 60,000-plus delivery workers in the city.

At the risk of coming across as pessimistic, the legislation is likely to be unpopular with third-party delivery services. After all, when NYC and San Francisco passed laws to cap third-party delivery commissions, the big services filed lawsuits.

So, again, increasing the minimum wage for delivery workers in NYC will probably not go down well with companies like Uber, DoorDash, and Grubhub.

It’s possible we’ll find out before the end of this year. After the public hearing, the NYC Council will consider public comments. Then, the council could move forward and enact the legislation.

What’s in the Proposal?

Should the rule go into effect after the public hearing on December 16, minimum wage would rise to $17.87 per hour for third-party delivery workers. By April 1, 2025, that rate would increase to $23.82.

“This new proposed minimum pay rate would help ensure a fairer pay for delivery workers for third-party apps, providing more stability for 60,000 workers across our city,” says New York City Mayor Eric Adams.

According to reports, Brooklyn Borough President Antonio Reynoso is in favor of the legislation as well.

“It’s absolutely unacceptable that the restaurant delivery workers who provide for so many in this city are not justly compensated for their time, reimbursed for their expenses or provided essential benefits,” says Reynoso.

So, how did the council arrive at the $23.82 per hour figure? Well, we actually have that information:

  • $19.86, which matches standards set by the New York City Taxi and Limousine Commission for ride-hail drivers;
  • $2.26 for expenses delivery workers incur; and
  • $1.70 for worker’s compensation.

Why Legislate Delivery Worker Pay?

It appears the main reason is an incredibly simple one. In short, third-party delivery workers aren’t making minimum wage in NYC.

Per the Department of Consumer and Worker Protection (DCWP), delivery workers average less than the city’s $15 minimum wage. With tips, they’re averaging $14.18. And without tips? As one can imagine, the hourly rate plummets: $7.09 per hour.

According to the DCWP, the average hourly expense a delivery worker incurs is $3.06. So, that drives their hourly pay to $11.12 with tips, $4.03 without.

In an argument likely to be cited in any lawsuit filed by DoorDash (or at least shared in a public statement), the company claims its delivery workers make almost $29 per hour.

Clearly, there’s a discrepancy somewhere. Either delivery drivers are woefully underpaid for the service they provide or multiple researchers are misinterpreting hourly pay data.

Several sources have cited a statement made by a DoorDash representative about the NYC Council’s proposal:

“Dashing allows so many across New York City to earn when, where and how often they choose,” says the rep. “Unfortunately, the proposed rule does not appropriately account for this flexibility or that Dashers are able to choose which deliveries they accept or reject.”

Their statement continues, addressing a possible rise in costs and drop in orders:

“Failing to address this could significantly increase the costs of delivery, reducing orders for local businesses and harming the very delivery workers it intends to support.”

Why Should I Care if I Don’t Operate in New York City?

We’ll see—quickly, apparently—if this proposal becomes law. Should that happen, there’s reason to assume similar proposals will pop up in other cities and states.

We’ll also see whether or not third-party delivery companies file lawsuits in response. They’ve done so for commission caps, after all.

At any rate, this is one to watch. Similar legislation could be coming to your market.

Image: Nik Shuliahin 💛💙 on Unsplash

by David Klemt David Klemt No Comments

Traffic Up but Margins Thinner

Traffic Up but Margins Thinner

by David Klemt

Chef checking tickets

The One Table 2022 report from Datassential focuses on the state of the operator and what the industry can expect moving forward.

This informative report shares survey results from 801 operators across America. While some of the findings are positive, it’s clear many operators are enduring significant challenges.

For some, traffic and sales are up. However, that’s not the situation others find themselves in.

To download and review the Datassential One Table 2022, please click here.

The Respondents

For this report, Datassential shares the survey answers from 801 respondents.

Most survey respondents are independent operators. In fact, they account for 71 percent of the participants. Making up the rest of the field are chain operators (15 percent) and franchise operators (14 percent).

As far as segment types, the majority of survey participants operate in the fast-casual space (18 percent). Unsurprisingly, fine dining is the smallest group of respondents at six percent. Thirteen percent operate midscale restaurants, and 12 percent are at the helm of casual-dining concepts. Somewhat surprisingly, just ten percent of participants operate QSRs.

Interestingly, the service format is fairly even among survey participants. Fifty-three percent of operators are full-service and 47 percent are limited-service.

Similarly, survey respondents represent the country’s regions pretty evenly:

  • South: 30 percent
  • Midwest: 29 percent
  • Northeast: 21 percent
  • West: 20 percent

In terms of market type, most respondents operate in the suburbs (49 percent). Following somewhat closely are urban-market operators, at 31 percent. Just 20 percent of survey participants operate in rural markets.

Traffic, Sales and Margins

At first glance, Datassential’s survey reveals positive news.

Now, I’m sure people find the terms “pandemic, “pre-pandemic,” and “post-pandemic” exhausting at this point. However, there’s no denying we continue to feel the aftershocks sent through the industry by the pandemic.

So, how do things look now in comparison to pre-pandemic traffic and sales levels?

First, the positives. Nearly half of survey respondents—47 percent—say their traffic is up in comparison to where it was pre-pandemic. Add to that the 14 percent who say their traffic is the same and 61 percent of operators appear to be in good shape.

In terms of sales, 51 percent of survey participants have good news. That news is that their sales are higher in comparison to pre-pandemic levels. Again, add the 14 percent who don’t see any change. So, that’s 65 percent of operators who appear to be performing well.

But with the good there’s bad. Unfortunately, 39 percent of respondents report lower traffic than pre-pandemic levels. And sales are lower than they were before the pandemic for 35 percent of survey participants.

Operator margins are lower for all respondents. Generally speaking, the profit margin for operators before the pandemic sat at 21 percent. Now, the average is 13 percent. QSRs and fast-casual restaurants are a bit higher among survey respondents: 17 percent and 15 percent, respectively.

On paper things do look up for many operators. However, the industry is still suffering, with a third struggling to rise to even pre-pandemic levels of traffic and sales.

Image: Daniel Bradley on Unsplash

by David Klemt David Klemt No Comments

Is There Demand for Non-alcohol?

As the Holidays Approach, is There Demand for Non-alcohol?

by David Klemt

Friends toasting with pink drinks

There’s no denying that non-alcohol is a growing beverage category, but does the data support the hype and operator consideration?

A report by behavioral research firm Veylinx offers compelling insight into non-alcohol and consumers.

By now, there’s really no excuse for failing to give non-alc serious consideration. When planning menus, operators should treat non-alc as much more than an afterthought.

Admitting fully that I’m repeating myself, giving alcohol-free beverages the same attention as their full-proof counterparts is crucial. Doing so is smart business; non-alc is capable of driving traffic and revenue.

And then there’s the guest experience element of the non-alc equation. Hospitality is about service, about ensuring every guest is comfortable. Giving guests who are abstaining from alcohol consumption a different experience than others isn’t hospitality—it’s alienation. Not only is that the antithesis of hospitality, it’s bad business.

Reviewing Veylinx data shows that non-alc is worthy of operators’ time and consideration. In my opinion, it’s even more important that non-alc menus and offerings be dialed in now. After all, the end-of-year holidays on our doorsteps.

The infamous Busiest Bar Night of the Year is nearly here. From November 23 through New Year’s Eve, people will be meeting up with family and friends. Many will also be seeking an escape from the stress of those gathering and the holidays.

Non-alcohol by the Numbers

One of the most important points made by Veylinx is this: Abstinence from alcohol isn’t limited to “social media” events like Dry January and Sober October.

Rather, consumers are choosing to abstain from alcohol throughout the year for myriad reasons. Specifically, Veylinx data reveals that more than 75 percent of Americans have abstained from alcohol consumption at some point for at least one moment.

Further, 46 percent of Americans plan to reduce their consumption of alcohol “right now.” As in, the holidays may be upon us but they’re actively working on a plan to drink less, not more.

Two major factors motivating this behavioral change are mental well-being and physical health. In service of those factors, more than half of LDA drinkers in America plan to replace beverage alcohol with non-alc beverages.

Interestingly, Veylinx finds that these consumers will pay more for non-alc alternatives in comparison to the general population.

Drilling down further, this shift in consumer behavior appears to be driven by a handful of consumer types:

  • 21- to 35-year-old consumers;
  • “light” drinkers; and
  • consumers who have set aside alcohol consumption for one month or more.

Speaking of the first group, demand for RTDs is 48 percent greater in comparison to those aged 35 or older. Add CBD to RTD and the demand among the 21 to 35 cohort grows by 18 percent.

However, not all non-alc growth comes from the 21-to-35 group. Non-alc beverages with mood boosters see an increase in demand from the 35-plus group of 29 percent.

In short, if an operator is ignoring the non-alc consumer, they’re harming their own business and reputation. Alcohol-free RTDs, cocktails, beer, and wine are growing.

Savvy operators will leverage that growth.

Image: Helena Yankovska via Unsplash

by David Klemt David Klemt No Comments

These are the Happiest Provinces in Canada

These are the Happiest Provinces in Canada

by David Klemt

Newfoundland and Labrador during daytime

If you’re wondering which province in Canada is the happiest, Statistics Canada has the answer—and the happiest may surprise you.

Of course, those who live and work in the happiest province won’t find it shocking. After all, they’re largely happy to be there.

However, if you expect the happiest province to be the home of Toronto, Vancouver, Montreal or Canada… Well, you’re in for a surprise.

Earlier this week we took a look at the happiest cities and states in America. Congratulations Fremont, California, and Hawaii, respectively. To learn where 181 other cities and 49 states rank, please click here.

The Happiness Survey

Or more accurately, the “life satisfaction” survey. For this survey, that’s what Statistics Canada reveals: life satisfaction.

Interestingly, the survey is very simple. Apparently, Statistics Canada simply asked participants to rate the satisfaction of living in their province, zero through ten. For this survey, zero is least satisfied, ten is most.

Ages 15 through 75 (and older) were able to participate. The survey was also broken down to gauge the satisfaction of men and women.

Before we jump into the breakdown of province satisfaction or happiness, some good news. Reviewing the Statistics Canada data, most participants across all age groups are happy. In fact, age groups 65 to 74 and 75-plus appear to be happiest.

On the other side, ages 15 to 54 had the most people who rated their life satisfaction between zero and five. Even so, just over 20 percent of survey respondents rated their satisfaction a five or less.

So, on the whole, Canadians seem satisfied or happy with their lives, regardless of the province in which they live. Personally, I find that to be great news.

The Happiest Province

Okay, let’s dive into the reason you’re here: to learn which province is the happiest.

  1. Newfoundland and Labrador
  2. Prince Edward Island
  3. Quebec
  4. New Brunswick
  5. Manitoba
  6. Alberta
  7. Saskatchewa
  8. Nova Scotia
  9. Ontario
  10. British Columbia

The above rankings are determined by the percentage of survey respondents who rated their life satisfaction eight, nine or ten. So, if you’re in Newfoundland and Labrador, Prince Edward Island or Quebec, wow—you’re apparently one incredibly happy person.

Conversely, below you’ll find the rankings as determined by the largest percentage of respondents who rated their satisfaction a five or lower. As you’ll find, the list below isn’t simply the inverse of the one above.

  1. Ontario
  2. British Columbia
  3. New Brunswick
  4. Alberta
  5. Nova Scotia
  6. Prince Edward Island
  7. Manitoba
  8. Saskatchewa
  9. Quebec
  10. Newfoundland and Labrador

As far as Canada overall, the results of this particular survey are positive. Just 19.4 percent of survey respondents rated their satisfaction or happiness zero through five. And only 28.9 percent provided a rating of six or seven.

More than half of Canadians, 51.7 percent, rate their lives an eight, nine or ten. That’s some great and welcome news.

Image: Erik Mclean on Unsplash

by David Klemt David Klemt No Comments

The Most-stressed Cities in the US

These are the Most-stressed Cities in the US

by David Klemt

Deflated smiley face balloon in street

There’s a simple argument to be made that one characteristic the happiest cities share is being among the least stressful to live.

Yesterday we took a look at the happiest cities in the US, according to WalletHub analysis. Click here in case you haven’t yet read that article.

Today, let’s check out the most- and least-stressed cities in America. As with their happiest and least-happy cities list, WalletHub ranks 182 cities based on stress levels.

Of course, “least stressed” doesn’t mean “stress-free.” Nor should it—some stress is good for us. After all, stress can push us to perform our best, bring out our problem-solving creativity, and even energize us.

The rankings below may surprise you. Like me, you may even find yourself raising an eyebrow and disagreeing with some of them.

However, it’s a compelling list worth reviewing if you’re an operator, leadership team member, hospitality professional, or in the site-selection portion of opening a restaurant or bar.

The Top 25 Cities of Stress

When determining their results, WalletHub ranked 182 cities according to four main categories. Those categories are: work stress; financial stress; family stress; and health and safety stress. The categories consist of 40 key metrics in total.

I think it’s safe to assume that no city wants to be in the top 25 of this list, or even the top 50. Neither, I’m certain, does any city want to wear the crown of “Most Stressed US City.”

Unfortunately, someone must be number one. Below, the top 25 “Cities of Stress,” per WalletHub:

  1. Cleveland, Ohio
  2. Detroit, Michigan
  3. Gulfport, Mississippi
  4. Baltimore, Maryland
  5. Philadelphia, Pennsylvania
  6. Memphis, Tennessee
  7. New Orleans, Louisiana
  8. Birmingham, Alabama
  9. Louis, Missouri
  10. Toledo, Ohio
  11. Augusta, Georgia
  12. Jackson, Mississippi
  13. North Las Vegas, Nevada
  14. San Bernadino, California
  15. Fayetteville, North Carolina
  16. Akron, Ohio
  17. Wilmington, Delaware
  18. Houston, Texas
  19. Montgomery, Alabama
  20. Shreveport, Louisiana
  21. Cincinnati, Ohio
  22. Newark, New Jersey
  23. Mobile, Alabama
  24. Columbus, Georgia
  25. Indianapolis, Indiana

Alas (I don’t get to use this word much), Ohio has four cities on this list. In fact, the Buckeye State has two cities in the top ten.

Of course, Ohio isn’t the only state with multiple cities in the top 25 stressed cities. Alabama has three cities among the top 25. Also, Mississippi and Louisiana each have two cities on this part of the list, unfortunately.

Cities 26 Through 91

As you’ll see below, Ohio shows up a couple of times in this portion of the list. However, so do a handful of other states.

For example, ten Texas cities land on this part of the list. That means Texas has 11 cities among the “top” half of the most-stressed US cities.

  1. Baton Rouge, Louisiana
  2. Las Vegas, Nevada
  3. Huntington, West Virginia
  4. Springfield, Missouri
  5. Dover, Delaware
  6. Norfolk, Virginia
  7. Milwaukee, Wisconsin
  8. Chicago, IL
  9. Newport News, Virginia
  10. Washington, DC
  11. Dallas, Texas
  12. Richmond, Virginia
  13. Tulsa, Oklahoma
  14. Chattanooga, Tennessee
  15. Bridgeport, Connecticut
  16. San Antonia, Texas
  17. Atlanta, Georgia
  18. Glendale, Arizona
  19. New York, New York
  20. Tucson, Arizona
  21. Columbia, South Carolina
  22. Columbus, Ohio
  23. Knoxville, Tennessee
  24. New Haven, Connecticut
  25. Brownsville, Texas
  26. Rochester, New York
  27. Casper, Wyoming
  28. Vancouver, Washington
  29. Oklahoma City, Oklahoma
  30. Jacksonville, Florida
  31. Corpus Christi, Texas
  32. Charleston, West Virginia
  33. Henderson, Nevada
  34. Phoenix, Arizona
  35. Modesto, California
  36. Wichita, Kansas
  37. Winston-Salem, North Carolina
  38. Little Rock, Arkansas
  39. Moreno Valley, California
  40. Louisville, Kentucky
  41. Stockton, California
  42. Spokane, Washington
  43. Fresno, California
  44. Miami, Florida
  45. Kansas City, Missouri
  46. El Paso, Texas
  47. Salem, Oregon
  48. Hialeah, Hawaii
  49. Los Angeles, California
  50. Fort Smith, Arizona
  51. Fort Worth, Texas
  52. Denver, Colorado
  53. Arlington, Texas
  54. Buffalo, New York
  55. Greensboro, North Carolina
  56. Bakersfield, California
  57. Fort Wayne, Indiana
  58. Providence, Rhode Island
  59. Tacoma, Washington
  60. Port St. Lucie, Florida
  61. Lewiston, Maine
  62. Laredo, Texas
  63. Cape Coral, Florida
  64. Grand Prairie, Texas
  65. Garland, Texas
  66. Aurora, Colorado

Cities 92 Through 137

This is where things begin to turn around, at least mathematically. This is the “bottom” half of the list.

Or, to phrase it another way, this section starts identifying the least-stressed cities in America.

  1. Portland, Oregon
  2. Ontario, California
  3. Lubbock, Texas
  4. Reno, Nevada
  5. Huntsville, Alabama
  6. Sacramento, California
  7. Amarillo, Texas
  8. Albuquerque, New Mexico
  9. Tampa, Florida
  10. Long Beach, California
  11. Colorado Springs, Colorado
  12. Fontana, California
  13. Tallahassee, Florida
  14. Las Cruces, New Mexico
  15. Worchester, Massachusetts
  16. Orlando, Florida
  17. West Valley City, Utah
  18. Fort Lauderdale, Florida
  19. Peoria, Arizona
  20. Riverside, California
  21. Mesa, Arizona
  22. Nashville, Tennessee
  23. Des Moines, Iowa
  24. Nampa, Idaho
  25. Tempe, Arizona
  26. Irving, Texas
  27. Oakland, California
  28. Grand Rapids, Michigan
  29. Charlotte, North Carolina
  30. Rancho Cucamonga, California
  31. Boston, Massachusetts
  32. Pittsburgh, Pennsylvania
  33. Honolulu, Hawaii
  34. Oceanside, California
  35. Pearl City, Hawaii
  36. Anchorage, Alaska
  37. Warwick, Rhode Island
  38. Virginia Beach, Virginia
  39. Cheyenne, Wyoming
  40. Petersburg, Florida
  41. Chesapeake, Virginia
  42. Billings, Montana
  43. Lexington-Fayette, Kentucky
  44. Durham, North Carolina
  45. Santa Ana, California
  46. Jersey City, New Jersey

Cities 138 through 182

Finally, we reach what cities, according to WalletHub analysis, experience the least amount of stress.

  1. Salt Lake City, Utah
  2. Aurora, Illinois
  3. Santa Clarita, California
  4. Glendale, California
  5. Manchester, New Hampshire
  6. Paul, Minnesota
  7. Garden Grove, California
  8. Pembroke Pines, Florida
  9. Yonkers, New York
  10. Chandler, Arizona
  11. Oxnard, California
  12. Juneau, Alaska
  13. Anaheim, California
  14. Santa Rosa, California
  15. Chula Vista, California
  16. Charleston, South Carolina
  17. Raleigh, North Carolina
  18. San Francisco, California
  19. Huntington Beach, California
  20. Omaha, Nebraska
  21. San Diego, California
  22. Gilbert, Arizona
  23. Scottsdale, Arizona
  24. Rapid City, South Dakota
  25. Austin, Texas
  26. Seattle, Washington
  27. Minneapolis, Minnesota
  28. Missoula, Montana
  29. Boise, Idaho
  30. Nashua, New Hampshire
  31. Plano, Texas
  32. Cedar Rapids, Iowa
  33. Lincoln, Nebraska
  34. Portland, Maine
  35. Irvine, California
  36. Burlington, Vermont
  37. Sioux Falls, South Dakota
  38. Bismarck, North Dakota
  39. San Jose, California
  40. Columbia, Maryland
  41. Fargo, North Dakota
  42. Overland Park, Kansas
  43. Madison, Wisconsin
  44. South Burlington, Vermont
  45. Fremont, California

Twelve of the cities on this part of the list are in California. Further, the least-stressed city in California: Fremont. If you read yesterday’s article, you know that WalletHub ranked Fremont, California, the happiest city in the US.

Image: Nathan Dumlao on Unsplash

by David Klemt David Klemt No Comments

Which Cities and States are the Happiest?

Which US Cities and States are the Happiest?

by David Klemt

Yellow smiley face ball

As an entrepreneur and operator evaluating a market for a first location or expansion, it can help to know where people are happiest.

Equally as helpful: Knowing the cities and states that are the least happy. Not, necessarily, so an operator can avoid these markets.

Rather, one’s concept may be a ray of stress-free sunshine for a given community. Providing a great workplace with a positive culture can work wonders for both the happiest and least-happy places. And as the cornerstones of the communities they serve, restaurants and bars can improve their guests’ quality of life.

We’ve looked at the US cities with the greatest inflow and outflow (which can reveal happiness levels), as identified by Redfin. And we’ve checked out the best US retirement cities, researched by Clever.

Now, we’re taking a look at which US cities and states are the happiest and least happy, according to WalletHub. In case you’re unaware, personal finance site WalletHub researches a vast array of topics. You can browse them here.

Happiest Cities

While determining which are happiest, WalletHub identified the happiest 182 cities. Obviously, that’s a far cry from how many cities are in the US.

According to one source, there 19,495 cities, towns, and villages across the country (per data from 2018). Of those, 4,727 cities have populations of 5,000 or more. A total of 310 cities have populations of at least 100,000, and only ten are home to one million people or more.

So, living in any of the 182 cities WalletHub suggests one is pretty happy. However, these are the ten happiest cities, in descending order:

  1. Fremont, California
  2. Columbia, Maryland
  3. San Francisco, California
  4. San Jose, California
  5. Irvine, California
  6. Madison, Wisconsin
  7. Seattle, Washington
  8. Overland Park, Kansas
  9. Huntington Beach, California
  10. San Diego, California

As you can see, six of the 10 cities are in California. In fact, 29 of the 182 cities on this list are located in the Golden State.

To create their list, WalletHub analyzed several metrics that make up three main categories: emotional and physical well-being; work environment; and community and environment.

Fremont, CA, is number one for emotional and physical well-being. The top spot for work environment goes to San Francisco, CA. And the number-one city for community and environment is Casper, Wyoming, which is number 79 on the list overall.

Least-happy Cities

Again, understanding that there are more than 19,400 cities, towns, and villages in the US alters the context of this list a bit.

Living and operating in one of these 182 cities indicates a person is living in a happy city. Basically, it isn’t the worst place to live if it’s on this list.

At any rate, let’s look at the 10 cities that make up the bottom of WalletHub’s list. Or, the “least-happy” cities, at least as far as these rankings are concerned.

  1. Detroit, Michigan
  2. Gulfport, Mississippi
  3. Memphis, Tennessee
  4. Huntington, West Virginia
  5. Montgomery, Alabama
  6. Cleveland, Ohio
  7. Augusta, Georgia
  8. Fort Smith, Arizona
  9. Mobile, Alabama
  10. Shreveport, Louisiana

Happiest States

WalletHub also ranked 50 states to determine the happiest and least happy. I checked, and, yep, that’s all of ’em! I will say it’s a bit disappointing they didn’t include Puerto Rico, but it isn’t the 51st state (yet).

WalletHub focused on 30 metrics to rank the states, which make up three main categories: emotional and physical well-being; work environment; and community and environment.

In descending order, the happiest states in America are:

  1. Hawaii
  2. Maryland
  3. Minnesota
  4. Utah
  5. New Jersey
  6. Idaho
  7. California
  8. Illinois
  9. Nebraska
  10. Connecticut

Hawaii doesn’t just take the top spot overall, it also claims number one for emotional and physical well-being. Utah takes first for work environment, and community and environment.

Rounding out the “happiest half” of the US are:

  1. Virginia
  2. South Dakota
  3. North Dakota
  4. Massachusetts
  5. New Hampshire
  6. Iowa
  7. Delaware
  8. Florida
  9. Georgia
  10. North Carolina
  11. Wisconsin
  12. Washington
  13. New York
  14. Maine
  15. Wyoming

Least-happy States

Conversely, the following are the least-happy states, starting with the unhappiest:

  1. West Virginia
  2. Louisiana
  3. Arkansas
  4. Kentucky
  5. Alabama
  6. Mississippi
  7. Oklahoma
  8. Tennessee
  9. New Mexico
  10. Missouri

Filling out the least-happy half of the country are:

  1. Alaska
  2. Michigan
  3. Ohio
  4. Indiana
  5. Texas
  6. Nevada
  7. Vermont
  8. South Carolina
  9. Kansas
  10. Arizona
  11. Colorado
  12. Montana
  13. Rhode Island
  14. Pennsylvania
  15. Oregon

In terms of the three metrics WalletHub analyzed, West Virginia is ranked last for emotional and physical well-being. Unfortunately, Mississippi is last for work environment. And Texas comes in last for community and environment.

Image: chaitanya pillala on Unsplash

by David Klemt David Klemt No Comments

Why is the SBA Sitting on RRF Funds?

Why is the SBA Sitting on Tens of Millions in RRF Funds?

by David Klemt

Pile of $100 bills

Three months after the revelation that the SBA is sitting on $180 million in RRF funds, we’re wondering why they still aren’t disbursing the money.

Oh, and a handful of American lawmakers have the same question. In fact, two members of the House and two senators are requesting a plan from the SBA.

The patience of Representatives Earl Blumenauer (D-OR) and Brian Fitzpatrick (R-PA) appears to be at its end. So, too, the willingness for Senators Kyrsten Sinema and Roger Wicker (R-MS) to simply wait and see.

So, the bipartisan lawmakers are playing hardball, sending a strongly-worded letter to the Small Business Administration.

$180 Million in Available Funds

As it turns out, there are are tens of millions of dollars in unallocated Restaurant Revitalization Funds. Months ago, the Government Accountability Office (GAO) investigated the RRF situation.

Back in July, the fruits of the investigation came to light: of the $28.6 billion in the RRF, $180 million have not been disbursed. Further, it was reported in August that the SBA was working the Department of Justice to “formulate a plan on how to distribute” the money.

It’s now November and…there’s no news. Well, there’s news, but it’s that four bipartisan lawmakers are demanding answers and action from the SBA.

Look, $180 million is a far cry from the $40 billion our industry needed and deserved to have approved to replenish the RRF. Indeed, if every dollar of this “found” money is distributed to RRF applicants, just 0.44 percent would receive a grant.

However, nearly $200 million in funds can still help some operators. There’s simply no excuse for the SBA failing to disburse the funds six months after the GAO made their discovery.

Clearly, several lawmakers agree with this assessment.

Lawmakers Seek Action from the SBA

Earlier this week, Reps. Blumenauer and Fitzpatrick, and Sens. Sinema and Wicker, sent a letter to the SBA. Not only are they seeking action from the SBA, they’re seeking a plan by next week.

“We request the SBA provide Congress with a detailed plan and timeline to distribute unobligated RRF funding as well as detailed information regarding the agency’s progress in retrieving misallocated funds and distributing those funds to eligible applicants no later than Monday, November 14, 2022,” reads the letter.

Further, the lawmakers make their position clear: “It is inexcusable for the Small Business Administration to not dispense every single available dollar to help as many of our nation’s still struggling main street businesses.”

According to reports, the lawmakers who penned the letter are working with the Independent Restaurant Coalition and National Restaurant Association. Reporting states that the IRC and NRA endorse the letter sent by the lawmakers this week.

As of the publication of this article, the SBA has issued no response. Unfortunately, that’s not exactly surprising. After all, they’ve been silent on this topic for months.

Image: Giorgio Trovato on Unsplash

by krghospitality krghospitality No Comments

2023: Year of the POS Systems?

2023: Year of the POS Systems?

by David Klemt

SpotOn POS system on laptop

Image from SpotOn press release

According to SpotOn, the industry could be in for a tech revolution next year as independent operators pursue more powerful POS solutions.

The results of a survey conducted by the cloud-based POS platform are rather revealing. In an effort to better understand where the industry is heading, SpotOn surveyed 300 independent and small-chain restaurant operators.

Both full-service and limited-service (LSR) concept operators participated in this SpotOn survey. Intended to identify the challenges operators face currently, the results reveal much more.

Below, the picture these survey results paint for the industry.

Legacy vs. Innovation

This isn’t the first time I’ve stated the following: Our industry hasn’t been the fastest to implement new technology.

However, we did appear to turn that around in 2021. Now, heading into 2023, our industry may be pursuing cutting-edge tech solutions even more fervently. Today’s guest expects more tech, and your team likely wants access to more modern tech that makes their jobs easier.

Per SpotOn’s survey, 81 percent of independent operators still use so-called “legacy” POS systems. These are “traditional” systems from companies that have been around for quite some time.

It’s not difficult to understand why the vast majority of independent operators continue using legacy systems:

  • Investing in a new platform requires expenditures of money and time.
  • Introducing a new POS platform requires staff training.
  • Staff need to grow adept at using the new system.
  • It can be daunting to research the available platforms and implementing change.

So, independent and small-chain operators have a choice to make: Stick with the familiar or invest in the future. Change can not only be intimidating, it can be expensive.

However, it seems that most operators are ready to throw comfort to the wayside and embrace innovation.

State-of-the-art Benefits

Should the SpotOn survey prove to be accurate snapshot of the industry, 75 percent of operators will implement new tech next year. According to SpotOn, this is largely in response to growing labor challenges, such as scheduling and retention.

The restaurant, bar, nightclub, and food truck platform found that operators are spending as much as 20 hours per week on administrative tasks. State-of-the-art POS systems can slash those hours by:

  • streamlining operations;
  • making scheduling simpler;
  • calculating tips and payout for payroll; and
  • managing overtime, an increasingly common task.

More modern POS platforms can automate labor management tasks, saving operators time, money, and frustration. Automation and streamlining give operators something invaluable: time.

In particular, innovative and helpful tech solutions provide an operator with time to focus on growing their business. When weighing whether to keep a familiar but less feature-rich POS system or invest in a modern platform that seamlessly integrates many solutions, ask yourself a couple important questions:

  • What’s my time worth?
  • What am I focusing on every day?
  • Am I growing my business or stagnating?
  • Is my current POS system helping or hindering my team?
  • Does my POS system streamline and automate any tasks?

Image: SpotOn

by David Klemt David Klemt No Comments

Are You Rewarding Voters Today?

Are You Rewarding Voters Today?

by David Klemt

"I Voted" stickers on a white background

Voting is one of the hallmarks of democracy, a right and privilege so crucial that one can’t overstate or exaggerate the value and importance.

It is, therefore, supremely unfortunate that access to this right has become so acrimoniously political. Of course voting relates to politics—that’s a given. That doesn’t mean the act itself should be disingenuously politicized for twisted means.

For example, far too many people have grown convinced that their vote means nothing. Further, it’s an outrage that voting is made so difficult for so many who know voting matters.

So important is this fundamental right, there are three amendments to the US Constitution protecting it specifically: the Fifteenth, Nineteenth, and Twenty-sixth.

Before going further, I’m not this passionate in support of only those who vote “my way.” I want every American of voting age to have easy access to cast their ballot. Equally as important to me, I want every American to feel like their vote means something.

Of course, that also means accepting results we don’t like. We don’t always get our way in a democracy, after all.

This is all to say the following: Operators can play a role in elections. A simple-yet-important role.

Encourage Voters

I’m not the first to say it: Restaurants and bars are the cornerstones of their communities.

Back in June, I expressed the role our industry plays across the country and globe: “Restaurants and bars are pillars, cornerstones of the communities they serve. These are businesses that welcome people in, treat them like family. They’re there for them as they move through their lives. People who were seemingly at odds with another routinely found common ground over a bite and a sip. More often than not, that’s still the case.”

I still believe this, and that’s why I believe operators can play a role on this Election Day, and those in the future. The role is simple but powerful: Encourage your community to get out there and vote.

Now, one clear way to motivate your community to get out there today is to reward those wearing “I Voted” stickers when they visit your restaurant or bar. It’s commonplace now for operators to offer voters food and drink discounts, free menu items, or other perks on Election Day.

Restaurants and bars around the country routinely execute this type of promotion. From free sides and snacks to discounts on entrees and drinks, operators throughout the US find ways to encourage voting.

Proceed with Caution

Just keep something in mind: Legal scholars say that when federal candidates are on the ballot, such promotions are illegal.

The interpretation of a particular federal statute makes it illegal to pay people to vote. “Paying” includes providing something of value in exchange for voting, such as food or a drink.

One workaround is to ensure anyone who enters your business can participate in your promotion. No “I Voted” sticker? No problem. A guest says they haven’t voted? Not a disqualification.

Another solution is to simply encourage your social media followers to vote and come by for a visit. No reward, necessarily, just encouragement to exercise their right.

In other words, be the supporter and motivator your community needs. And be careful about any promotions you may be offering today.

Image: Element5 Digital on Unsplash

by David Klemt David Klemt No Comments

Tipping is on the Ballot in Washington, DC

Tipping is on the Ballot in Washington, DC

by David Klemt

Folded dollar bills

Out of concern that people who work for tips aren’t making minimum wage in Washington, DC, Initiative 82 is on the ballot.

This is interesting for several reasons. One of which is the fact this isn’t the first time this issue has been voted on in DC.

Back in 2018, Initiative 77 was presented to Washington, DC, voters. The initiative took the $3.33 per hour minimum wage for tipped workers up to $15 per hour, the full minimum wage.

In June 2018, the measure was approved by voters. However, the Washington, DC, Council held a vote and repealed Initiative 77 after if had been passed.

Phil Mendelson (D-Chairman) of the Washington, DC, Council, introduced the bill that ultimately repealed Initiative 77 in October 2018.

“The Council amends laws all the time. And if a law is a bad law it should be amended or repealed,” said Mendelson at the time. “It doesn’t matter if the law was adopted by Congress, the voters, or ourselves.”

Further, Mendelson claimed that tipped workers themselves—bartenders, servers, valets, manicurists, and more—didn’t hold a favorable view of the passing of the initiative.

“77 may be well-intentioned, but the very people the Initiative is intended to help are overwhelmingly opposed. If we want to help workers – protect them from harassment and exploitation – there are better ways than Initiative 77,” Mendelson said.

One council member, Mary Cheh (D-Ward 3), opposed repealing Initiative 77 and addressed claims that it was harmful to tipped workers.

“Although I take these claims seriously, in my view they are speculative and not borne out by the experience of the other jurisdictions that have one wage,” said Cheh.

Support

Whenever increasing tipped worker wages to full minimum wage comes up, we tend to encounter the same arguments for and against.

Currently, the tipped hourly wage in DC is $5.35 per hour. In comparison, full minimum wage in DC is $16.10 per hour.

Now, as the law reads, if a tipped worker’s wages don’t equate to full minimum wage, their employer is expected to bridge the gap.

The key argument for the passing of Initiative 82 is simple: tipped workers should make at least minimum wage. These workers deserve the stability of knowing how much they’ll make each shift and earning a living wage (consistently, hopefully).

Those who support Initiative 82 also say that since the measure doesn’t outlaw tipping, tipped workers would earn more than minimum wage.

Opposition

Opponents, however, argue that the initiative will harm tipped workers. Some say that operators will cut shifts and increase prices in response to Initiative 82 passing. This will, of course, lead to servers, bartenders, and other tipped workers making much less than they did in the past.

Traffic may also decrease because it’s assumed that operators will increase costs significantly.

There’s also the argument that’s often (if not always) made when this topic comes up: Tipped workers themselves don’t support these initiatives.

“I have not met a single server who wants this,” Washington, DC, bar owner David Perruzza told the Washington Blade. Perruzza added, “The people who support this don’t know anything about the service industry.”

A Few Questions…

I’ve made no secret of my cynicism when it comes to politicians and their relationships with our industry.

My main argument was made for me: the Restaurant Revitalization Fund saga. We watched for months as Congress failed to replenish the RRF, leaving more than 177,000 operators and their staffs to fend for themselves. This, after months of dangling replenishment in front of all of us. Ultimately, they abandoned us.

Tellingly, Senator Rand Paul (R-KY) referred to RRF replenishment as a “bailout.” And apparently he doesn’t think much of the challenges operators have faced since the start of the pandemic, asking, “Where’s the emergency?” The closures of tens of thousands of restaurants and bars, often the cornerstones of communities across the country, doesn’t rank as an emergency, apparently.

So, Initiative 77, Initiative 82, and similar measures beg a few questions:

  • Do politicians actually ask their tipped-wage constituents their thoughts on this topic before introducing these ballot measures?
  • When these initiatives are being considered, do people just ask a few operator friends their opinions?
  • Do local, state, and federal politicians really have a grasp of our industry?

One thing is certain: Industry eyes across the country are on Initiative 82. If it passes, we can likely expect similar measures to be introduced in cities and states. Should it fail, it may be a while before another jurisdiction sees this type of initiative again.

Image: Annie Spratt on Unsplash

by David Klemt David Klemt No Comments

How a Chain Lost My Business Forever

How the Staff at a National Chain Lost My Business Forever

by David Klemt

Chocolate cookie and cookie crumbles

An unfortunate and entirely avoidable guest experience debacle guarantees that I’ll never spend another dollar at a particular national American chain.

What was supposed to be a small treat and excuse to get outside for a bit went downhill quickly.

Now, before I begin, I tend to shrug at poor service. Truly, a front-of-house team member has to go pretty far for me to do more than raise an eyebrow.

Given how the past two years-plus have gone, my tolerance has only grown. Everyone has bad days, including restaurant, bar, and hotel staff. In fact, I tend to assume that someone is simply having an off day due to an array of reasons: working several days in a row, opening and closing multiple times a week; having more responsibilities heaped on them due to being short staffed; a seeming increase in abuse from guests; stress spilling over onto the job; etc.

However, that doesn’t mean I’ll always return to be subjected to poor service in the future. What I experienced yesterday falls into this category: I won’t spend my money with this chain ever again.

Third-party Issues

As stated above, my visit to this national chain (600-plus locations) was intended to be a small treat. It was Halloween, they specialize in a particular type of confection, so why not?

Also, the temperatures have been in the 70s and lower in Las Vegas—perfect for a trip on my motorcycle. So, two treats in one, really.

Okay, so I’m going to do something I don’t like doing here: making an assumption or two. I think, however, I’m basing them on sound reasoning.

Additionally, I don’t like to use third-party delivery. In this case, the order was placed via Uber Eats for pickup using a monthly credit. Zero offense to third-party delivery drivers—it’s the corporations behind the services and the fees they charge operators I don’t support.

So, my assumption is that because the order came in via Uber Eats the staff figured I was “just” a delivery driver.

Downhill Fast

I’ll concede that this visit didn’t start off on the wrong foot: I received a decent welcome. Since I was picking up the order, I stood at the pickup counter, and confirmation came in before I arrived that the order was ready.

There were three guests waiting when I walked in, and one by one they got their orders and left. I didn’t think anything was going wrong until people walked in after me and received their orders. In terms of this chain, my order was on the smaller side.

After several minutes of being ignored, I was asked if I was picking up for Uber Eats. I clarified that no, I’m not an Uber Eats driver, I was picking up my order placed via Uber Eats.

Another several minutes went by as I watched larger orders get fulfilled ahead of mine. And then I was asked again—by the same staff member—who I was picking up for. Again, not an Uber Eats driver—my order.

At this point, I had been waiting more than 10 minutes. When I was finally given my order, I noticed another difference. Staff members showed guests their orders to confirm the contents before handing them over. My order, however, was taped closed behind the counter and handed to me.

It didn’t strike me that this is how this staff treats Uber Eats driver until I was on my bike. And that’s the problem.

Standards of Service

If this is how staff treats third-party delivery drivers, it’s appalling. There’s no excuse for treating drivers differently just because they aren’t the guest themselves or fellow employees.

Let’s be clear: anyone walking through a restaurant, bar or hotel’s doors deserves at least decent service. There are several reasons for this, and I shouldn’t have to address them. But, hey, we’re already here, so why not address a couple?

First, standards. If your staff is purposely treating a group of people poorly because they think they can do so without ramifications, your standards have slipped or there simply aren’t any. That’s a problem.

Are team members going to get to know regulars? Absolutely. Are they going to have favorites. Of course! And there’s nothing wrong with that. In fact, that’s what should happen—every front-of-house team member should cultivate their own regulars.

So, yes, some guests will treated differently. There’s a huge difference, however, between subjecting some guests to poor service intentionally and delivering outstanding service to favorites.

Quite simply, the minimum standard of service should be great service. “Decent” sucks; great should be the baseline.

Regulars and guests who staff have rapport with should receive service that’s above and beyond the standard level. Rock star servers and bartenders deliver outstanding service to everyone, regular or first-timer, gracious guest or grump.

Different Treatment?

Second, your staff shouldn’t be treating third-party delivery workers like they don’t matter. There’s zero room in hospitality for treating people poorly—doing so is in direct opposition to the spirit of this profession.

In fact, they shouldn’t treat difficult guests with anything but your expected standards. Leadership team members should be confronting rude or difficult guests, protecting the rest of the team.

I’ve read and heard about restaurant staff treating third-party delivery drivers poorly. Always, of course, with justifications thrown in: retaliation toward rude drivers, drivers not tipping…pick a reason. Again, if there’s a rude driver, staff should alert leadership and they should handle it.

Look, I’ve made no secret of my view on third-party delivery apps. Their fees and taking advantage of operators, particularly during the pandemic, infuriate me. And it’s easy to point at me and say I’m part of the problem, using a credit to place a third-party delivery. I’ll accept that criticism.

What I won’t do is return to a business with staff who think it’s acceptable to allow standards to slip and treat delivery drivers poorly. Most people seem to take delivery jobs to make ends meet. Hell, some of them are likely service industry professionals themselves working another job or jobs.

The labor shortage isn’t a valid justification for slipping standards or poor service. Dislike of third-party delivery services is no justification, either.

In fact, this chain obviously sees these delivery services as a viable income stream. The fact their staff doesn’t is a problem. If there’s a standard of service for this chain, it certainly wasn’t met when I was there. And if there’s a standard that I didn’t receive, there are several other problems.

Either way, the damage is done.

Image: Andre Moura via Pexels

by David Klemt David Klemt No Comments

Menus in Canada: Who Wants What Items?

Menus in Canada: Who Wants What Items?

by David Klemt

Bar and restaurant food and drink menus

Nobody has a crystal ball telling them what they should put on their menus to boost traffic and revenue, but we do have data.

In this instance, we have useful data regarding Canadian consumers specifically. Not only do we have helpful information from Restaurants Canada, David Henkes from Technomic has also weighed in. For those who are unfamiliar, Technomic is one of the best foodservice research and consulting firms.

Before we dive into Restaurant Canada’s menu trend information, this is not a review of the top menu item orders in Canada. For a deep dive into that topic in particular, please read our article “F&B in Canada: Top Menu Items.”

Instead, in this article we’re reviewing broader menu categories and interest in them among Canadian consumers. For your own copy of the 2022 Foodservice Facts report, click here.

Word of Warning

Now, it’s important to bear in mind that the data below is a snapshot. It’s important, informative data but it shouldn’t influence your menu completely.

In other words, when considering revising your menu in any way, make sure you’re staying true to your brand and the community you serve. If your data differs from Restaurants Canada and Technomic data, that’s okay.

Not only are there always outliers, not all data applies to every concept. So, don’t take drastic action on your menus based solely on the data below.

For this particular topic, Restaurants Canada asked three age groups about their interest in eight menu categories.

The groups are: 18 to 34, 35 to 54, and 55-plus. The industry advocacy group then reviewed the numbers for those who indicated they’re “very interested” or “somewhat interested” for each category or item.

Who Wants What?

The menu category generating the most interest from Canadian consumers, according to Restaurants Canada data, is food sourced from local farmers. Overall, 93 percent of survey respondents very or somewhat interested. Those in the 55-plus age group are the most interested.

More than 80 percent are interested in comfort foods, or creative riffs on comfort foods. Age groups 18 to 34 and 35 to 54 have the most interest. Precisely 80 percent are interested in trying globally inspired foods and flavors, led by the 18 to 34 age group.

Foods that promote health and wellness come next, with 79 percent of Canadian consumers showing interest. The 55-plus age group is particularly interested. However, dishes that utilize ingredients that boost one’s immune system are only popular among 53 percent of survey respondents. Interestingly, it’s the 18 to 34 age group with the most interest in this category.

In what’s possibly a contrast from American consumers, the final three categories have no more than 41 percent of survey respondents’ interest. Forty-one percent have interest in meatless and vegetarian items. Next, just 38 percent show interest in alcohol-free cocktails. Finally, just 33 percent are interested in plant-based burgers and sausages.

For each of those categories, the greatest interest comes from the 18 to 34 age group, and the 55-plus group shows the least amount of interest.

Recommended Reading

We’ve been reviewing the 2022 Foodservice Facts report from Restaurants Canada in depth for several weeks. To learn more about this important report, please read the following:

Image: Samuel Regan-Asante on Unsplash

by David Klemt David Klemt No Comments

Credit Card Competition Act, Take Two

Credit Card Competition Act, Take Two

by David Klemt

American Express charge cards

As we approach Election Day on November 8, it’s important to keep in mind that the Credit Card Competition Act of 2022 is still in play.

In fact, reports predict that another attempt to pass the bipartisan bill will take place in November. If reports are accurate, Senators Dick Durbin (D-IL) and Roger Marshall (R-KS) will try to include the bill in the National Defense Authorization Act (NDAA).

Now, that sentence and strategy may have you scratching your head. What, you may be asking yourself, do credit card fees have to do with defense spending?

Well, not much, truthfully. But you’re probably well aware that politicians will try to amend bills in bids to pass legislation they want. The common term for such a provision is “rider.”

It’s not difficult to understand why the Credit Card Competition Act has gone nowhere when we view Sens. Durbin and Marshall’s rider tactic.

Earlier this month, the senators attempted to include their bill within the NDAA. The reason is simple: the bill specifies the US Department of Defense’s (DoD) budget and expenditures each year. In other words, this is a “must-pass” bill.

However, Sens. Durbin and Marshall aren’t the only senators sponsoring bills. And they’re certainly not the only senators attempting to attach riders to the NDAA.

“It’s a bold strategy, Cotton.”

I will say, at least Sen. Durbin’s effort to attach the Credit Card Competition Act rider to the NDAA is somewhat related to the DoD.

You see, he and Sen. Marshall tried to tack on two amendments to push their bill through. The first amendment theorizes that veterans are being hurt by credit card fees. According to the senators, when military veterans make purchases at a military commissary, they are sometimes subjected to surcharges related to merchant interchange fees.

The second amendment brings the US Treasury Department and US Defense Department into the mix. This effort directs the departments to research just how much veterans are paying (annually, one would assume) in surcharges, and which companies these fees benefit. Then, the departments are to issue this report to Congress.

So, hey, points for attempting to make including the Credit Card Competition Act of 2022 relate to the NDAA for FY 2022. Of course, other senators are attempting to include their own riders. Should reporting prove accurate, some 900 amendments have been proposed. Supposedly, a few dozen might just make it.

This strategy didn’t work this month because the NDAA vote isn’t taking place in October. Instead, the plan is for the vote to take place sometime mid-November, when the US Senate reconvenes.

To learn more about the Credit Card Act of 2022, click here. If it’s a bill you support, let your elected officials know. Should you oppose the bill, let that be known to lawmakers as well.

Image: CardMapr.nl on Unsplash

by David Klemt David Klemt No Comments

F&B in Canada: Top Menu Items

F&B in Canada: Top Menu Items

by David Klemt

Closeup of hands holding burger

Those wondering what food and beverage menu items are performing best among consumers throughout Canada need wonder no more.

And why is that? Well, Restaurants Canada has the answers, revealing the top ten food and top ten beverage items.

Further, the organization compares each item’s performance. In this instance, Restaurants Canada analyses the percentage of orders that contained each food or beverage item from January to April 2022 in comparison to 2019.

These insights (and many more) are available in Restaurants Canada’s 2022 Foodservice Facts report. In fact, you can find our reviews of several of the restaurant advocacy group’s report topics via the links below:

For your own copy of this year’s Foodservice Facts report, click here.

Top 10 Canadian Drink Menu Trends

As you’ll see below, coffee is outperforming nearly every other beverage category. Specifically, Hot coffee is at the top, while Iced or frozen coffee is ranked third.

Unsurprisingly, Carbonated soft drinks / Pop / Soda split the two coffee categories. According to Restaurants Canada, the Carbonated soft drink category can credit its performance in large part to QSRs.

  1. Milk: 1.8% (2019) to 1.8% (2022)
  2. Iced tea: 2.9% (2019) to 1.6% (2022)
  3. Milkshakes / Smoothies: 2.1% (2019) to 2.0% (2022)
  4. Fruit juice: 3.8% (2019) to 3.0% (2022)
  5. Hot tea: 5.5% (2019) to 4.5% (2022)
  6. Alcohol beverages: 5.1% (2019) to 5.7% (2022)
  7. Water: 6.6% (2019) to 5.0% (2022)
  8. Iced or frozen coffee: 5.3% (2019) to 7.5% (2022)
  9. Carbonated soft drinks / Pop / Soda: 19.7% (2019) to 20.2% (2022)
  10. Hot coffee: 40.9% (2019) to 41.9% (2022)

Compellingly, Alcohol beverage performance in restaurants fluctuated by age group between 2021 and 2022. Alcohol order shares in restaurants, per Restaurants Canada:

  • Legal drinking Age (LDA) to 34: 46% (2021) to 43% (2022)
  • 35 to 49: 17% (2021) to 21% (2022)
  • 50-plus: 37% (2021) to 36% (2022)

Alcohol order shares in bars, according to Restaurants Canada:

  • LDA to 34: 35% (2021) to 35% (2022)
  • 35 to 49: 17% (2021) to 19% (2022)
  • 50-plus: 49% (2021) to 47% (2022)

Overall, the 35 to 49 age group appears to be consuming less alcohol in bars and restaurants in comparison to the LDA to 34 and 50-plus cohorts.

Top 10 Canadian Food Menu Trends

As Restaurants Canada notes, the Sandwich / Sub category has grown in 2022. Interestingly, the category just below it in growth, Chicken, is partially responsible for boosting Sandwich / Sub performance.

As far as entrees or “main attractions,” the Burger category remains at the top, beating out Breakfast, Sandwich / Sub, Chicken, and Pizza menu items.

  1. Cake / Squares / Muffins: 3.7% (2019) to 3.3% (2022)
  2. Salad: 4.3% (2019) to 3.8% (2022)
  3. Donuts / Beignets: 3.0% (2019) to 3.8% (2022)
  4. Breads: 4.3% (2019) to 3.4% (2022)
  5. Pizza / Panzerotti / Calzone: 4.1% (2019) to 4.3% (2022)
  6. Chicken: 7.6% (2019) to 8.5% (2022)
  7. Sandwich / Sub: 8.0% (2019) to 8.5% (2022)
  8. Breakfast: 10.8% (2019) to 11.4% (2022)
  9. Burger: 9.0% (2019) to 10.9% (2022)
  10. French fries / Potato / Sweet potato / Onion rings: 15.0% (2019) to 16.1% (2022)

Image: Nathan Dumlao on Unsplash

by David Klemt David Klemt No Comments

Bon Appétit Reveals Best New Restaurants

Bon Appétit Reveals the Best New Restaurants in 2022

by David Klemt

Fine dining Ecuadorian dish

Condé Nast’s American food and restaurant publication Bon Appétit identifies the 50 restaurants they deem the very best in 2022.

The intriguing list highlights the consumer desire to try a wide range of global cuisines. Indeed, were one to eat their through Bon Appétit‘s 2022 list, they’d enjoy both traditional and modern:

  • African (notably, Nigerian)
  • Cantonese
  • Caribbean
  • Eastern European (Hungarian, in particular)
  • Filipino
  • French
  • Indian (including Goan and Kashmiri)
  • Italian
  • Japanese
  • Jewish
  • Korean
  • Laotian
  • Mexican
  • Palestinian
  • Portuguese
  • Vietnamese

Of course, one will also find American cuisine. Of note, Texas barbecue, elements of Memphis barbecue, Low Country, Cajun cooking, and Midwest comfort food. There are also restaurants offering creative takes on traditional steakhouse fare. One restaurant’s focus, The Nicolett in Lubbock, Texas, is High Plains cuisine. (For those wondering, Bon Appétit describes this as “West Texas terroir.”)

This is a compelling list, showing that consumers crave a balance between comfort food and stepping outside of their comfort zones to discover cuisines that are new to them. I encourage everyone to look into these restaurants for inspiration and motivation.

Regional Performance

For simplicity, Bon Appétit arranges their list by dividing the US into four large regions: Midwest, Northeast & Mid-Atlantic, South, and West.

Interestingly, the South claims the most restaurants on this list of the 50 best, earning 17 spots. Northeast & Mid-Atlantic restaurants grab 15 spots, the West takes 12, and the Midwest claims just six.

When it comes to the South, Texas performs the best in terms of number of restaurants on the list. There are two in Austin, and one each in Fort Worth, Garland, Houston, Lubbock, and San Antonio.

However, Florida, Georgia and Louisiana also do well for the South, earning three spots each in the following cities:

  • Miami (2) and North Miami (1)
  • Atlanta (2) and Savannah (1)
  • New Orleans (3)

Unsurprisingly, New York leads the way for the Northeast & Mid-Atlantic region. Drilling down, Brooklyn boasts four of Bon Appétit‘s 50 Best New Restaurants 2022; New York City is the home of three; and one is in Hudson.

Pennsylvania, however, claims three spots, all in Philadelphia.

Equally as foreseeable, California boasts the most restaurants among this list of fifty. Predictably, most are in Los Angeles, which claims three in total. Oakland, San Diego, and San Francisco round out California’s spots with one each. Coming in second in terms of Western states with multiple restaurants on the list is Oregon, with two in Portland.

Unfortunately, the Midwest simply doesn’t perform nearly as well on this year’s list as its counterparts. In fact, it has just half the number of restaurants as the third-place region with six. Cincinnati, Ohio, takes a third of those spots. Surprisingly, Chicago is home to just one restaurant on this list.

The 50 Best New Restaurants

Below you’ll find Bon Appétit‘s list in alphabetical order.

  • Agi’s Counter (Brooklyn, NY)
  • Baba’s Pantry (Kansas City, MO)
  • Bacanora (Phoenix, AZ)
  • Bata (Tucson, AZ)
  • Birdie’s (Austin, TX)
  • Bocadillo Market (Chicago, IL)
  • Bonnie’s (Brooklyn, NY)
  • Cafe Mochiko (Cincinnati, OH)
  • Cafe Mutton (Hudson, NY)
  • Canje (Austin, TX)
  • Common Thread (Savannah, GA)
  • Daru (Washington, DC)
  • Daytrip (Oakland, CA)
  • Dear Annie (Cambridge, MA)
  • Dept. of Culture (Brooklyn, NY)
  • El Rincon del Maiz (Garland, TX)
  • Gage & Tollner (Brooklyn, NY)
  • Good Good Culture Club (San Francisco, CA)
  • Her Place (Philadelphia, PA)
  • Irwin’s (Philadelphia, PA)
  • Juniper Cafe (Atlanta, GA)
  • Kingfisher (San Diego, CA)
  • Korshak Bagels (Philadelphia, PA)
  • La Diabla Pozole y Mezcal (Denver, CO)
  • La Onda (Forth Worth, TX)
  • Lasita (Los Angeles, CA)
  • Lengua Madre (New Orleans, LA)
  • Los Félix (Miami, FL)
  • Lucian Books and Wine (Atlanta, GA)
  • Ma Der Lao Kitchen (Oklahoma City, OK)
  • March (Houston, TX)
  • Mid-City Restaurant (Cincinnati, OH)
  • Mister Mao (New Orleans, LA)
  • Morchella (Portland, OR)
  • The Nicolett (Lubbock, TX)
  • One White Street (New York, NY)
  • Paradis Books & Bread (North Miami, FL)
  • Phởcific Standard Time (Seattle, WA)
  • Quarter Sheets (Los Angeles, CA)
  • Reese Bros Barbecue (San Antonio, TX)
  • Regards (Portland, ME)
  • República (Portland, OR)
  • Seafood Sally’s (New Orleans, LA)
  • Semma (New York, NY)
  • Sozai (Clawson, MI)
  • Sunny’s Steakhouse (Miami, FL)
  • Supperland (Charlotte, NC)
  • Uncle Lou, New York, NY)
  • Yangban Society (Los Angeles, CA)
  • Z&Z Manoushe Bakery (Rockville, MD)

Image: Kiyoshi on Unsplash

by David Klemt David Klemt No Comments

Learn to Homebrew Day Returns on Nov. 5

Learn to Homebrew Day Returns on November 5

by David Klemt

Snifter of beer on driftwood at beach

On Saturday, November 5, the American Homebrewers Association and brewing and fermenting fans will celebrate the 24th annual Learn to Homebrew Day.

If you’re not familiar with this holiday, it’s not difficult to understand or participate. As the name implies, Learn to Homebrew Day is about learning how to brew beer at home. More accurately, it’s about learning the science and process of brewing beer yourself.

Participation is simple: All participants follow the same recipe, which the American Homebrewers Association (AHA) provides. This year, the recipe will (perhaps “should” is more apt, depending on your ability to follow instructions) produce one gallon of Hoppy Amber Ale.

According to Northwest Beer Guide, this ale sends Amber into the IPA space and is a great brew for experts and neophytes alike.

Learn to Brew

Established in 1999, Learn to Homebrew Day isn’t difficult in terms of taking part. In fact, pledging to participate also gets you $5 off an annual AHA membership.

One perk that caught my eye is access to a database of myriad homebrew recipes, including ciders and meads.

For this year’s holiday, the AHA provides the recipe. Additionally, the association provides several resources to help homebrewers, inluding:

  • tutorials, such as “All-Grain (Batch Sparge) Homebrewing” and “All-Grain (Brew in a Bag) Homebrewing.”
  • lists of must-have and nice-to-have brewing equipment;
  • a search engine to help participants find necessary equipment in their area; and
  • a link to the Facebook page for Grainfather, a manufacturer of top-quality, technologically enhanced smart homebrew equipment.

Speaking of social media, make sure to follow the AHA on Instagram ahead of November 5.

Interestingly, while the AHA has “American” in its name, there are international participants. According to the AHA website:

  • there are, as of October 23, 147 people pledging to participate;
  • the 147 participants are from nine countries;
  • participants span 36 states and territories;
  • and participants have pledge to brew 925 gallons.

Why Participate

So, let’s say you’ve never brewed your own beer at home. “Why,” you may be asking yourself, “should I take part in Learn to Homebrew Day this year?”

One good reason is that if you’re reading this, you likely play a role in the food and beverage. Beer, of course, is a huge part of the F&B world. And there’s no arguing that craft beer and microbrews are very important to many restaurants and bars.

Gaining the ability to understand and speak intelligently about the products you sell is of great benefit to all F&B and hospitality professionals. Today’s guest knows much more than they ever have before. Many want to engage the front-of-house team members who serve them about what they’re consuming.

If you’re an operator or leader of the membership team—particularly of a venue with a serious focus on beer—encourage your teams to take part. There’s no downside to gaining knowledge of and experience with the products they serve to guests.

Another great reason to participate? It’s going to be fun. That may seem like a shallow or flippant reason. But think about this: How many stories of craft brewers, craft breweries, brewpubs, and taprooms start with trying out homebrewing?

Learn to Homebrew Day may just spark your next great idea. That idea may be kicking off your microbrewery or brewpub ownership adventure.

If you love (or even just like) beer, follow this link to learn more about Learn to Homebrew Day. Happy brewing!

Image: by George Cox on Unsplash

by David Klemt David Klemt No Comments

Cali Chains Move Quickly to Kill FAST

California Chains Move Quickly to Kill FAST

by David Klemt

Huge pile of cash

If recent reporting is accurate, fast food chains with locations in California are fighting the Fast Food Accountability and Standards Recovery Act.

Several well-known restaurant chains have reportedly already dumped well over $10 million into a ballot drive effort. Among the chains lobbying to kill the bill are In N Out, McDonald’s, Wendy’s, and Chipotle.

In other words, the group of chains aiming to defeat AB-257 in California have very deep pockets. These heavy hitters are reaching deep to contribute millions of dollars to Save Local Restaurants, the coalition responsible for starting the ballot initiative.

And who are the Save Local Restaurants coalition members? The National Restaurant Association (NRA), US Chamber of Commerce (USCC), and International Franchise Association (IFA).

What is AB-257?

The Fast Food Accountability and Standards Recovery Act, also known as the FAST Act, is a California bill. Enacted on September 5 of this year, FAST amends a section of the state’s labor code that relates to food facilities and employment.

Click here to review the bill’s text in its entirety.

To summarize, FAST does the following:

  • Establishes the Fast Food Council, ten members appointed by the Governor, the Speaker of the Assembly, and the Senate Rules Committee. The council will operate until January 1, 2029.
  • Defines “the characteristics of a fast food restaurant.”
  • Gives the Fast Food Council the authority to set “minimum fast food restaurant employment standards, including standards on wages, working conditions, and training.”
  • Provides the council the power to “issue, amend, and repeal any other rules and regulations, as necessary.”
  • Allows the formation of a Local Fast Food Council by a county, or a city that has a population of more than 200,000.

It’s that third bullet point that likely stands out the most to chain operators. On January 1, 2023, California’s minimum wage increases to $15.50 an hour. If the Save Local Restaurants ballot initiative fails, the Fast Food Council could boost the minimum wage to $22 per hour right after we all yell, “Happy New Year!”

Proponents say the bill protects the health, safety, and welfare of fast-food workers. Opponents call it radical.

Fighting FAST

According to Save Local Restaurants, it’s not just chains that want to kill FAST:

“The FAST Act is opposed by small and family-owned businesses, minority-rights groups, workers, consumers, your favorite restaurants, taxpayers and community-based organizations,” reads their website.

Among their reasons for attempting to kill the bill are:

  • a resulting increase in the price of food;
  • the elimination of thousands of jobs in California;
  • an increase in the cost of living in the state; and
  • the millions of dollars the coalition claims the bill will cost California taxpayers annually.

Reportedly, full-service restaurant operators also oppose FAST. The reason is simple: If the Fast Food Council hikes fast-food worker minimum hourly wages significantly, FSRs will struggle to compete. FSR operators will have to hike menu item prices further, a situation that’s growing untenable as consumers balk at paying more at restaurants.

Then, there’s the fact that bills similar to FAST could pass in other states. So, chains are contributing millions to see that the Save Local Restaurants ballot initiative succeeds.

Should the effort be successful, FAST will be included on California’s 2024 ballot. That means it will be suspended until 2024 and be in the hands of the voters.

Image: Tima Miroshnichenko via Pexels

Top