To some, the Holy Trinity refers to the Christian doctrine of the Father, the Son, and the Holy Spirit. But what’s the Cajun Holy Trinity?
Well, that’s a whole different story with which some people may not be as familiar. However, it carries equal weight in certain kitchens of the world.
Lending its name from religious credo, the Cajun Holy Trinity was developed in the state of Louisiana in the southern United States. Chef Paul Prudhomme gets the credit for introducing the term in 1981, along its popularization.
Cajun or Creole cuisine evolved from French, Spanish, and West African immigrants. French traditions blended into a melting pot of West African, Spanish, and Native American cuisines. The French and the Acadians (French colonists deported from Acadia in what is now Nova Scotia, Canada) both influenced Louisiana’s cuisine. The Acadians became known as Cajuns to English speakers, and thus Cajun cooking grew out of necessity in Louisiana.
It’s incredible what three (and sometimes just one or two more) simple ingredients can do to create incredible dishes.
by Nathen Dubé
Understanding the Culinary Holy Trinity
Mirepoix 101
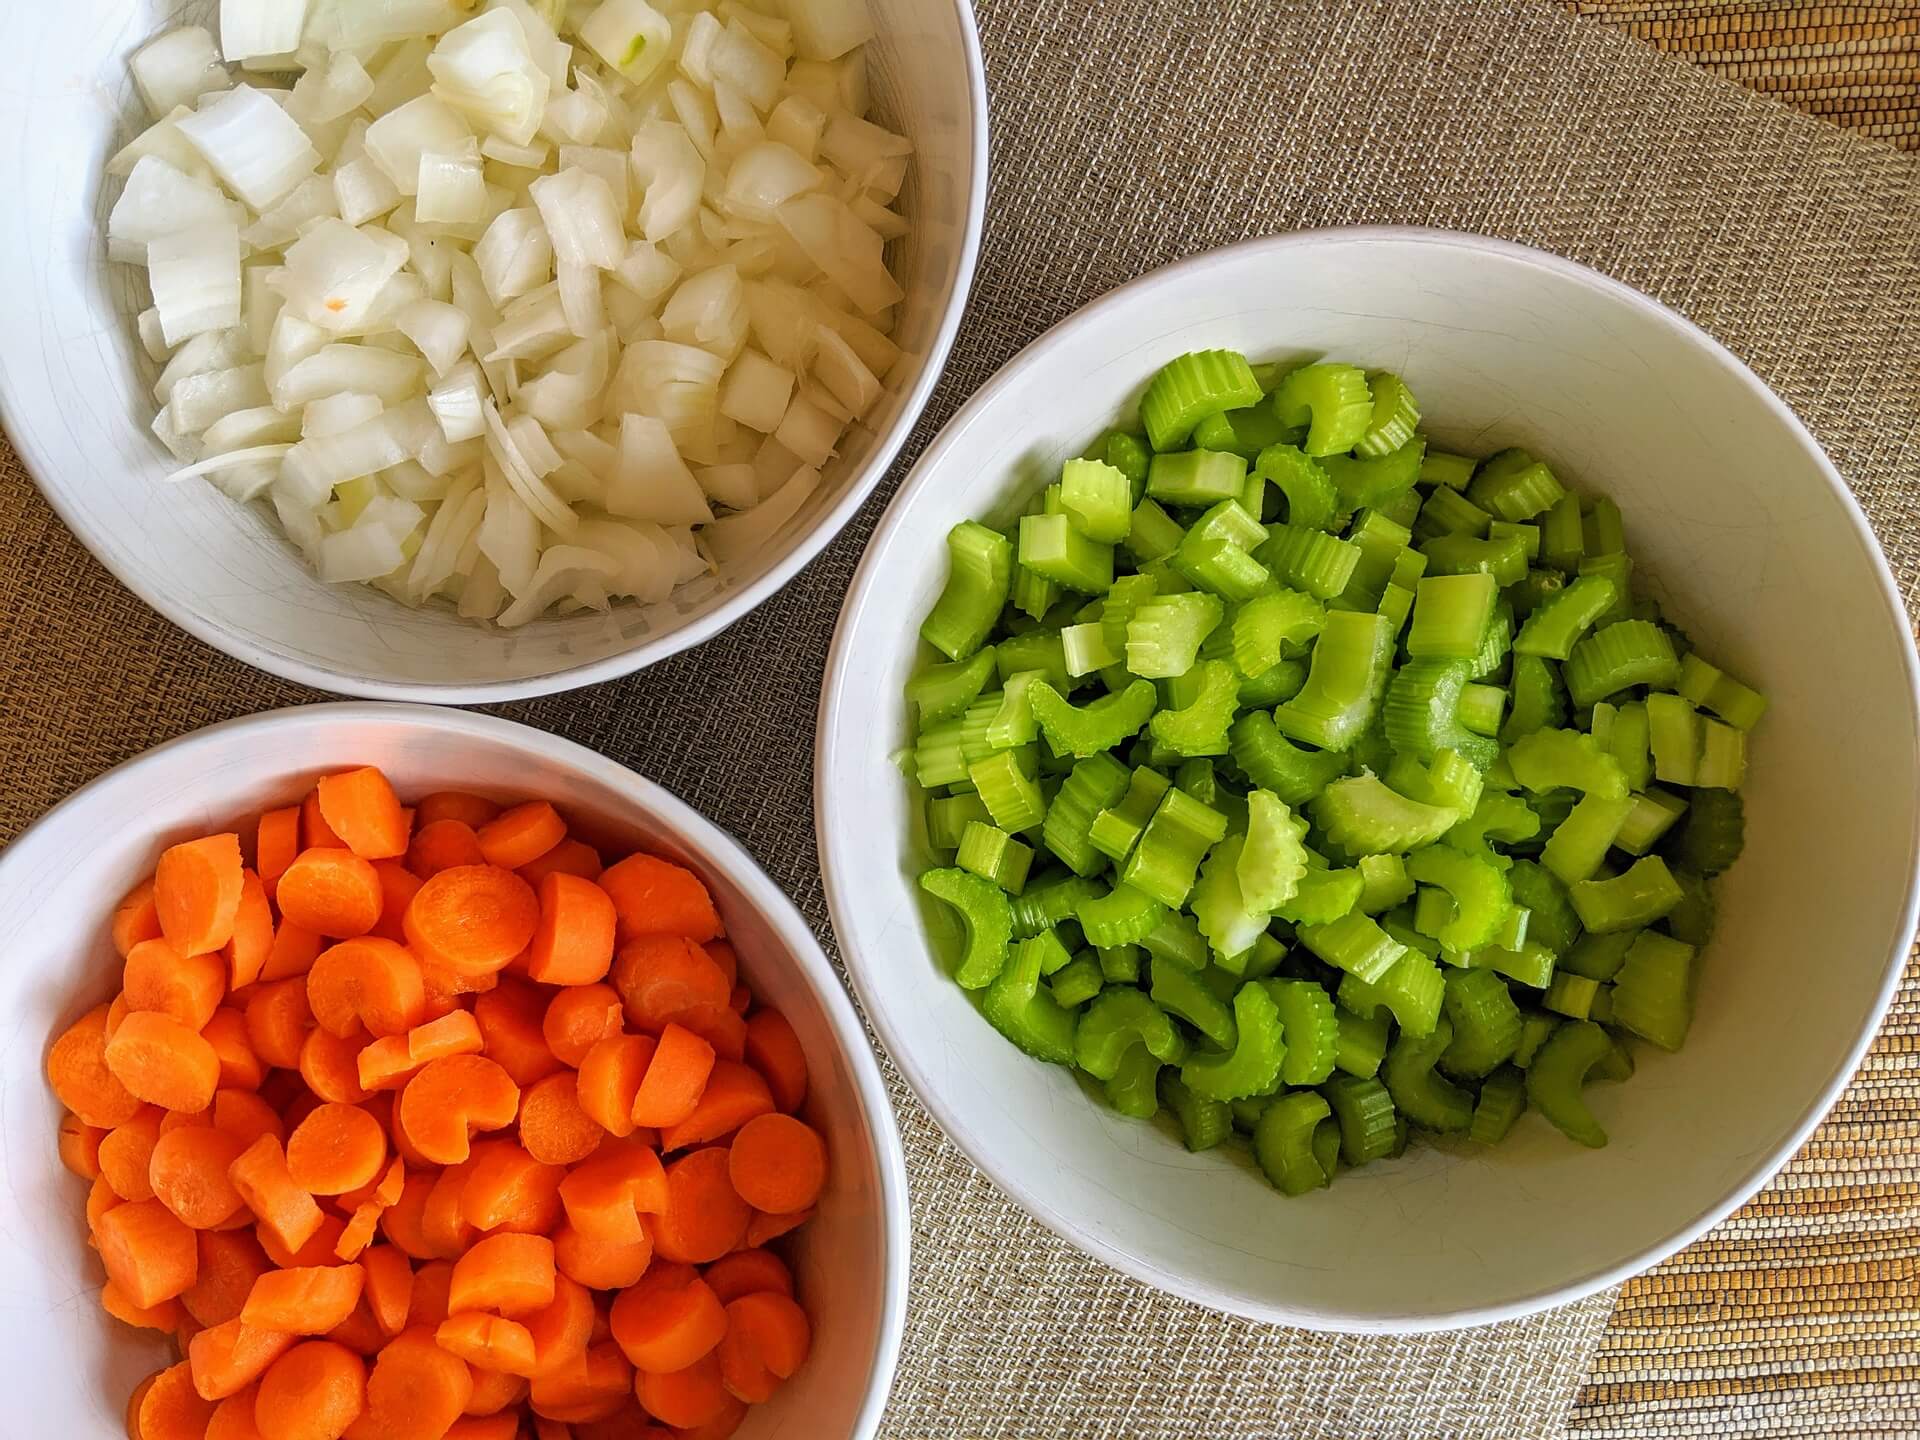
The French contributed two staples directly to Cajun and Creole cooking: roux-based cooking and the trinity of mirepoix, or onions, celery, and carrots. In Louisiana, however, carrots didn’t grow as easily as bell peppers. So, bell peppers, typically the more bitter green version, replaced them.
Some cooks were so bold as to add garlic to the Holy Trinity, referring to it as the Pope. Other variants use garlic, parsley, or shallots in addition to the three Trinity ingredients. Unlike the elaborate French dishes using mirepoix, the Holy Trinity is more symbolic of rustic, family-style meals.
These ingredients are the first to go into the pot or skillet, creating a flavorful foundation for gumbo, jambalaya, crawfish étouffée, and more. Often, by adding a bit of flour and whisking, a roux is built right on top of these sweet and colorful aromatics to form a thicker base.
The ratio is also overturned from the traditional mirepoix of two parts onion, one part celery, one part carrot, with three parts onions to two parts celery to one part bell pepper.
Practical Application
So, now that we know what it is, how do we use it?
First, the ingredients are finely diced, then sauteed in oil, fat, or butter until translucent and tender. This stage of cooking draws the water from the vegetables, concentrating their natural flavors.
You can continue cooking the ingredients down until they’re caramelized, which is to say the sugars come out and brown them in the pan. They’ll become easy to break down with the back of a spoon. There’s a further concentration of flavors but we’re approaching the law of diminishing returns.
The shorter the cooking time of the end dish, the smaller size the pieces should be. For longer times, they can be cut into larger pieces. For obvious reasons, we want our ingredients to cook evenly, as well as withstand the timeframe of the cooking. You don’t want minced vegetables in a stock that’s going to simmer for 10 hours, the same way we don’t want giant chunks in a soup that’s done in 30 minutes. Texture of the end product are also important, not just flavor.
Here are examples of some recipes that include the Cajun Holy Trinity:
- Chicken and Sausage Jambalaya
- Cajun Gumbo with Andouille Sausage
- Chicken and Okra Gumbo
Looking at other cuisines of the world, we’ll find some interesting variations. Interestingly, however, we’ll find similarities in the use of a category of vegetables and herbs called “aromatics.” In the Western world, these are vegetables like garlic, onions, carrots, celery, and herbs like bay leaves, thyme, parsley, and peppercorns.
In Asia you’ll find green onions, ginger, garlic, and warming spices like cinnamon and clove. These mixes are usually sautéed to slowly draw out flavors that can carry a dish. Sofrito and its Italian counterpart, soffritto, literally mean to stir-fry.
French Cuisine
The term mirepoix is encountered regularly in French culinary texts by the 19th century.
In 1814, Antoine Beauvillier wrote a recipe for Sauce à la Mirepoix in his book L’Art du Cuisinier. It’s a short recipe for a buttery, wine-laced stock garnished with an aromatic mixture of carrots, onions, and a bouquet garni. Marie-Antoine Carême created a similar recipe in 1816, calling it simply “Mire-poix.”
The origins are cloudy but what’s clear is the basic mirepoix ratio: two parts onions, one part celery, one part carrots by weight. These vegetables are often finely chopped and sautéed, but they can be used whole or roughly chopped in slowly simmered stocks or braises. A simple ratio for bones to mirepoix for a stock is 10:1.
When chopping, be particular about uniformity. This ensures even cooking when sweating or deeply browning them for a heartier flavor.
If cooking further, the addition of tomato purée creates a mixture called pinçage, which smells incredibly rich and transforms a braise into a near-religious experience. The addition of some chopped thyme and rosemary elevates further.
Another alternative is the mirepoix au gras (“with fat”): the addition of diced ham or pork belly.
Hands down, however, the most famous example of the power of French mirepoix is the humble chicken soup. It capitalizes on the aromatic qualities and depth of the caramelized vegetables. Similar combinations—both in and out of the French culinary repertoire—can include leeks, parsnips, garlic, tomatoes, shallots, mushrooms, bell peppers, chilies, and ginger.
White mirepoix (which substitutes leeks and parsnips for the onions and carrots) is used when you want a white color in the final dish. It might be a stretch to include the French duxelles (mushrooms and often onion or shallot and herbs, reduced to a paste), but leave no stone unturned, I say.
Mirepoix Recipes to Try
- Roasted meats, like turkey
- Chicken Noodle Soup
- Braised Short Ribs
- Vegetable soups
Italian Soffritto
Referred to as battuto before it’s cooked, soffritto is the combination of onions, celery, carrots, garlic, and parsley, although there are quite a few variations on this mixture. Soffritto can also include bell peppers, fennel, and finely diced cured meats like pancetta or prosciutto.
There’s no set ratio for the ingredients. This combination forms the foundation for soups like minestrone, the base for pasta sauces such as ragù, stews, and braises throughout Italian cuisine.
While both mirepoix and soffritto serve as building blocks of flavor, there are a few subtle differences.
Mirepoix is made by sweating onions, celery, and carrots. Soffritto uses minced rather than diced vegetables. And, indicative of Italy, the use of olive oil trumps butter in the cooking process.
Soffritto recipes to try
- Ragú Bolognese
- Italian Wedding Soup
- Pasta e Fagioli (Pasta and Bean Soup)
- Braised Sausage, and Kale with Rosemary
Spanish Sofrito
While saffron and seafood are the clear stars of the classic paella, it’s sofrito—the mixture of onion, garlic, bell peppers, and tomatoes (sometimes paprika) cooked in olive oil—that sets the stage. Although it may seem ludicrous, the removal of the sofrito and not the prime seafood on top would do more damage to the final dish.
This is where we begin to see the introduction of the New World. After the 16th century, Catalonia in particular “discovered” the tomato and began using it in everything. Bell peppers, onions, and garlic are the other ingredients that make up sofrito.
The medieval recipe book Libre de Sent Sovi shows that Catalan cuisine historically used native ingredients to make sofregit. Most Old World-style dishes call for onions, leeks, carrots, and salt pork, in place of the yet to be discovered tomato, so the sofritos of the 1300s can be interpreted loosely.
From the Mexican American border to the tip of Argentina, and all of the islands in between, Latin America has taken the Spanish sofrito and adapted it to its local offerings. Cuban sofrito tends to look the closest to Chef Prudhomme’s Holy Trinity, but with more garlic, while the Ecuadorian version includes freshly toasted cumin, tomatoes, onions, garlic, and sweet cubanelle peppers.
Sofrito recipes to try
- Seafood Paella
- Spanish Beef Stew with Pimentón and Piquillo Peppers
- Spanish Chickpea and Spinach Stew
- Nicaraguan Arroz con Pollo
Puerto Rican Sofrito
In Puerto Rico, many dishes start with recaíto, the perfumed flavor of culantro, ají dulce, onions, cubanelle peppers, and garlic. Often referred to as “blessed thistle,” the long, jagged-edged, leafy culantro has a similar taste to cilantro.
For this Caribbean island’s sofrito, known as recaíto, culantro leaves are minced and added to ajíes dulces, small but essential chilies in Puerto Rican cuisine. Add onions, cubanelles, garlic, and cilantro, and you have a mild, bright-green paste that adds a fresh, herbal punch to stews and rice dishes.
In the Caribbean, sofrito refers to a wide variety of mixtures; one common type includes lard colored with annatto seeds and mixed with ingredients like chiles, bell peppers, onion, cilantro, oregano, and ham. You can find variations on this sofrito throughout Central and South America.
Suppengrün
In case the umlaut didn’t give it away, the German answer to mirepoix—suppengrün—translates to “soup greens.” The Dutch equivalent is soepgroente.
Suppengrün typically consists of carrots, celery root, and leeks in no set ratio. Sometimes onions, parsnips, and potatoes are added. It may also contain parsley, thyme, celery leaves, rutabaga (a.k.a. swede), or parsley root.
The mix depends on regional traditions. Vegetables used are cold-climate roots and bulbs with long shelf lives. Suppengrün acts like herbs and imparts hearty, strong flavors to the soup or sauce, providing a foil for other strong-tasting ingredients such as dried peas and beans, or pot roast.
Large chunks of vegetables can be slow cooked to make rich soups and stocks, and are discarded when they have given up most of their flavor. Finely chopped suppengrün are browned in fat and create the base for a finished sauce. The vegetables may be cooked long enough to fall apart and become part of the sauce or pureed.
Suppengrün recipes to try
- Beef Sauerbraten with Red Cabbage and Pretzel Dumplings
Włoszczyzna
From Poland, włoszczyzna is similar to its German counterpart but with red cabbage as the main ingredient.
Włoszczyzna is the Polish word for “soup vegetables” or greens. The literal translation is “Italian stuff,” stemming from Queen Bona Sforza d’Aragona—who was Italian—who married Polish King Sigismund I the Old in 1518. The queen no doubt brought her own cooks to the Polish court and introduced this concept to Polish cuisine.
A włoszczyzna may consist of carrots, parsnips or parsley root, celery root or celeriac, leeks, and savoy or white cabbage leaves. Sometimes, cooks also use celery leaves and flat-leaf parsley. Bay leaves and allspice grains are found in certain iterations.
The most typical packaged combination is celery root, parsley root, carrots, and leeks. Włoszczyzna is usually cut to uniform size and boiled as a flavor base for soups and stews.
Włoszczyzna recipes to try
- Pork, Cabbage, and Potato
- Barszcz (traditional Polish borscht)
Other Variations from Around the World
The Ukrainian or Russian smazhennya or zazharka consists of onion, carrot, and beets (and sometimes celery).
Refogado is the Portuguese base is made from onions, olive oil, minced garlic, and bay leaf. There’s a variation with tomato paste instead of fresh tomato influenced by the Eastern Mediterranean and Balkans regions.
Chinese/Cantonese cooking uses a base of scallions, ginger, and garlic. In Sichuan cooking you’ll often find a mixture of chili peppers, Sichuan peppercorns, and white pepper.
The amount of varied flavors and spices in Indian cuisine is incredibly vast and can differ from neighbor to neighbor. However, many of these dishes begin with basic mixture of garlic, ginger, and onion.
West African cuisine is another example of a huge amount of variety, but one common flavor base is the trio of tomatoes, onions, and spicy chiles.
The Haitian Epis has African origins with similarities to sofrito which is used in Hispanic cuisine. Parsley, scallions, garlic, citrus juice, and Scotch bonnet peppers are combined to create this base. Haitian Epis is used for finishing sauces, marinating meat and fish, and flavoring rice and bean dishes, as well as soups, and stews.
Hopefully you’re now inspired to try out a new combination or two, or even make up your own Holy Trinity. The possibilities are literally endless. But first, you owe it to yourself to learn a new Cajun recipe, starting with Chef Prudhomme’s Holy Trinity.
Image: Cindy from Pixabay
Related Reading
Work with Us
Click the image below to work with us on your restaurant concept.