8 Bourbon Cocktails You Need to Know
David Klemt
This is the culmination of all our Bourbon Heritage Month coverage, our final word on the subject: the bourbon cocktails you must know.
Yes, there are those out there who bristle at the thought of enjoying their favorite spirit being adulterated.
Combining bourbon with mixers, modifiers, even ice?! “Blasphemy,” they hiss.
Personally, we believe in enjoying spirits however you want. That’s doubly true for paying guests.
So, this is for those who appreciate their bourbon with ingredients beyond a drop of the world’s most pure water or an impossibly clear ice cube.
Here are the bourbon cocktails you and your bar team need to know.
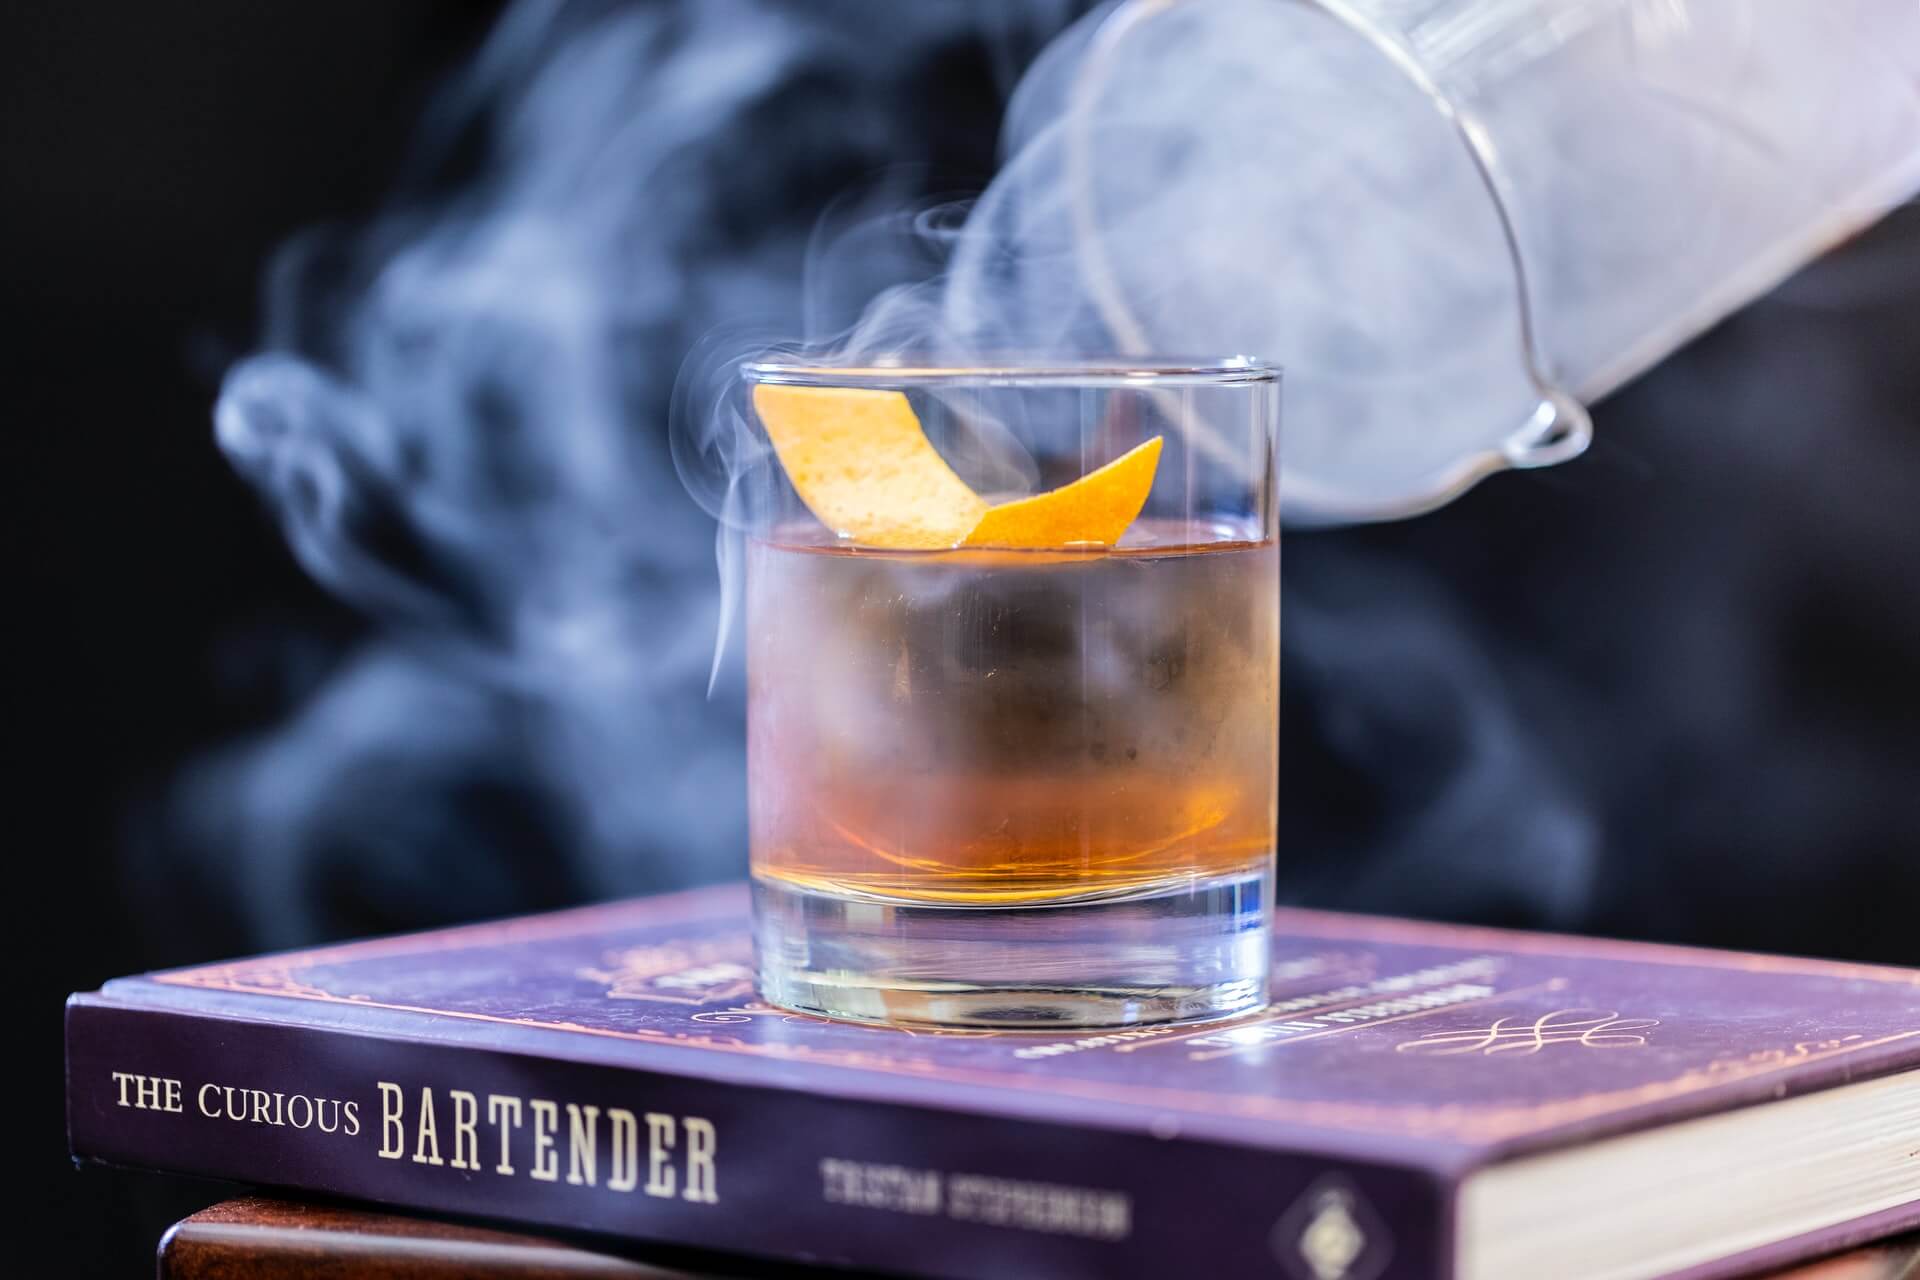
Old Fashioned
At this point, the Old Fashioned is ubiquitous to the point that it’s doubtful there’s even a neophyte bartender who can’t make at least a mediocre one. However, this drink doesn’t carry its “classic” designation for no reason. In fact, the simpler the drink, the more legendarily classic, the more crucial it is that your bar team can absolutely nail it.
Add a half-teaspoon of sugar, three dashes of Angostura Bitters, and one teaspoon of water to a rocks glass. Stir until the sugar is dissolved. Add a large ice cube or ice sphere, or a fill the glass with big ice cubes, and add two ounces of bourbon. Stir, express an orange peel around the rim of the glass, and drop it into the drink.
Bourbon Smash
Here’s an interesting bit of trivia: All Smash cocktails are Juleps but not all Juleps are Smashes, according to Imbibe Magazine. While difficult to define, Imbibe says crucial characteristics of a Smash are ice, fruit that’s in season, and a spirit base.
Prepare a rocks glass by chilling it with ice. Grab a cocktail shaker and toss in three lemon wedges. Muddle those, then add two ounces of bourbon, three-quarters of an ounce of simple syrup, three or four fresh mint leaves, and ice. Dump the ice from the rocks glass and add a large ice cube or sphere, or big ice cubes. Shake the shaker hard until chilled, double strain into the prepped rocks glass, and garnish with a mint sprig, a popular ingredient and garnish for Smashes.
Hey, speaking of that Mint Julep trivia we mentioned…
Mint Julep
The Mint Julep is the traditional drink of the Kentucky Derby, of course. In fact, it’s said that more than 10,000 bottles of Old Forester Mint Julep are poured during Kentucky Derby weekend. While those ready-to-serve bottles are convenient, we’re going to focus on a traditional cocktail build.
Now, you can build this drink in a rocks glass. But who wants to drink this in anything but a frosty, ice-cold Julep cup? So, you’re going to start by muddling three fresh mint leaves inside the Julep cup. Then, pack the cup with crushed ice. Add two ounces of bourbon, a half-ounce of simple syrup, and stir gently. Add more crushed ice and round it off above the rim. Dust with powdered sugar and garnish with a fresh mint leaf or two.
Kentucky Mule
While we’re building cocktails that call for specialty drinkware… After the Moscow Mule exploded in popularity across North America, variants began popping up all over the place. Agave-focused bars made tequila- and mezcal-based Mules. And, of course, whiskey-centric programs latched onto their own versions of the Mule.
Enter: The Kentucky Mule. The star of this cocktail is, obviously, bourbon. Pour two ounces of bourbon into a Moscow Mule mug or highball glass—honestly, this is a toss-up given the recent surge in popularity of highballs—along with a half-ounce of fresh-squeezed lime juice. Fill the mug or glass with ice, top with ginger beer, and garnish with a mint sprig.
Bourbon Sour
In the interest of transparency, this can also be called the Whiskey Sour. I just want to make it clear that this particular recipe calls for bourbon.
With that out of the way, add two ounces of bourbon, three-quarters of an ounce of fresh-squeezed lemon juice, and a half-ounce of simple syrup to a shaker. If egg white will be used to build your Bourbon Sour, add a half-ounce to the shaker. For the egg-white version, dry shake for 30 seconds, add ice, and shake again until chilled. Skip the dry shake if no egg whites are used—just add ice and shake until well chilled. Strain into a coupe and garnish with three to four drops of Angostura bitters.
Boulevardier
Some people malign the Boulevardier is just a Negroni that swaps out the gin for bourbon (or other types of whiskey). I personally disagree with that derisive assessment as bourbon imparts entirely different characteristics.
Regardless of where you stand, part of the magic of the Negroni is that it calls for equal parts—it’s a 1:1:1 cocktail. So, I encourage you to try making your Boulevardier the same way. (Note: Some people add a quarter-ounce more of bourbon to stand up to the Campari.) Prepare a rocks glass with ice and set aside. To a mixing glass, add ice and equal parts bourbon, Campari, and sweet vermouth. Again, toss the ice inside that’s inside the prepared rocks glass and add fresh ice. Stir the liquid in the mixing glass until well chilled, strain into the prepared rocks glass, and garnish with an orange peel or twist.
Billionaire
If you’ve been to Employees Only, you’ve likely tried the Billionaire or at least know about it. Per Liquor.com, the Billionaire is a “sophisticated” riff on the Millionaire cocktail. The EO variant eschews the Millionaire’s Grand Marnier, absinthe, egg white, and freshly grated nutmeg garnish.
Instead, the Billionaire is a simpler build that calls for a specific bourbon and absinthe bitters. First, prepare a stemmed cocktail glass with ice to chill it (or task bar team members with placing them in in the freezer or refrigerator as part of their duties) and set aside. Add two ounces of Baker’s Single Barrel bourbon (107 proof), an ounce of fresh-squeezed lemon juice, a half-ounce of grenadine, a half-ounce of simple syrup, a quarter-ounce of absinthe bitters, and ice to a cocktail shaker. Shake hard until well chilled and strain into the chilled cocktail glass. Float a lemon on wheel on top to garnish.
(Updated) Amaretto Sour
This recipe is Jeffrey Morgenthaler’s modern take on the classic Amaretto Sour. To make it, you’ll need to have at least one cask-strength bourbon in your inventory. Unlike the other cocktails on this list, bourbon isn’t the star of the show. That honor goes to amaretto liqueur, but the bourbon is one hell of a supporting actor.
Prepare a rocks glass by chilling it with ice. Start by adding one-and-a-half ounces of amaretto, three-quarters of an ounce of cask-strength bourbon (remember, cask strength!), an ounce of fresh-squeezed lemon juice, one teaspoon of rich simple syrup, and a half-ounce of egg white to a shaker. Dry shake for 15 seconds, then add ice to the shaker and shake again. Dump the ice from the prepared rocks glass, add fresh ice (large cube or sphere, big ice cubes, etc.), strain the liquid, and garnish with a lemon twist and two brandied cherries on a skewer.
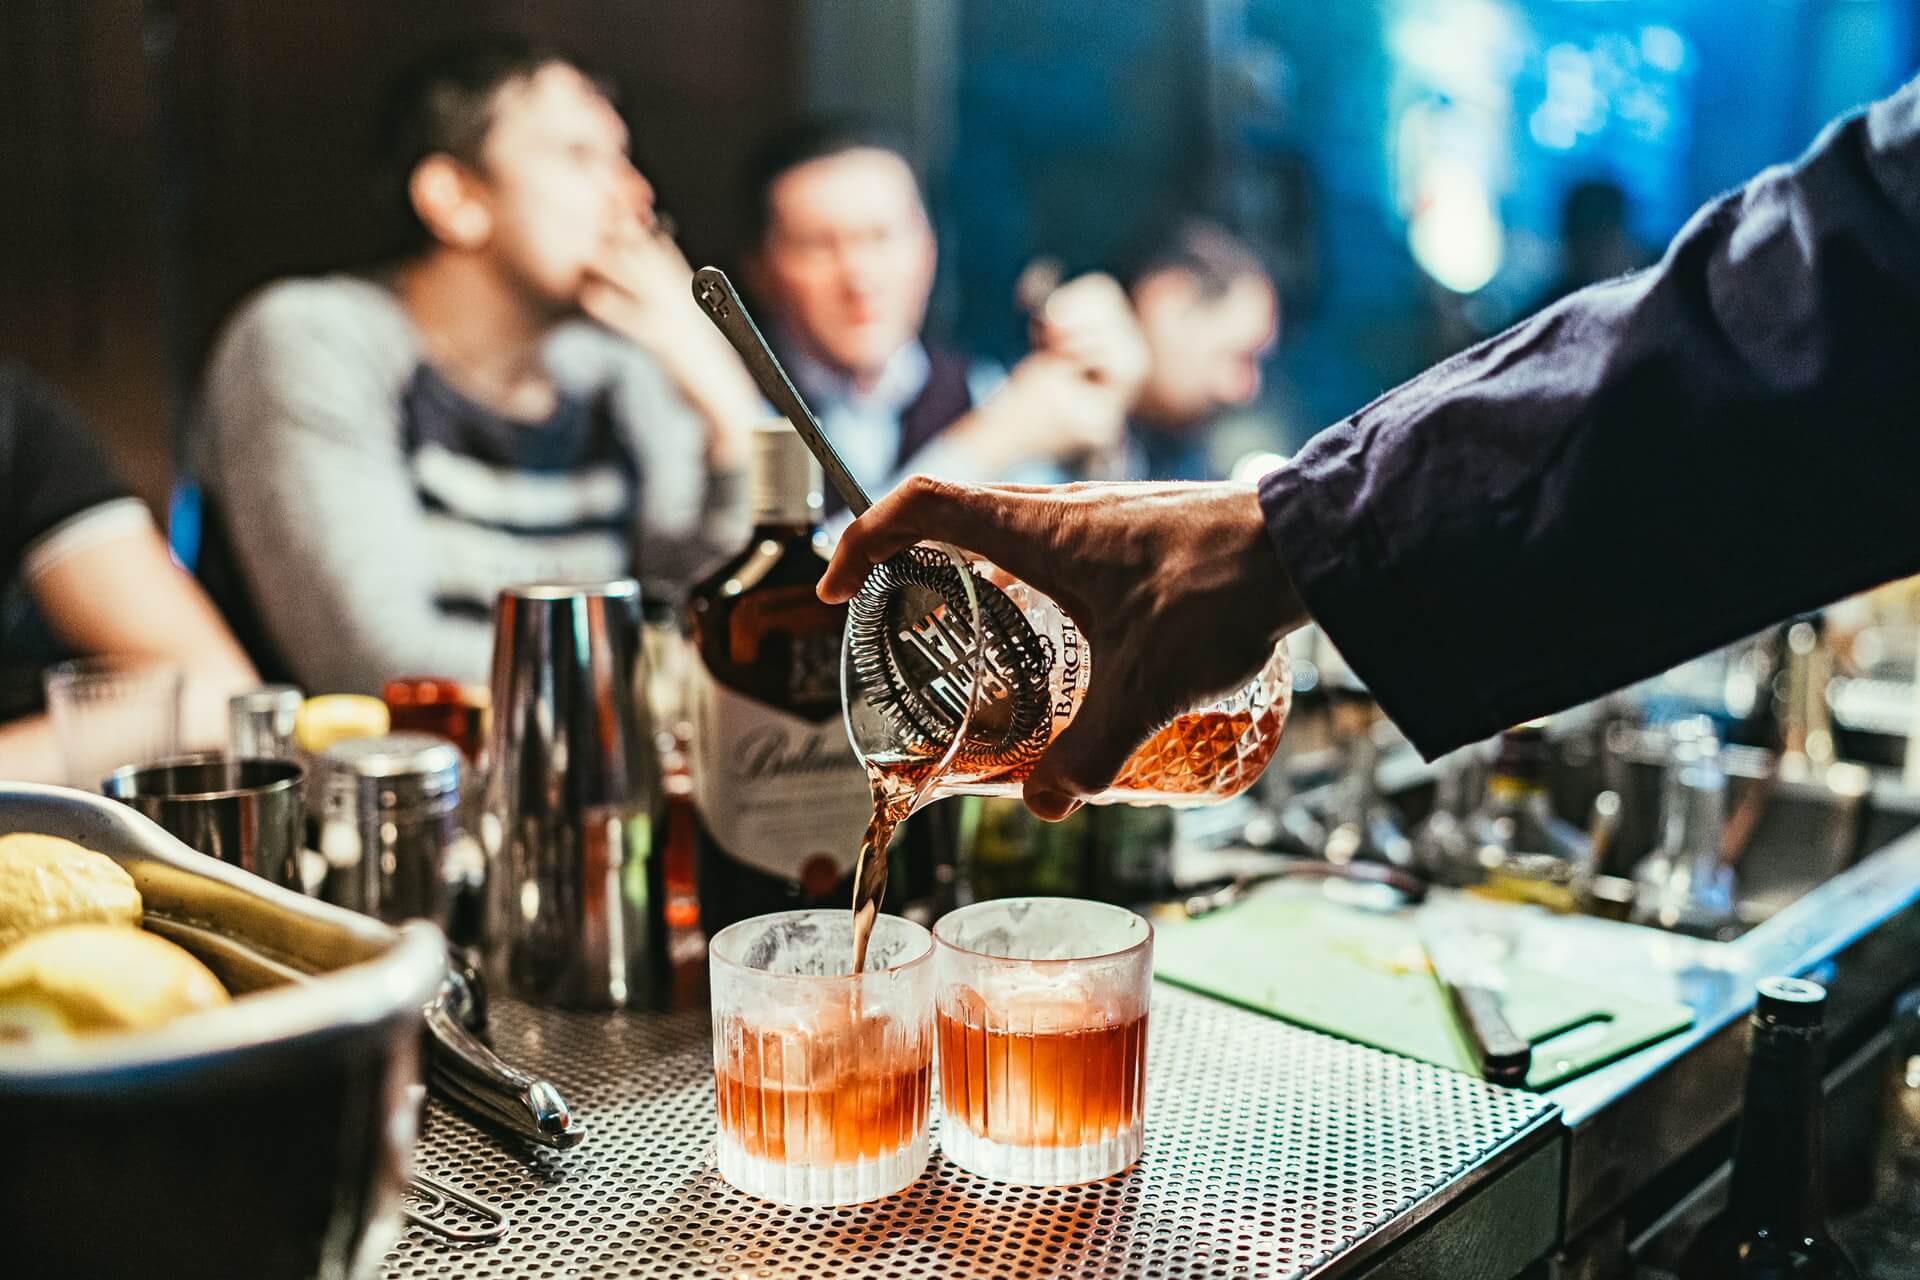
Image: Bon Vivant on Unsplash