There are 75,736 pizzerias operating in the United States right now. Together, they generate an estimated $49.6 billion in annual revenue despite a slight (0.3%) dip year over year, according to IBISWorld.
Meanwhile, 86 percent of Americans ate pizza or flatbreads in 2025, and 40 percent of Gen Z consumers are eating pizza at least once per week.
Demand isn’t the issue; competition is.
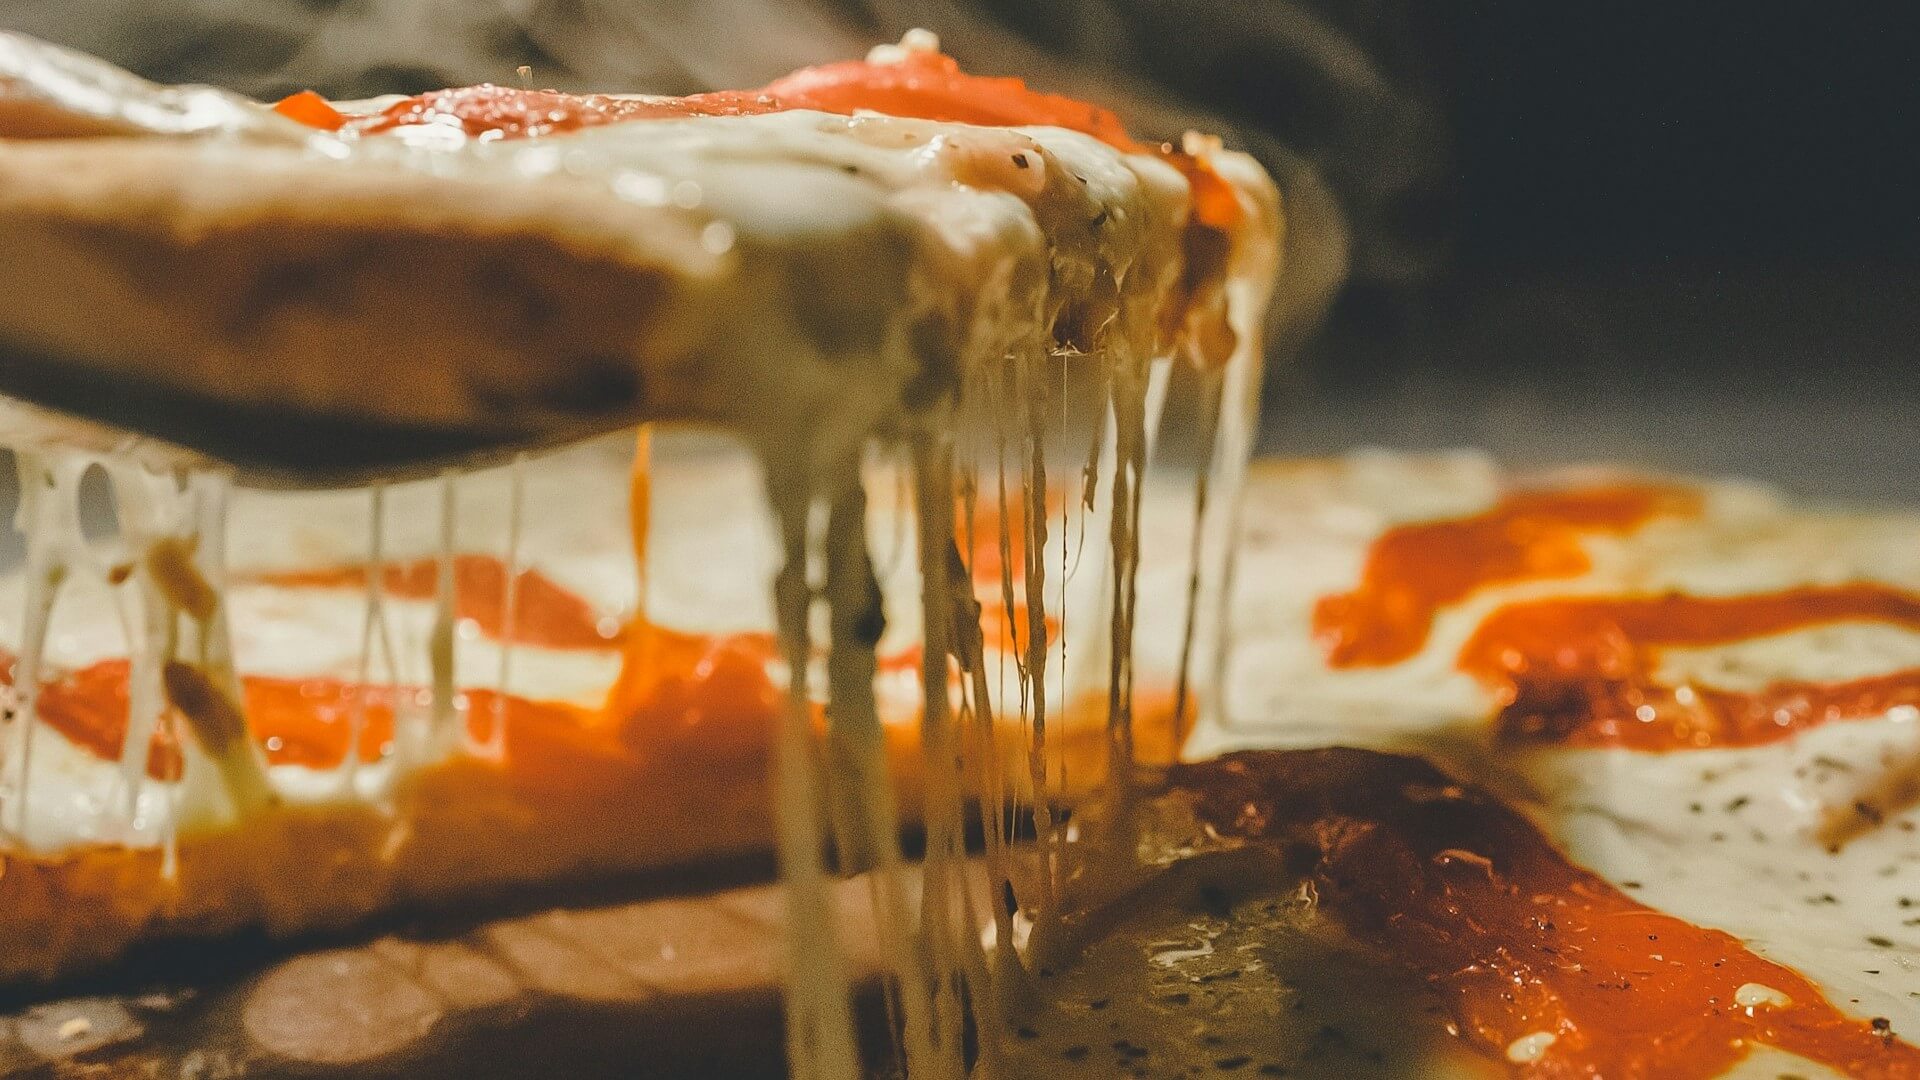
Pizza is one of the most democratic menu items in hospitality. It works in a 20-seat neighborhood bar, a 200-seat restaurant, a food hall, a hotel lobby, a stadium concourse, or a multi-unit chain spanning multiple states… Pizza even works via automated vending machines.
It thrives at lunch, during a beer-and-shot-soaked visit to a dive bar, and over late-night cocktails. That said, ubiquity is a double-edged sword.
When nearly everyone sells pizza, differentiation—not dough—becomes the battleground.
Reports from Pizza Today, PMQ Pizza, IBISWorld, and Datassential show competition shifting beyond style and price toward positioning, operational precision, retention, and tech fluency.
Detroit and tavern-cut are surging, hot honey and Calabrian chiles are climbing. Anchovies and sun-dried tomatoes may be sliding. The average large cheese pizza now sits at $16.92 nationally, with some regions pushing past $20.
Data alone doesn’t answer the structural question: How do you turn pizza’s mass appeal into brand gravity? The real structural question is: How do you turn pizza’s mass appeal into brand gravity?
Going further: How do you convert one-time traffic into repeat behavior after investing to acquire it? And how do independents win when chains can often absorb margin pressure more easily?
Let’s break down what the 2026 pizza data actually means for independent operators.
by David Klemt
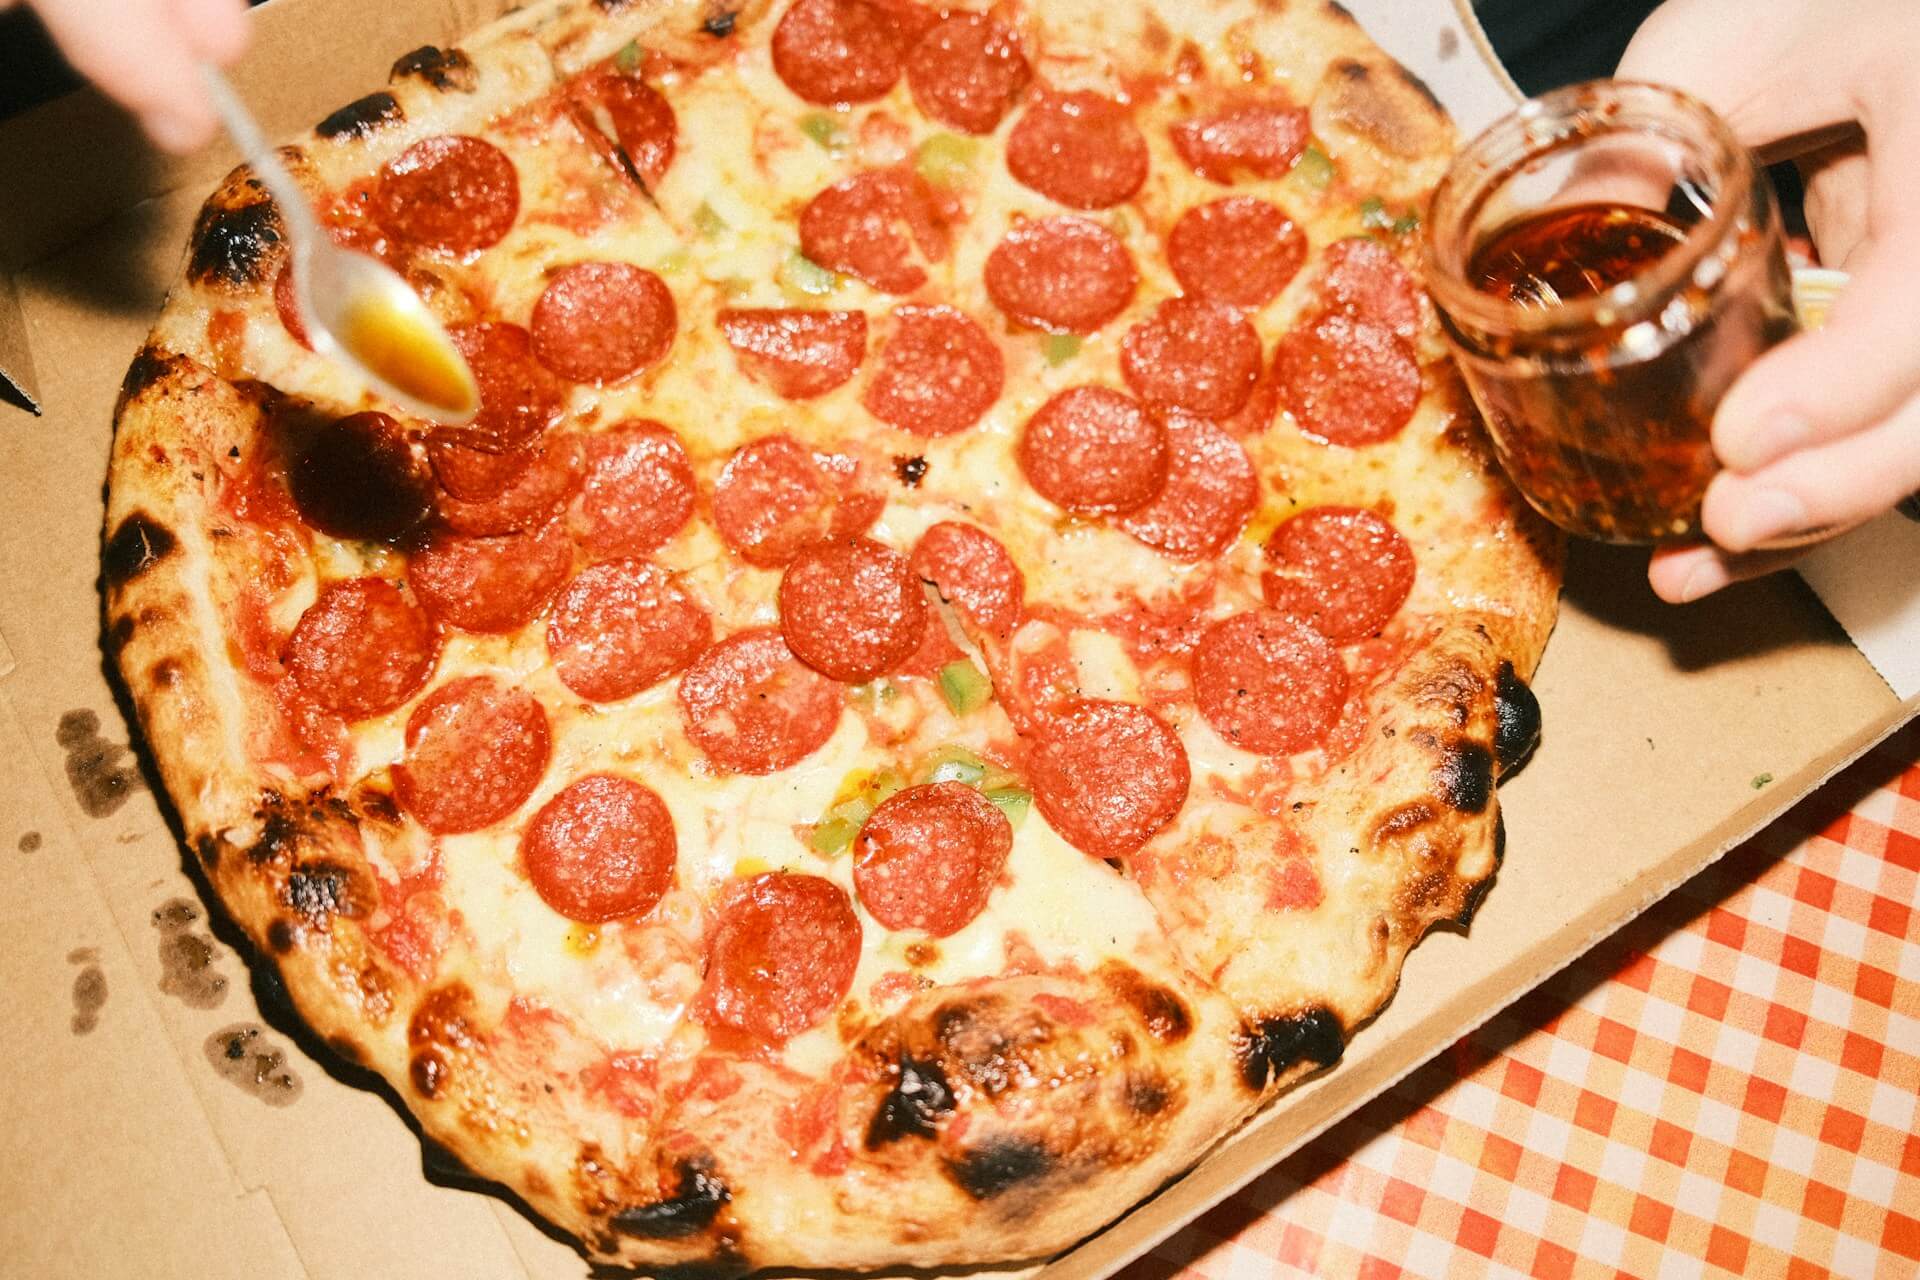
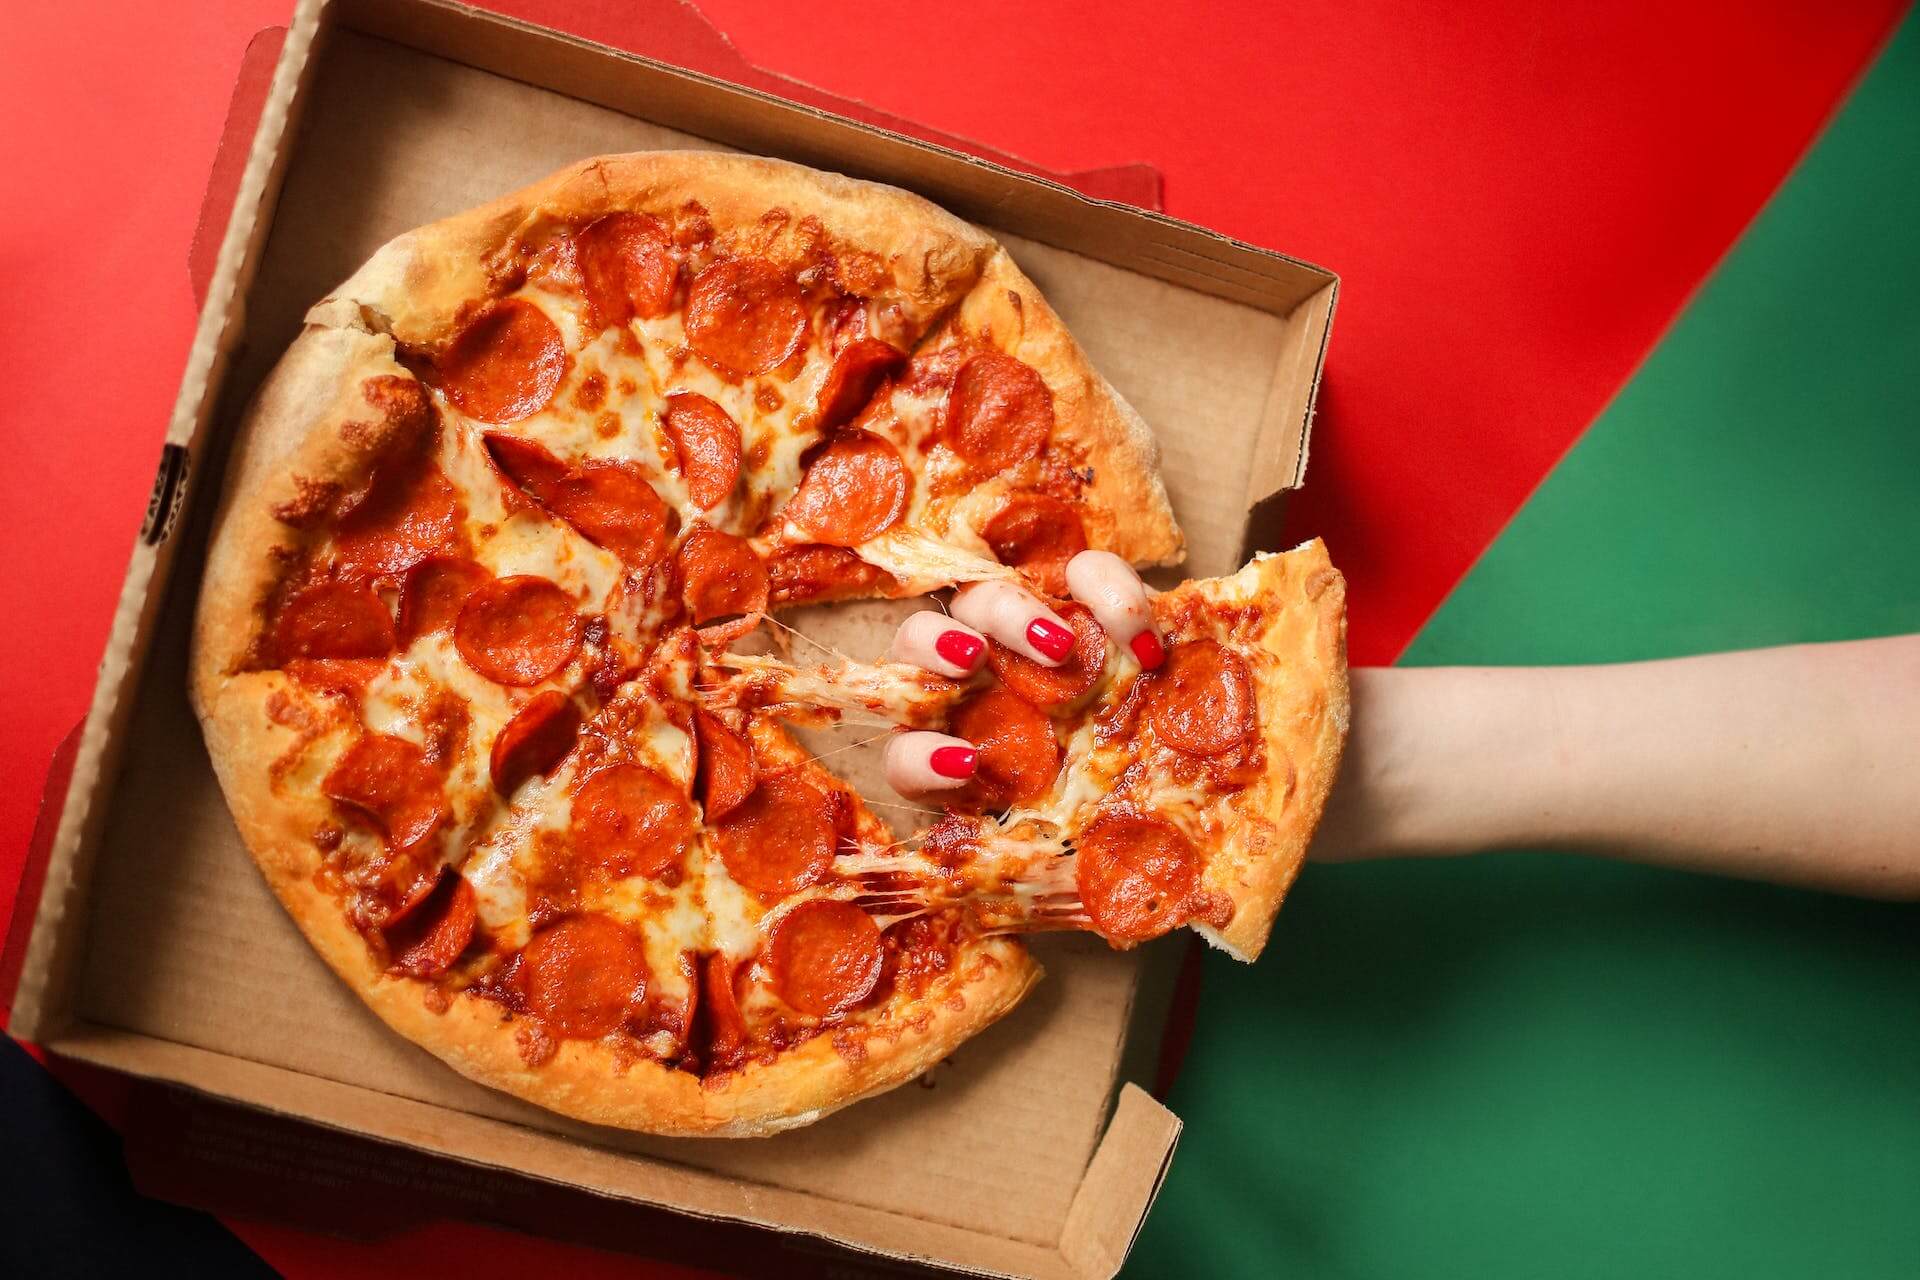
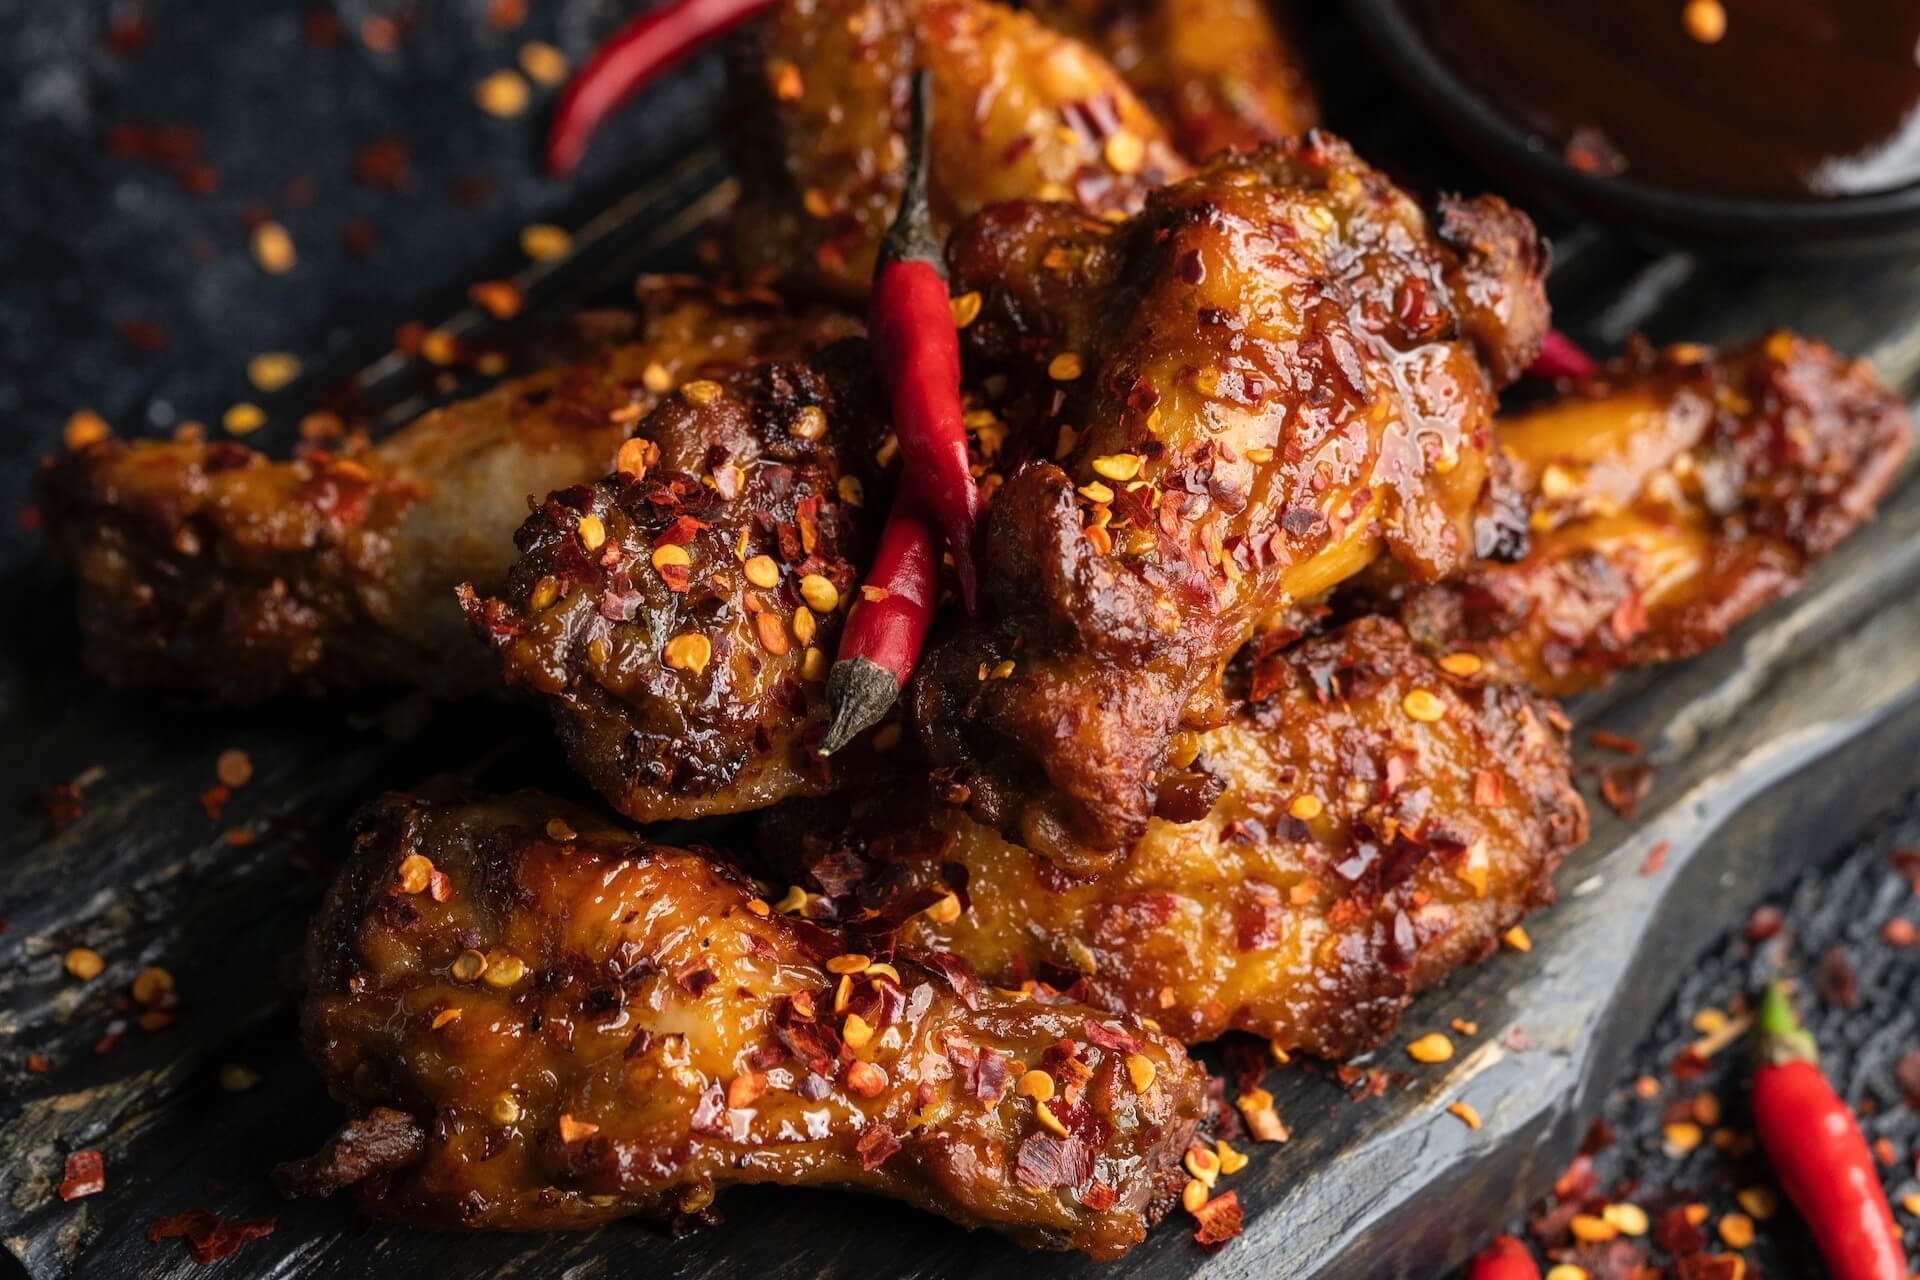
Pepperoni and hot honey are hot ingredients heading into 2026.
Top Pizza Styles in the US
Pizza Today
- New York
- Traditional American
- Chicago Thin (including Tavern)
- Detroit
- Neapolitan/Neopolitan
- Sicilian
- Deep Dish
- Grandma
- California/American Artisan
- Roman
Hot Pizza Styles in the US for 2026
Pizza Today
- Detroit
- New York
- Chicago Thin (including Tavern)
- Deep Dish
- Sicilian
Datassential
- Chicago Tavern-Cut
- Detroit
- Brick Oven
- Chickpea Pizza Crust
- Flatbread Pizza
- Neapolitan
- New York
Top Pizza Ingredients
Pizza Today
- Pepperoni
- Sausage
- Mushroom
- Bacon
- Onion
- Extra cheese
- Chicken
- Black olives
- Canadian bacon
- Jalapenos
- Ham
- Red/Green pepper
- Meatballs
- Pineapple
- Basil
- Beef
- Fresh garlic
- Banana peppers
- Spinach
- Artichoke
Datassential
- Plant-based pepperoni
- Pepperoni
- Mozzarella
- Tomato
- Mushroom
- Sausage
- Chicken
- Peppers
- Bacon
- Garlic
Hot Pizza Ingredients on the Rise in 2026
Pizza Today
- Brisket
- Calabrian chili pepper
- Chorizo
- Figs
- Nduja
- Pistachios
- Ricotta
Datassential
- Plant-based pepperoni
- Hot honey
- Pepperoni cups
- Paneer
- Dill pickle
- Honey
- Calabrian chili pepper
- Barbecue pork
- Mint
- Cotija
Ingredients on the Decline in 2026
According to Pizza Today, most pizzeria operators (at least among those they surveyed) aren’t planning on pulling any ingredients from their menus.
Some respondents are indeed planning to ditch a number of toppings this year:
- anchovies
- artichokes
- shrimp
- sun-dried tomatoes
It’s likely these eliminations are due to price increases.
Pricing Across the US
PMQ Pizza analyzed pizza trends and data, including pricing.
They engaged Slice, the app that for several years released their own Slice of the Union report, for several data points. I used to look forward to this study each year, but Slice appears to have stopped releasing their report after 2024.
One of the bits of info PMQ asked Slice to provide is the average price for a large cheese pizza. On average, a large cheese pizza costs $16.92 in the States. That said, pricing can be region-specific.
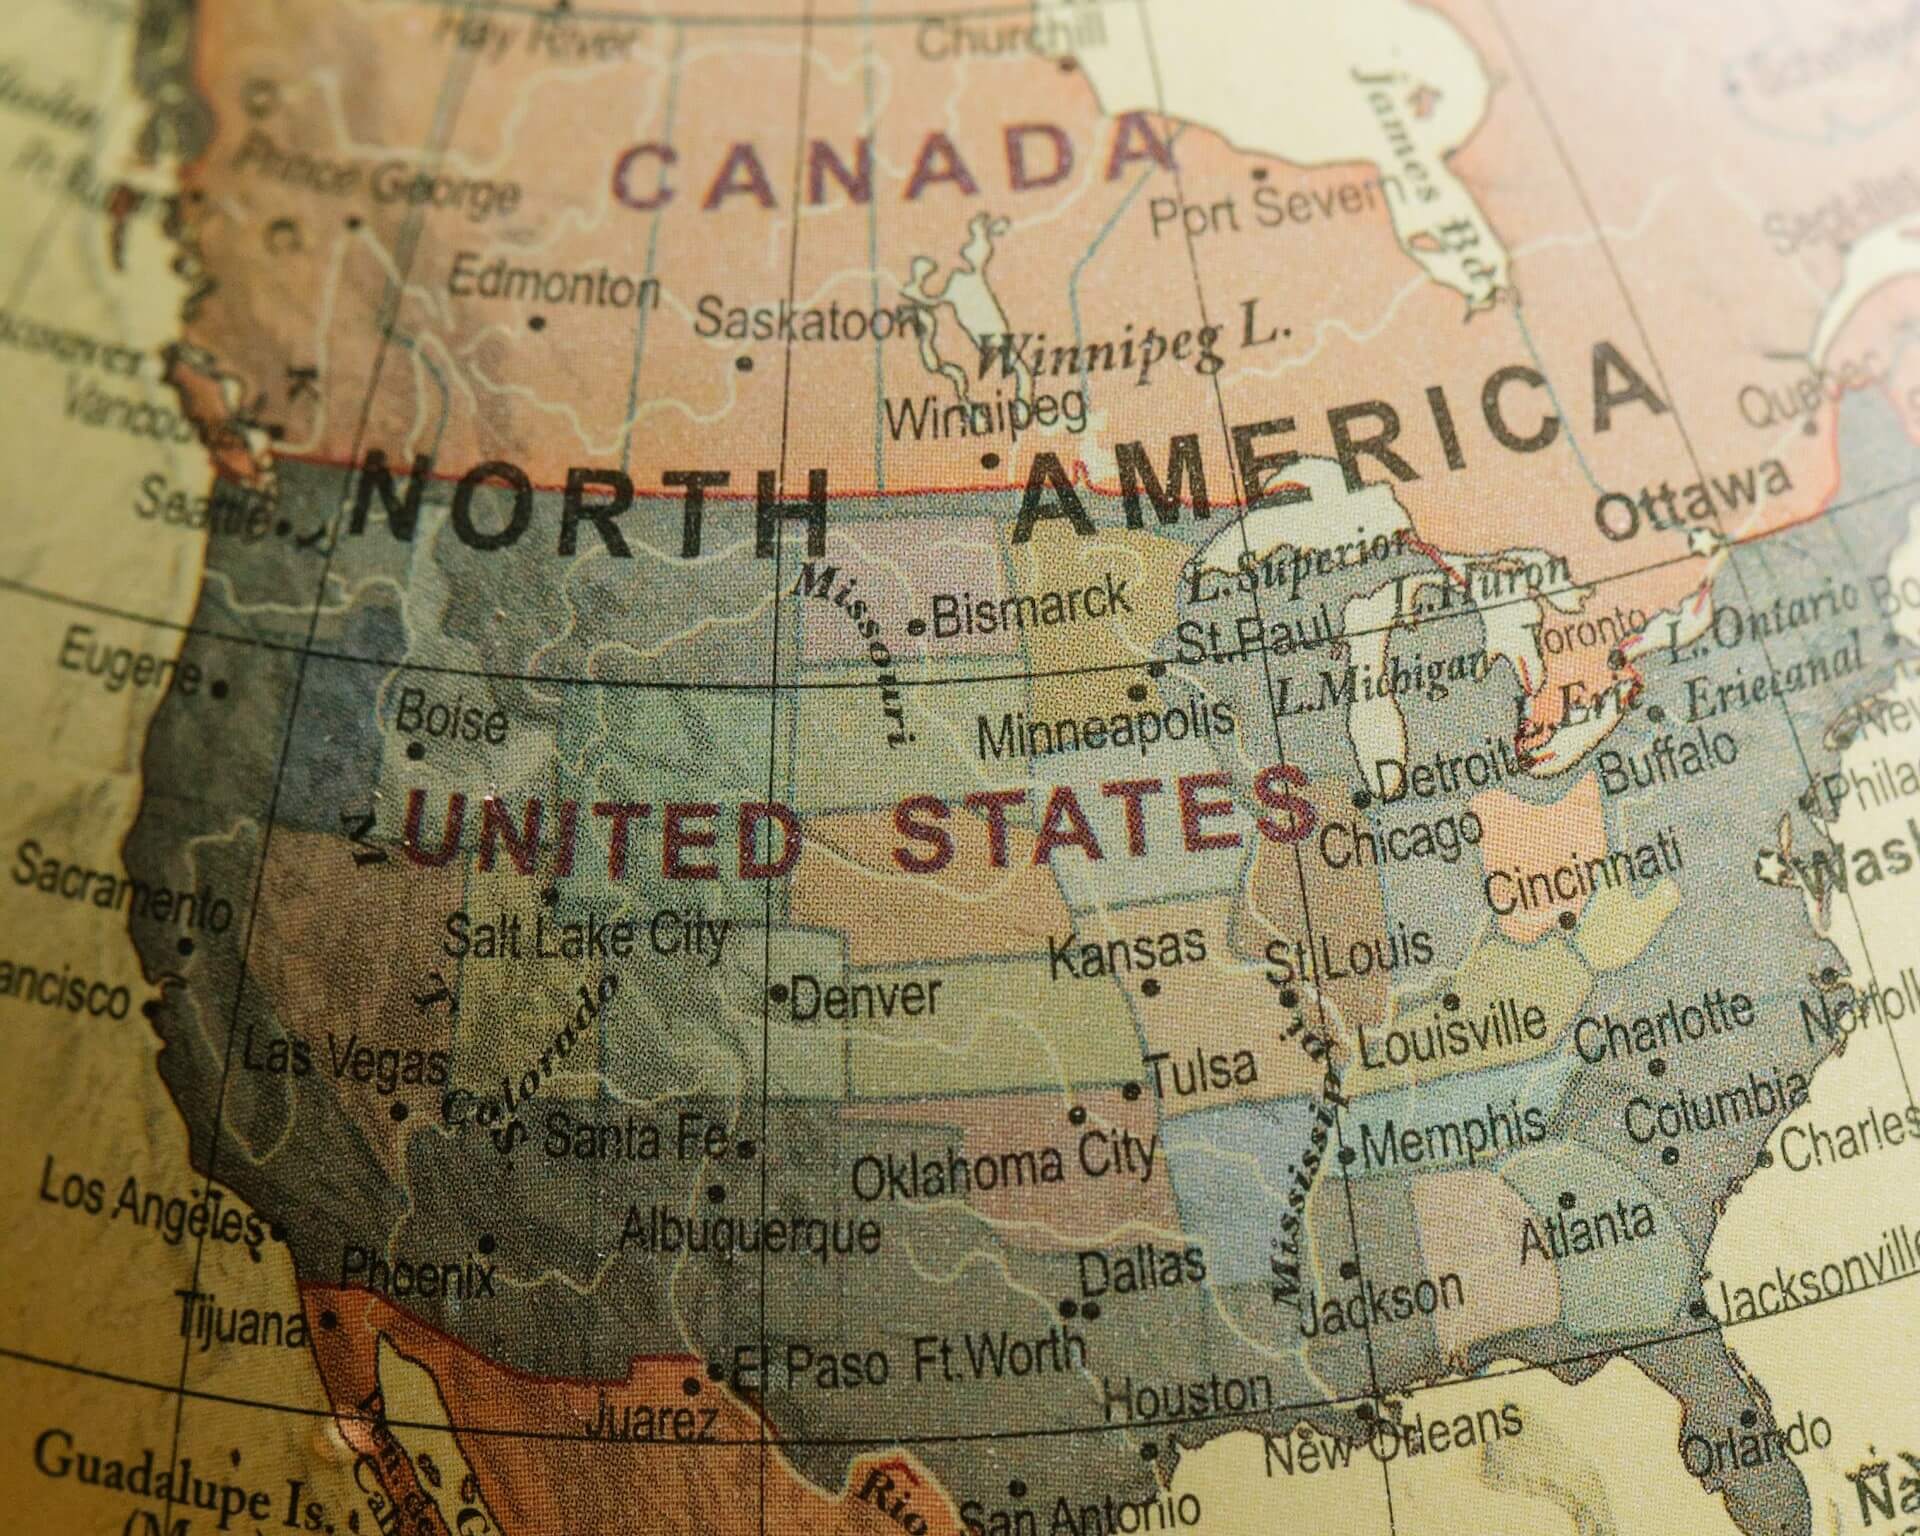
In New England and on the East Coast, a large cheese pizza is under the national average, ringing in at $16.71 and $16.82, respectively.
Moving to the Central US, that price climbs to $17.10. A large cheese pizza, on average, costs $20.17 on the West Coast.
How to Win with Pizza in 2026
It’ll take more than keeping up with pizza style and topping trends to with pizza.
This is particularly true for independents going up against regional, national, and global chains. Chains can often weather rising costs more easily than independents.
Get Personal & Meaty
You likely already have a lunch-daypart-focused menu. It’s possible you’ve even dialed your operation into the snack space, a growing and important revenue driver.
If so, you’re already offering pizza by the slice or personal pizzas. That means you’re well positioned to succeed by tempting proteinmaxxers, diet-conscious guests, and guests on GLP-1 weight loss drugs.
Another way to leverage the trend toward boosted protein consumption is to promote your meat-lover’s pizza.
Cool It
Frozen pizza from independents isn’t exploding, but it is growing. PMQ Pizza has taken note of a handful of indie pizza operations that have managed to take their pizzas nationwide via frozen (and refrigerated) pies.
Indies interested in doing the same can reach out to local retailers, a suggestion made by PMQ Pizza. If doing so proves successful, scale from local stores.
Focus Your Marketing
Pizza Today addresses effective and ineffective marketing techniques in their 2026 Pizzeria Industry Trends Report.
Split into two categories, marketing strategies with less to no effectiveness and strategies with moderate to high effectiveness, the pizza publication helps operators focus their time and resources.
For example, it may be time to consider ditching:
- flyers
- direct mail
- search ads
- door hangers
- billboards
- public relations or press releases
- geofencing
- radio ads
- TV ads
- magazine ads
- newspaper ads
Some of the above are more costly than others. If you’re using any of these without seeing ROI, redirect time and money toward higher-performing channels.
Pizza Today identifies social media advertising, word of mouth, loyalty programs, community/sporting events, email, text, video marketing, in-store advertising, and social media influencer campaigns as marketing approaches with moderate to high effectiveness.
Lasering in on loyalty programs, both the Pizza Today and PMQ Pizza reports encourage the development and implementation of this marketing tool. As any operator knows (or learns quickly), guest retention is much less expensive than guest acquisition.
So, focus on transforming first-time guests into valuable repeat guests. Build out a loyalty program, ensure you have a website and that it’s easy to find and use (fast, stable, intuitive, easy to customize orders, etc.), and try to convert most of your traffic into online orders. Free up your phone lines and you’ll likely find you’re capturing more orders and decreasing labor costs, keeping your teams working on more lucrative elements of the operation.
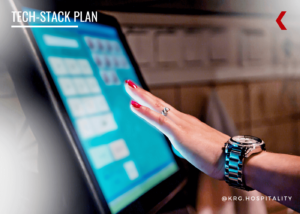
Tighten Your Tech Stack
PMQ Pizza’s 2026 Pizza Power Report includes a checklist on its last page. Using it, you’ll be able to easily identify where your tech stack is strong, where there are gaps, and what to focus on to truly dial it in.
Does every other tool or platform in your stack integrate into your POS? Do you own your online ordering and delivery functions, or are you still using Uber Eats and DoorDash (and losing money, data, and control)?
Is your stack collecting, parsing, and giving you deep, data-rich insights? If so, do you know how to find relevant data, generate useful reports, and track your inventory, other costs, analytics, KPIs, etc.?
And, bringing up everyone’s favorite two letters, are you implementing AI? I’m not asking you to replace humans—that remains a red line for me. Instead, I’m asking you to consider where AI can safely and responsibly streamline your operations, ensure you’re not missing orders, and help control your costs.
Hospitality-focused AI tools can monitor your inventory and automatically place or adjust orders, make staffing more efficient and less costly, and help you implement, optimize, and automate your marketing efforts.
This checklist alone is worth downloading PMQ Pizza’s 2026 report. In fact, I encourage operators to download and review each report directly:
- Pizza Today: 2026 Pizzeria Industry Trends Report
- PMQ Pizza: Pizza Power Report 2026
Related Reading
- WalletHub Ranks the Best Foodie Cities in the US for 2026
- Top Pizza Styles & Toppings by Region in the USA
- Pizza Today’s 2024 Report Reveals Most Popular Cheeses
Image: Jay Wennington via Unsplash
Work with Us
Click the image below to learn how we can help you start, stabilize, or scale your pizzeria, restaurant, or bar. Cheers!