2023 State of the Menu: Datassential
by David Klemt
The annual 2023 State of the Menu by Datassential includes an interesting metric to gauge restaurant recovery: menu size by segment.
Hosts Jack Li, Mike Kostyo, and Claire Conaghan discuss a handful of topics during this webinar. Host Li touches on food-forward cities at the beginning of this presentaiton. Kostyo shares some of the most innovative menu items out there right now. And Conaghan dives deep into menu trends.
Industry professionals interested in watching this webinar on demand can register to do so here.
There are a handful of metrics people are using to measure post-pandemic restaurant recovery. Labor is, of course, receiving a lot of attention. People are also tracking traffic, average check size, revenue, and profits.
One metric Datassential is keeping tabs on is menu size per restaurant segment. Additionally, they’re tracking each segment’s top-growing food and beverage items.
Notably, however, in tracking menu size, Conaghan focuses solely on food and non-alcohol beverage items, omitting catering and alcohol.
Chains vs. Independents
Starting things off, Conaghan addresses the overall menu size trend. That is, menus are noticeably smaller in comparison to pre-pandemic sizes.
Interestingly, chain restaurants don’t appear to be in any rush to move away from this trend. In fact, Conaghan notes that chains appear to be further reducing the size of their menus. This has been the trend over the past 12 months.
According to Conaghan, fine dining also seems to be happy to shrink their menus. Menu size shrunk the most among restaurants in this segment. In comparison, quick-service menu sizes decreased the least.
However, independent restaurant operators appear to be going in the opposite direction from their chain counterparts. In contrast, indies have been growing the size of their menus the past 12 months.
Menu Size by Segment
Fast Casual
Per Conaghan, the only segment to reach pre-pandemic menu size is fast casual. In fact, this category of restaurant is often exceeding pre-pandemic items-per-menu size.
This increase in menu size is attributable to operators “leaning into” core cuisine items. For example, sandwiches, Mexican entrees, and pizza.
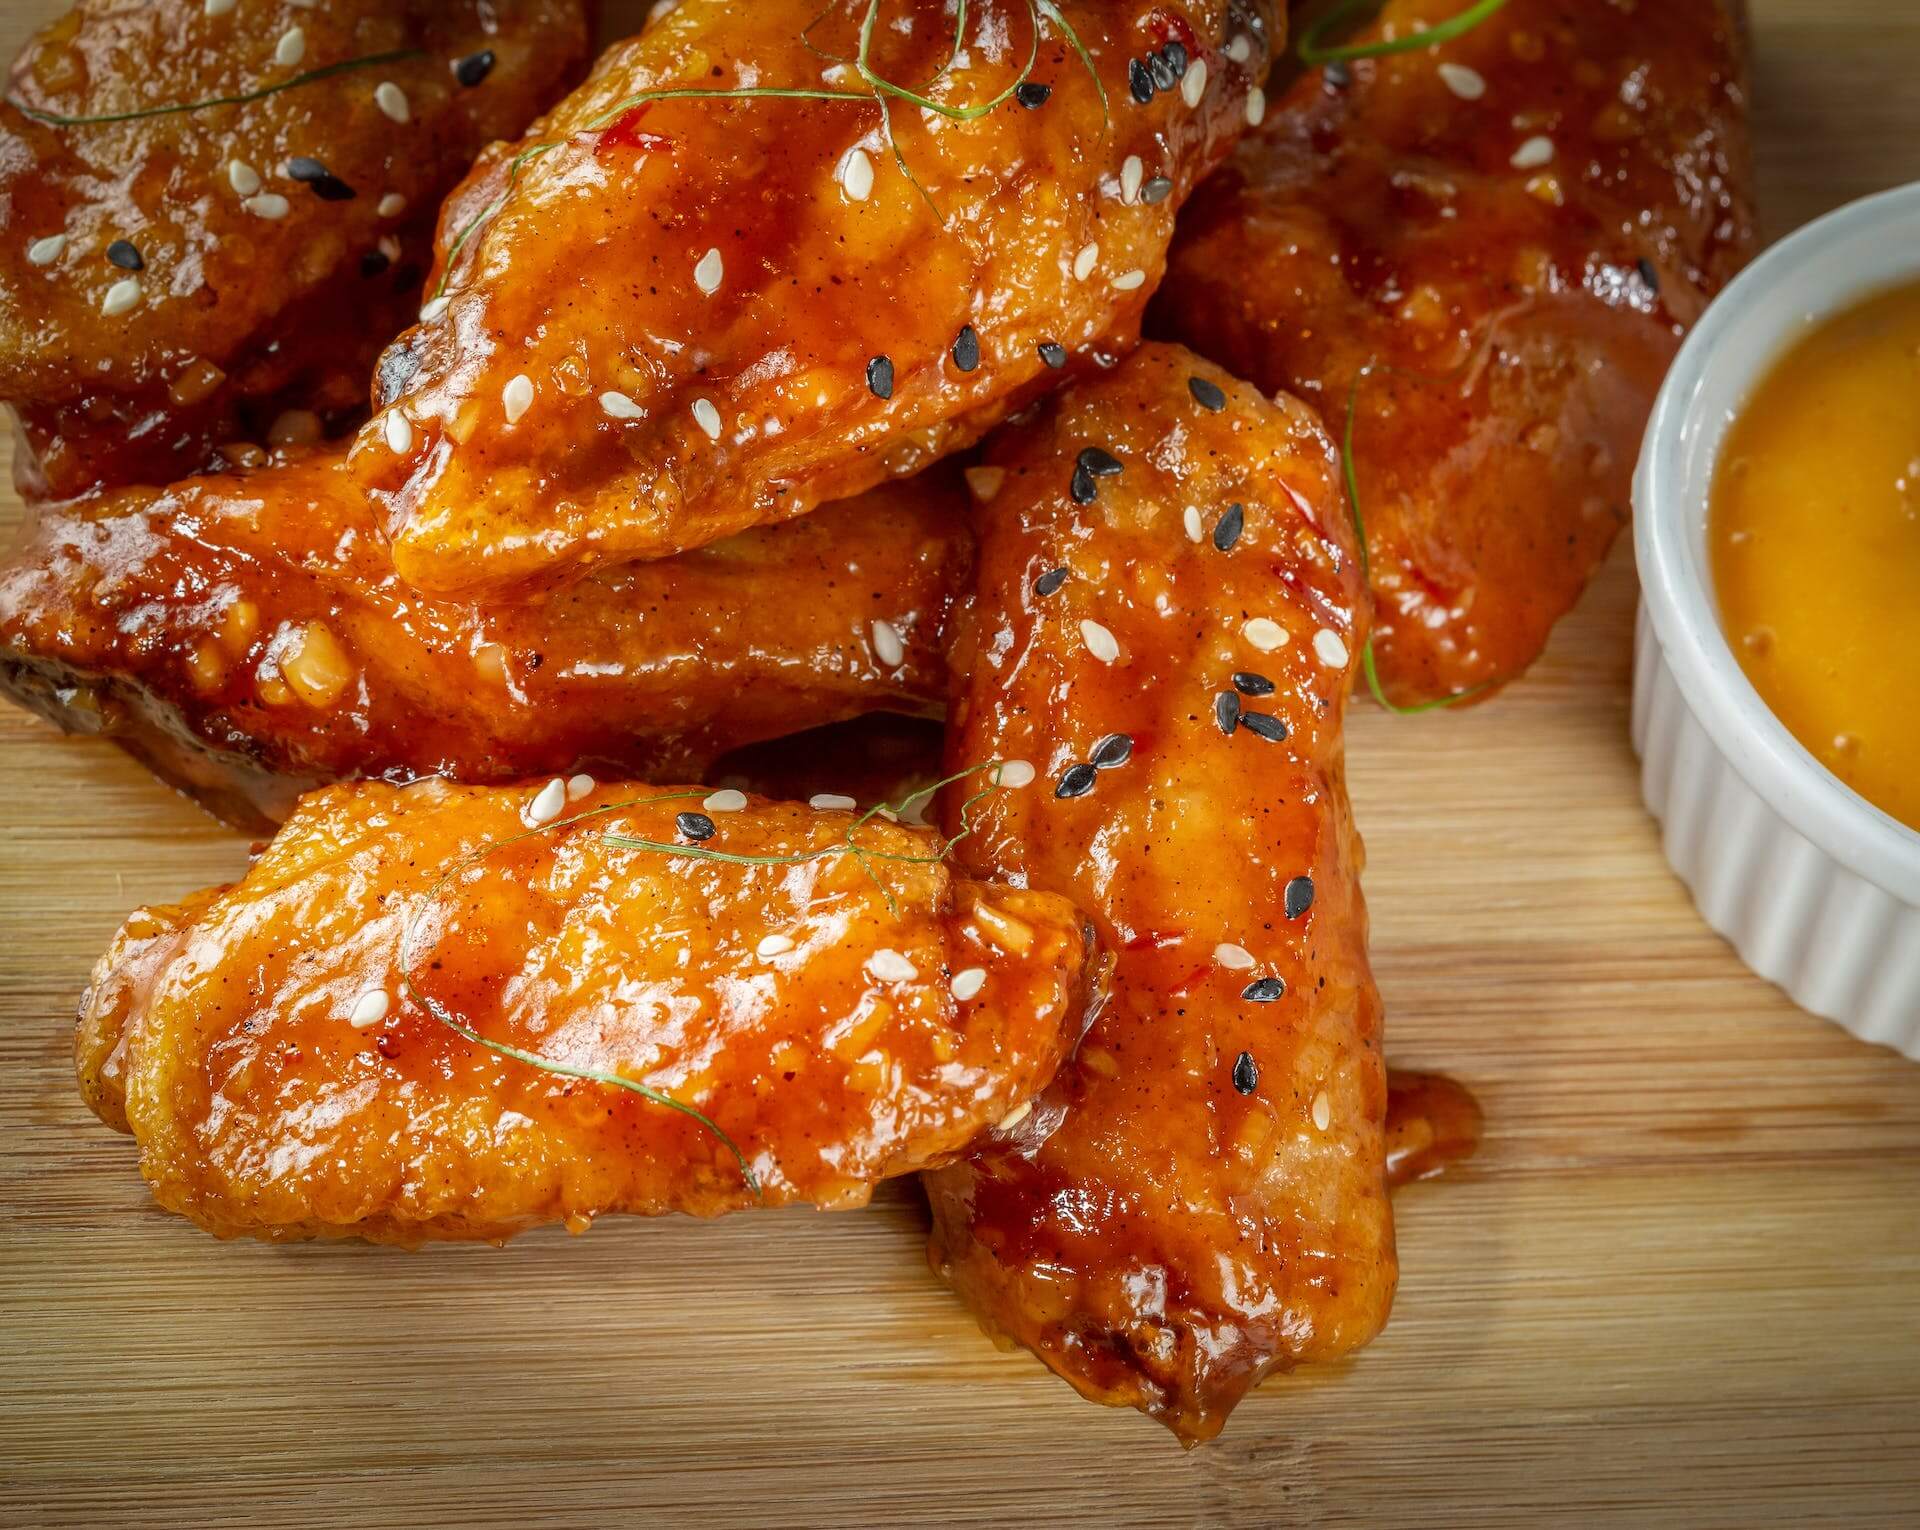
However, the fastest-growing food item on fast-casual menus is the chicken wing. According to Conaghan, it’s easy for operators to innovate with chicken wings.
A restaurant doesn’t have chicken wings? All they have to do is add them, starting with simple preparations. If a restaurant does have chicken wings on the menu already, innovation is as simple as adding new flavors.
As far as the fastest-growing drink for fast-casual restaurants, it’s dessert beverages.
QSR, Casual Dining, and Midscale
These three segments are “very, very close” to reaching pre-pandemic menu sizes.
As midscale operators are likely very aware, this segment tends to have the largest menus. I wouldn’t be surprised, therefore, if a number of midscale concepts review their items per menu, their costs, and decide they can perform well with slightly smaller menus moving forward.
Unsurprisingly, chicken wings are the food item growing most quickly on QSR food menus. Oh, and barbecue chicken wings are the fastest-growing food item among casual dining restaurants.
Perhaps a bit more eyebrow-raising is the fastest-growing beverage type for QSRs: energy drinks. Boba and flavored iced teas are growing fastest on casual-dining drink menus.
For midscale restaurants, dessert samplers are the fastest-growing food items. Think “dessert charcuterie” when trying to picture a dessert platter. Another way to think about the dessert sampler is a static dessert cart with small bites of each dessert on the menu.
Fine Dining
Again, this segment is the furthest from pre-pandemic menu size. And, again, operators in this category seem happy with this trend.
An interesting note Conaghan makes about this segment is what many operators are using to fill out their menus: desserts. This is, she says, an area where fine dining can differentiate itself from other concepts.
Per Conaghan, bao, applesauce, and summer squash are growing the fastest on fine-dining food menus.
Now, I may have slipped into a fever dream during this portion of the Datassential webinar. Because unless I’m mistaken, the Shirley Temple has been identified as the fastest-growing beverage in the fine-dining space.
Pricing
Okay, so this segment of the 2023 State of the Menu webinar isn’t really a recovery metric.
However, it’s interesting, and something Jack Li says about chain restaurant pricing made me chuckle.
Most Expensive vs. Least Expensive
First, some straightforward data.
The following list identifies the five most-expensive ZIP codes for chain restaurant menu pricing. Anyone who wants the full list of 15 most-expensive ZIP codes can watch the webinar.
- 10036 (New York, NY)
- 96707 (Kapolei, HI)
- 98902 (Yakima, WA)
- 96815 (Honolulu, HI)
- 99503 (Anchorage, AK)
It’s understandable to think this would consist entirely of New York City, Los Angeles, or San Francisco ZIPs. But when we consider what it costs operators to import food to Hawaii and Alaska. Additionally, Washington and New York are among the states with the highest minimum wage. Operators need to recover those costs somehow.
And now the five least-expensive ZIP codes:
- 78526 (Brownsville, TX)
- 75224 (Dallas, TX)
- 76106 (Fort Worth, TX)
- 31907 (Columbus, GA)
- 31701 (Albany, GA)
Pricing Logic
Now, on to what Li says during the webinar that makes me laugh.
Nationwide, the average price of a McDonald’s Big Mac in the US is $5.26. (A caveat: This webinar took place in October. This price may have increased or decreased by now.)
However, the lowest price for a Big Mac is $3.49 at a location in Wilburton, Oklahoma.
So, what’s the highest price, and where can one find these pricey Big Macs? Three McDonald’s locations sell the burger for $8.29. That’s nearly two-and-a-half times the lowest-priced Big Mac.
Summarizing pricing variations among chain restaurants succinctly, Li made me laugh with the following: “Store pricing often just doesn’t make sense.”
Going further, Li says Datassential shows that the more franchised a restaurant chain is, the more variances in pricing will occur.
The full webinar can be viewed here.
Image: Leonardo Luz on Pexels