Notice: Function _load_textdomain_just_in_time was called incorrectly. Translation loading for the smart-post-show-pro domain was triggered too early. This is usually an indicator for some code in the plugin or theme running too early. Translations should be loaded at the init action or later. Please see Debugging in WordPress for more information. (This message was added in version 6.7.0.) in /var/www/wp-includes/functions.php on line 6114
Open a bar | KRG Hospitality - Part 2

Open a bar

by David Klemt David Klemt No Comments

The Major Milestones You Must Reach

The Major Milestones You Must Reach to Open a Restaurant

by David Klemt

2023 KRG Hospitality Milestone Checklist

Opening a restaurant is no small task, with projects requiring the completion of 500 unique tasks before welcoming guests.

KRG Hospitality president Doug Radkey identified these tasks several years ago. The commitment to systematically accomplish these tasks is a cornerstone of our approach to all projects.

Our feasibility studies, branding, concept and brand development, and programming are unique and customized to every client. However, the journey from idea to grand opening is a path dotted by hundreds of waypoints.

There’s a reason we call our project plans Roadmaps to Success: we’re here to help guide our clients to and through each waypoint on the map.

Below you’ll find just 50—just a tenth—of the unique tasks we at KRG believe you must complete before your grand opening. You’ll find more than 80 tasks in the brand-new 2023 KRG Hospitality Restaurant Start-up Cost Report + Checklist.

Both the list below and the checklist included in our free Restaurant Start-up Cost Report download will give you an idea of what we work on with each of our clients. These tasks should also highlight the enormity that is taking your concept from idea to brick and mortar.

To download your free copy of our 2023 Restaurant Start-up Cost Report + Checklist, click here.

Planning & Admin Tasks

  • Complete your project feasibility study.
  • Develop your concept and brand plan.
  • Develop and test a layout/drawing.
  • Complete a strategic business plan.
  • Complete a marketing and tech stack plan.
  • Finalize your start-up budget.
  • Analyze and secure necessary funding.

The Support Team Tasks

You’ll need to secure:

  • Business insurance broker
  • Business and liquor license attorney
  • Restaurant and bar consultant
  • Project manager
  • General contractor and trades
  • Mentor or coach

Site Development Tasks

When it comes to these tasks, you may have an idea of roughly what to expect.

For example, one necessary task is…securing your property of choice. Another task to cross off or set a check next to? Signing the lease.

But there are other tasks you may not anticipate or think of when planning to open a restaurant:

  • Submit drawings to municipality.
  • Start and manage project renovations.
  • Set a SMART opening date proposal.
  • Set up and submit deposits for utilities.
  • Develop your service sequence (flow).

You’ll also need to source the following:

  • Exhaust hood supplier
  • Millworker and specialty supplier
  • Interior and exterior signage company
  • Grease trap cleaning
  • Used oil pickup/recycling
  • Exhaust hood cleaning

Operations Development Tasks

  • Complete a kitchen workflow plan.
  • Complete service sequence analysis.
  • Source take-out container suppliers.
  • Secure security, sound, and video, plus applicable licenses.
  • Secure point-of-sale and tech Systems.
  • Develop recipe books for kitchen and bar.
  • Develop package of standard operating procedures.

Brand Development Tasks

Developing your brand involves much more than choosing a logo and colors.

Consider every design and service element a branding opportunity. Your brand development tasks will include developing:

  • your core statements;
  • graphic design/branding kit;
  • website and social media accounts;
  • a promo video strategy;
  • a “coming/opening soon” plan; and
  • your media strategy for the launch.

You’ll also need to:

  • complete the F&B concept stage;
  • complete the F&B testing stage;
  • source menu cover supplier (for dine-in version)
  • complete a photo shoot; and
  • plan for and execute a soft opening.

Team Development Tasks

  • Develop your staff hiring strategy.
  • Plan for and complete HR and compliance forms.
  • Develop onboarding manuals.
  • Source staff uniform suppliers.
  • Promote job fair or interview dates.
  • Hold a staff orientation night.
  • Execute a staff-building exercise shift.
  • Create a brand ambassador program.

Image: KRG Hospitality

by krghospitality krghospitality No Comments

KRG Unveils 2023 Start-Up Guide

KRG Hospitality Unveils 2023 Restaurant Start-Up Cost Report + Checklist

2023 KRG Hospitality Start-up Costs Guide

KRG HOSPITALITY RELEASES FIFTH ANNUAL RESTAURANT START-UP COST REPORT + CHECKLIST

Toronto-based hospitality industry consulting firm with offices in key markets throughout Canada and the United States of America unveils their latest restaurant cost report, milestone checklist, and interactive hospitality calculator.

December 15, 2023 (TORONTO)—Today, KRG Hospitality unveils their 2023 Restaurant Start-up Cost Report + Checklist. The Toronto-based consulting firm specializes in startup restaurant and bar projects along with boutique hotels, experiential concepts, and entertainment venues. KRG also has offices in key markets throughout the United States of America.

For the past five years KRG has researched, reviewed, and published the annual start-up cost guide, one of the industry’s leading resources dedicated to restaurant project costing.

And each year this informative and transparent guide is used as a trusted budgeting tool by developers, lenders, contractors, consultants, and aspiring restaurateurs. The guide is founded upon KRG Hospitality’s proprietary database of previous project costs, which includes project data from restaurants, bars, and cafes developed over the past 24 months.

Further, this annual KRG Hospitality also includes a start-up checklist that identifies an array of crucial milestones: KRG president Doug Radkey has identified 500 unique tasks that must be completed for a successful restaurant opening.

This year’s checklist reveals a number of these crucial tasks. Updated for 2023, the guide also includes the interactive KRG Hospitality Calculator.

The costs to start a restaurant have been on a steady rise over the past 5 years. Major drivers are increases in inflation, interest, labor, construction, equipment. Of course, there are also the unique materials required to deliver a scalable, sustainable, memorable, profitable, and consistent on-premise, off-premise, or hybrid-style concept.

Drawing upon this comprehensive guide, an industry-leading expert has analyzed the information and provided a succinct and user-friendly summary of the findings for each major start-up category. This isn’t simply a couple of pages identifying a few costs. Rather, the fifth annual guide is a deep dive that provides real insight into what to expect in 2023.

The Checklist

As stated, there are 500 unique tasks an operator needs to complete over the course of developing and opening the doors to their concept.

To make it simple to navigate, the 2023 checklist is organized into sections: Planning & Admin, the Support Team, Site Development, Operations Development, Brand Development, and Team Development.

From starting off with the targeted, customized, and in-depth feasibility to planning and executing the soft opening, KRG identifies dozens of key milestones in this year’s guide.

Download your copy of the 2023 KRG Hospitality Restaurant Start-up Cost Report + Checklist today! Click here.

About KRG Hospitality

KRG Hospitality is a storied and respected agency with proven success over the past decade, delivering exceptional and award-winning concepts throughout a variety of markets found within Canada, the United States, and abroad since 2009. Specializing in startups, KRG is known for originality and innovation, rejecting cookie-cutter approaches to client projects. The agency provides clients with a clear framework tailored to their specific projects, helping to realize their vision for a scalable, sustainable, profitable, memorable, and consistent business. Learn more at KRGHospitality.com. Connect with KRG Hospitality and the Bar Hacks podcast on social: KRG Twitter, Bar Hacks Twitter, KRG Media Twitter, KRG LinkedIn.

Disclaimer

While using this guide helps develop a rough preliminary financial and strategic milestone plan, it is strongly recommended that you seek professional expert advice to provide you with a more precise, project specific estimate as each concept and market will be slightly different. KRG Hospitality Inc. is not responsible for any project that is not currently under contract within the company.

Image: KRG Hospitality
by David Klemt David Klemt No Comments

Top 10 US Metro Areas by Inflow, Q3 2022

US Metro Areas with Greatest Outflow and Inflow, Q3 2022

by David Klemt

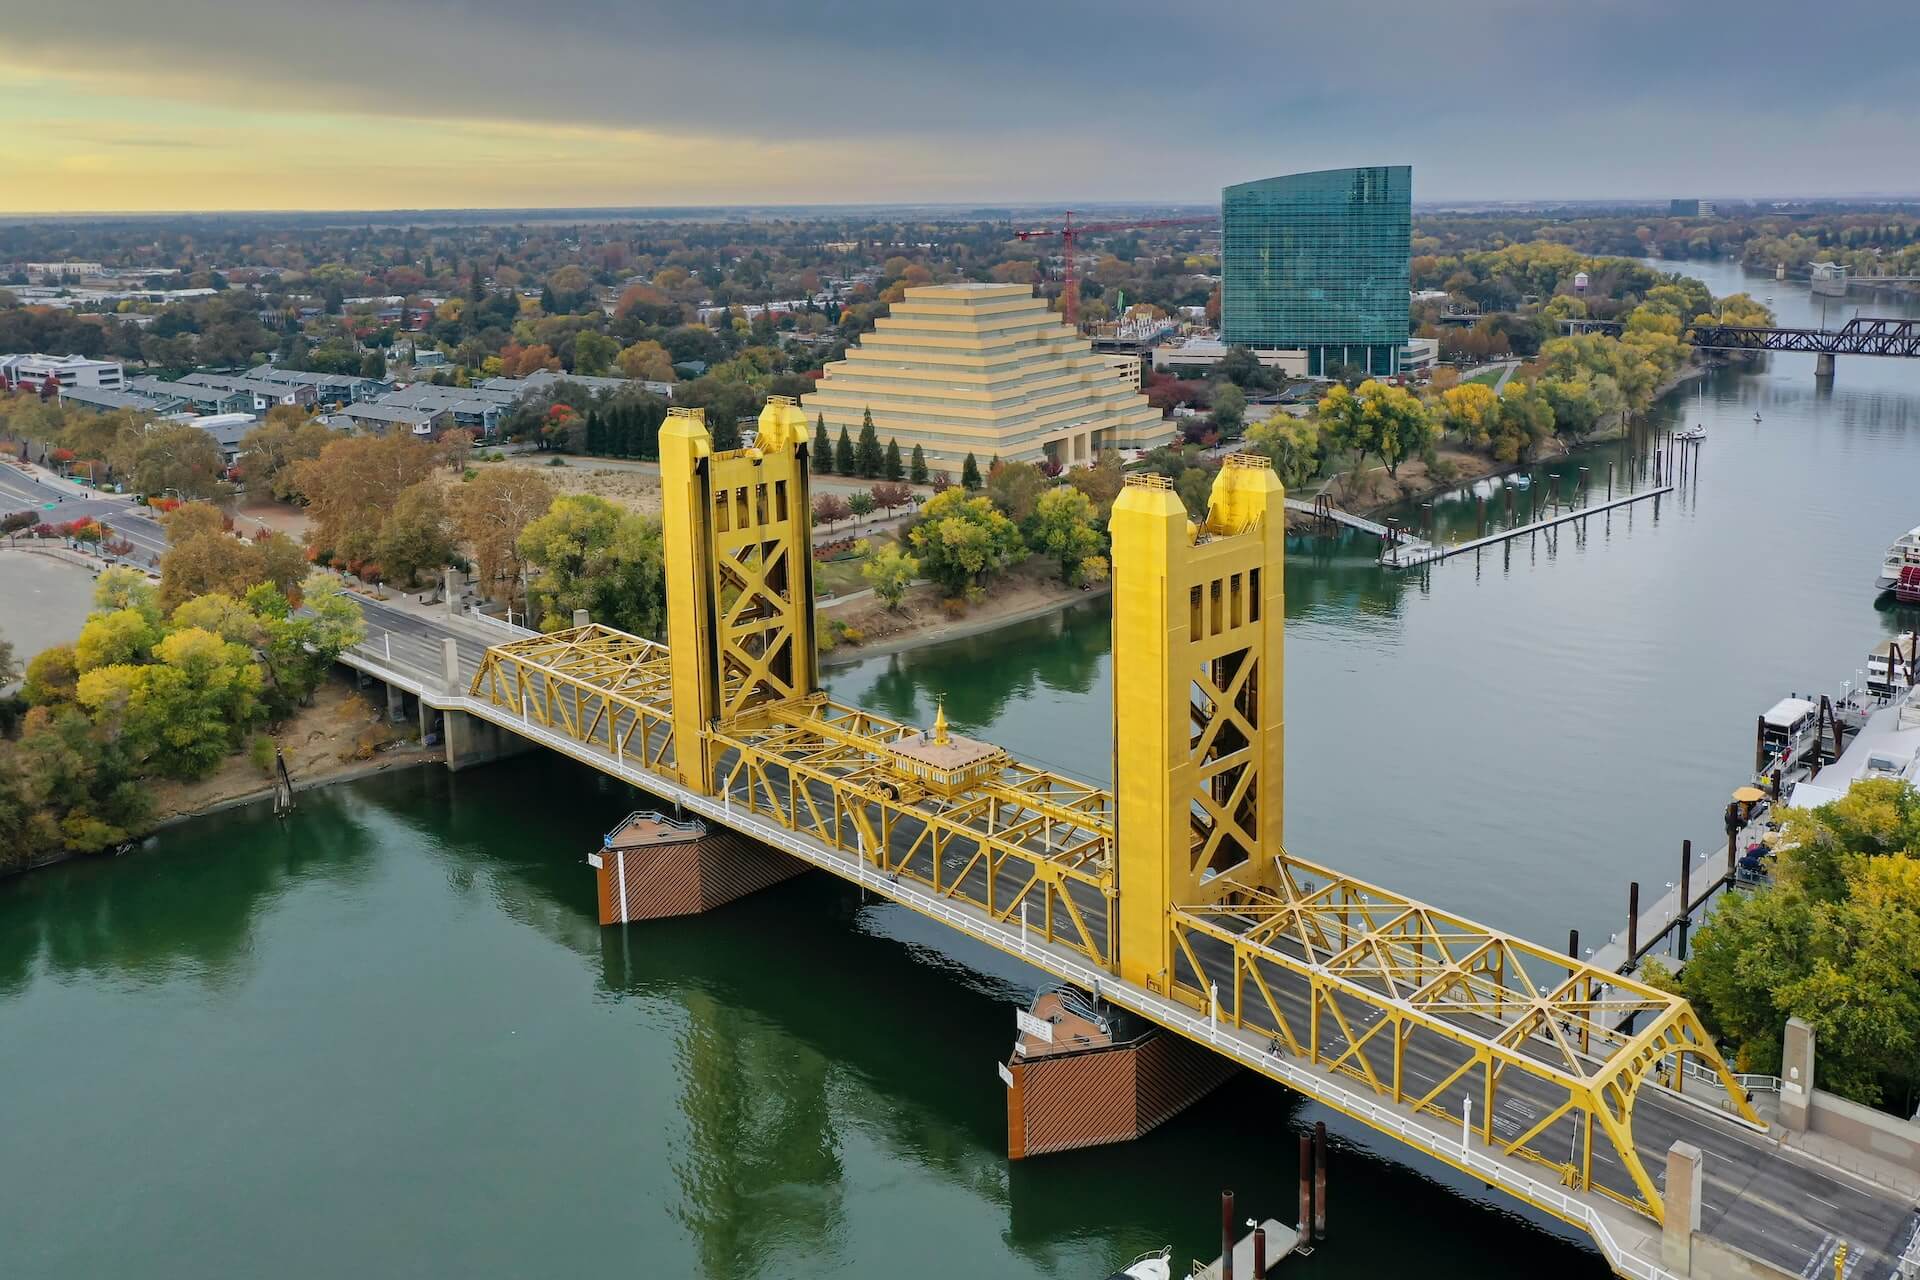
Tower Bridge in Sacramento, California

Real estate brokerage Redfin identifies the top ten American cities in terms of inflow and outflow, according to Q3 data.

Interestingly, a quarter of people appear to be searching for homes in cities different from where they currently live. Also compelling: one state, per the brokerage’s data ending in the month of October, is a clear favorite.

Obviously, this is important data for operators to have. When it comes to labor and guest pool changes, inflow and outflow information can be quite useful.

Top Inflow Cities: August to October 2022

Review the list below to see the metro areas experiencing the greatest inflow.

  1. Orlando, Florida
  2. Dallas, Texas
  3. North Port, Florida
  4. Cape Coral, Florida
  5. Phoenix, Arizona
  6. Tampa, Florida
  7. San Diego, California
  8. Miami, Florida
  9. Las Vegas, Nevada
  10. Sacramento, California

Did you spot the big trend? The state of Florida represents 50 percent of the list. Per Redfin‘s interpretation of the data, home buyers want leave expensive coastal cities behind.

Interesting to us in particular, two cities—Las Vegas and Orlando—are key KRG Hospitality markets. Also interesting is that Nevada and Florida are on the back half of Forbes’ best cities for starting a business in 2023.

However, we’ve seen strong hospitality industry recovery in Las Vegas this year. In fact, even the entertainment industry in Las Vegas is exploding. Additionally, we continue to gain clients in Orlando.

Top Outlow Cities: August to October 2022

Below are the metro areas seeing the greatest outflow.

  1. Philadelphia, Pennsylvania
  2. Seattle, Washington
  3. Denver, Colorado
  4. Detroit, Michigan
  5. Chicago, Illinois
  6. Boston, Massachusetts
  7. Washington, DC
  8. New York, New York
  9. Los Angeles, California
  10. San Francisco, California

If we compare Redfin’s Q2 data to the list above, it’s mostly the same. In fact, the top four outflow cities are identical. Spots five through nine are simply a reshuffling of Q2 and Q3 data.

However, Minneapolis, number ten in Q2, is replaced by Philadelphia in Q3. According to Redfin data, those Philly residents searching for homes elsewhere are showing interest in Salisbury, Maryland.

Consider how expensive it can be to move to and live in LA and San Francisco. It makes sense that California is the only state with two cities on the list above, doesn’t it?

Per Redfin, San Francisco residents are searching Sacramento and Seattle. Those in LA are looking at San Diego and Las Vegas.

Takeaway

It’s important to know where people are moving to and what cities they’re leaving behind. And it’s interesting to get a data-driven view of which states may be best for starting a business.

However, it’s far more useful to know how feasible a given ZIP code may be for a specific concept. So, while these types of lists are helpful, they’re not as practical as a targeted feasibility study.

Moreover, the dust doesn’t appear to have settled when it comes to migratory patterns of home buyers. It’s quite possible that Redfin’s 2023 inflow and outflow data will change once again in Q1 and Q2.

Image: Stephen Leonardi on Unsplash

by David Klemt David Klemt No Comments

Starting a Business? Consider These States

Want to Open a Business in 2023? Consider These States

by David Klemt

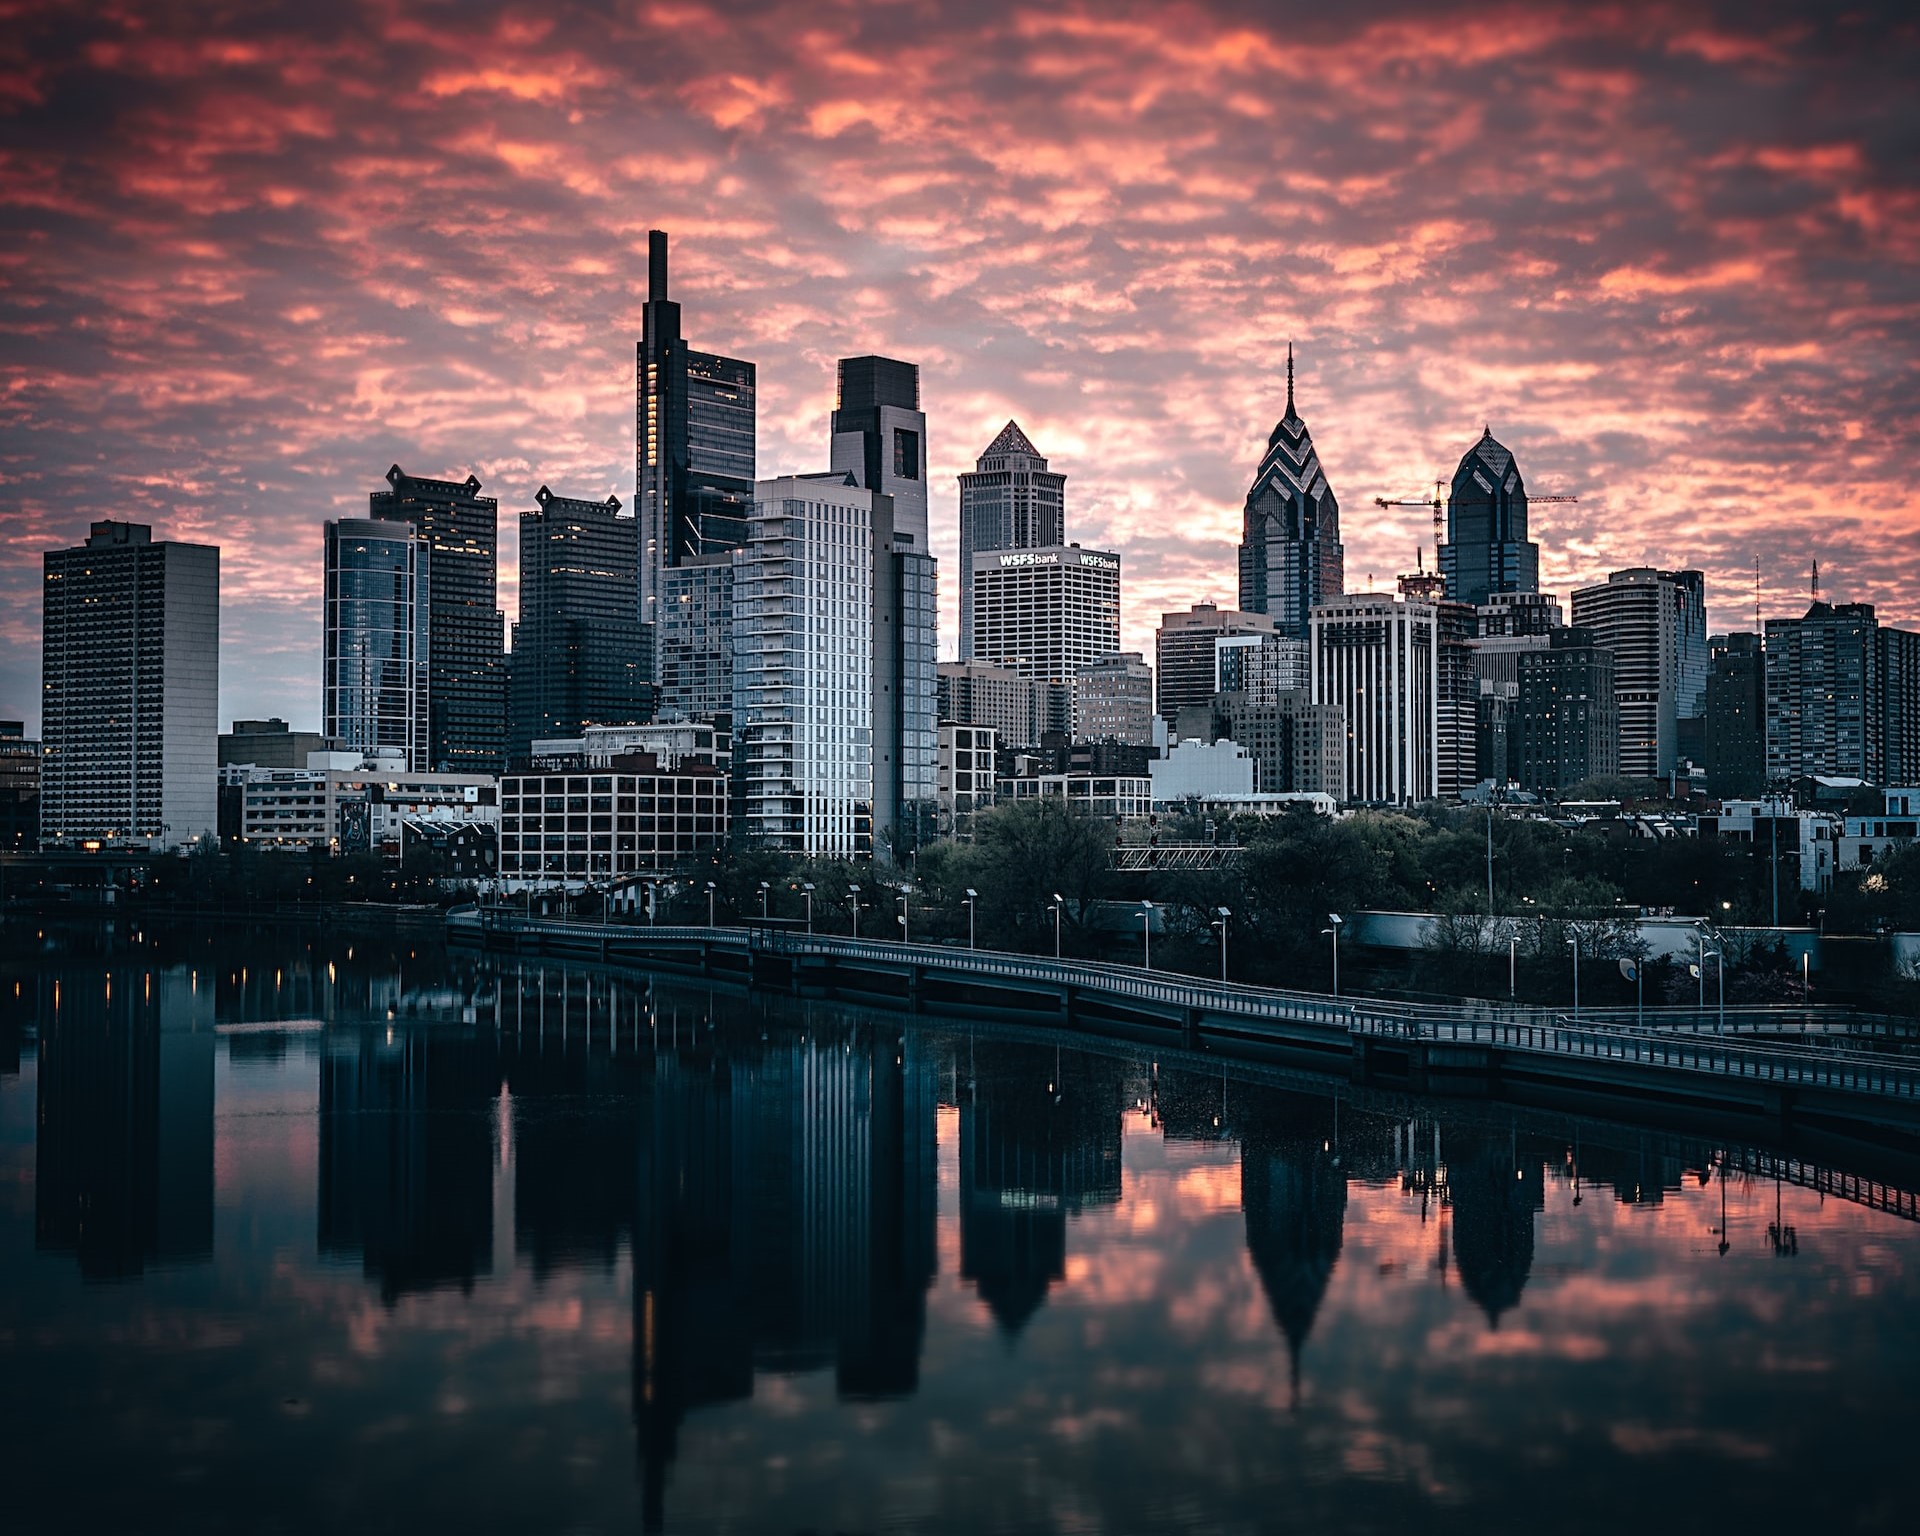
Philadelphia skyline at sunset

If you’re considering opening a restaurant, bar, nightclub, eatertainment venue, or hotel in 2023, you should consider these states.

As it turns out, according to Forbes, one state is the home to a major KRG Hospitality market: Philadelphia.

Per Forbes Advisor, Pennsylvania is among the top five states for starting a new business next year. In fact, the Keystone State ranks number four.

To make their list, Forbes analyzed all 50 states through the lens of five categories:

  • Business costs
  • Business climate
  • Economy
  • Financial accessibility
  • Workforce

Within those categories, Forbes examined 18 metrics. The result, as already stated, is that just three states rank ahead of Pennsylvania for this Forbes list.

Top 25 States to Start a Business in 2023

Below you’ll find how the top half of the list shakes out. Indiana, Colorado, and North Dakota claim the top positions. A low cost of living and “a business-friendly climate” put Indiana in the number-one spot.

One interesting reason that Pennsylvania ranks comes down to funding for entrepreneurs. Per Forbes, “total small business loan funding in Pennsylvania is double that of the national average.”

  1. Washington
  2. West Virginia
  3. Rhode Island
  4. Idaho
  5. Utah
  6. Wisconsin
  7. South Carolina
  8. Virginia
  9. Hawaii
  10. Mississippi
  11. Missouri
  12. New Hampshire
  13. Massachusetts
  14. California
  15. Connecticut
  16. Delaware
  17. Ohio
  18. Illinois
  19. Montana
  20. North Carolina
  21. South Dakota
  22. Pennsylvania
  23. North Dakota
  24. Colorado
  25. Indiana

However, the list above is interesting for another reason: the recent addition of consultant Kim Richardson to the KRG Hospitality team. Not only is Kim representing our Philadelphia, Pennsylvania, office, she’s our rep for the Northeastern region of the United States.

That means she’s serving Connecticut, Delaware, Maine, Massachusetts, New Hampshire, Maryland, New Jersey, New York, Pennsylvania, Rhode Island, and Vermont. Or, put another way, Kim is representing KRG in six states on the list above. (Pennsylvania is in bold above, while the other Northeastern states on the list she’s representing are in italics).

Proceed with Caution

Now, a word of reason and caution. Just because someone tells you that a particular state or city is the best place for your business doesn’t mean success will follow automatically.

It really doesn’t matter how great the idea for your concept happens to be—long-term success in this industry takes hard work. And that work starts with the planning phase.

So, no, you can’t just throw a dart at the Northeastern states or a map of one of the states on this list and open your restaurant, bar, or hotel there. Site selection involves more than contacting a commercial real estate agent, viewing a few locations, and signing a lease.

There’s a long list of tasks that you must complete in the planning stage before you ever open your doors. An in-depth feasibility study, a KRG Hospitality specialty, identifies the best location for a specific concept. In actuality, the feasibility study includes several smaller tasks that must be completed.

Again, this is simply to determine the best place for a particular concept. There are many other tasks you must complete, each of which KRG is here to help you accomplish.

So, while this list is interesting, there’s much more for your consideration.

The Bottom 10

Since I know you’re curious, below you’ll find the ten states that represent the tail end of the Forbes list:

  1. New York
  2. New Mexico
  3. Vermont
  4. Michigan
  5. Oregon
  6. Florida
  7. Nevada
  8. Kentucky
  9. Oklahoma
  10. Kansas

Now, another word of caution. These states rounding out the list of 50 doesn’t mean they’re “the worst” for starting a business.

In fact, we’ve had great success in Florida, as one example. So, take this list with a grain of salt: there’s much more to consider for a hospitality concept to give it the best odds of success in any market.

Image: Dan Mall on Unsplash

by David Klemt David Klemt No Comments

The Most-stressed Cities in the US

These are the Most-stressed Cities in the US

by David Klemt

Deflated smiley face balloon in street

There’s a simple argument to be made that one characteristic the happiest cities share is being among the least stressful to live.

Yesterday we took a look at the happiest cities in the US, according to WalletHub analysis. Click here in case you haven’t yet read that article.

Today, let’s check out the most- and least-stressed cities in America. As with their happiest and least-happy cities list, WalletHub ranks 182 cities based on stress levels.

Of course, “least stressed” doesn’t mean “stress-free.” Nor should it—some stress is good for us. After all, stress can push us to perform our best, bring out our problem-solving creativity, and even energize us.

The rankings below may surprise you. Like me, you may even find yourself raising an eyebrow and disagreeing with some of them.

However, it’s a compelling list worth reviewing if you’re an operator, leadership team member, hospitality professional, or in the site-selection portion of opening a restaurant or bar.

The Top 25 Cities of Stress

When determining their results, WalletHub ranked 182 cities according to four main categories. Those categories are: work stress; financial stress; family stress; and health and safety stress. The categories consist of 40 key metrics in total.

I think it’s safe to assume that no city wants to be in the top 25 of this list, or even the top 50. Neither, I’m certain, does any city want to wear the crown of “Most Stressed US City.”

Unfortunately, someone must be number one. Below, the top 25 “Cities of Stress,” per WalletHub:

  1. Cleveland, Ohio
  2. Detroit, Michigan
  3. Gulfport, Mississippi
  4. Baltimore, Maryland
  5. Philadelphia, Pennsylvania
  6. Memphis, Tennessee
  7. New Orleans, Louisiana
  8. Birmingham, Alabama
  9. Louis, Missouri
  10. Toledo, Ohio
  11. Augusta, Georgia
  12. Jackson, Mississippi
  13. North Las Vegas, Nevada
  14. San Bernadino, California
  15. Fayetteville, North Carolina
  16. Akron, Ohio
  17. Wilmington, Delaware
  18. Houston, Texas
  19. Montgomery, Alabama
  20. Shreveport, Louisiana
  21. Cincinnati, Ohio
  22. Newark, New Jersey
  23. Mobile, Alabama
  24. Columbus, Georgia
  25. Indianapolis, Indiana

Alas (I don’t get to use this word much), Ohio has four cities on this list. In fact, the Buckeye State has two cities in the top ten.

Of course, Ohio isn’t the only state with multiple cities in the top 25 stressed cities. Alabama has three cities among the top 25. Also, Mississippi and Louisiana each have two cities on this part of the list, unfortunately.

Cities 26 Through 91

As you’ll see below, Ohio shows up a couple of times in this portion of the list. However, so do a handful of other states.

For example, ten Texas cities land on this part of the list. That means Texas has 11 cities among the “top” half of the most-stressed US cities.

  1. Baton Rouge, Louisiana
  2. Las Vegas, Nevada
  3. Huntington, West Virginia
  4. Springfield, Missouri
  5. Dover, Delaware
  6. Norfolk, Virginia
  7. Milwaukee, Wisconsin
  8. Chicago, IL
  9. Newport News, Virginia
  10. Washington, DC
  11. Dallas, Texas
  12. Richmond, Virginia
  13. Tulsa, Oklahoma
  14. Chattanooga, Tennessee
  15. Bridgeport, Connecticut
  16. San Antonia, Texas
  17. Atlanta, Georgia
  18. Glendale, Arizona
  19. New York, New York
  20. Tucson, Arizona
  21. Columbia, South Carolina
  22. Columbus, Ohio
  23. Knoxville, Tennessee
  24. New Haven, Connecticut
  25. Brownsville, Texas
  26. Rochester, New York
  27. Casper, Wyoming
  28. Vancouver, Washington
  29. Oklahoma City, Oklahoma
  30. Jacksonville, Florida
  31. Corpus Christi, Texas
  32. Charleston, West Virginia
  33. Henderson, Nevada
  34. Phoenix, Arizona
  35. Modesto, California
  36. Wichita, Kansas
  37. Winston-Salem, North Carolina
  38. Little Rock, Arkansas
  39. Moreno Valley, California
  40. Louisville, Kentucky
  41. Stockton, California
  42. Spokane, Washington
  43. Fresno, California
  44. Miami, Florida
  45. Kansas City, Missouri
  46. El Paso, Texas
  47. Salem, Oregon
  48. Hialeah, Hawaii
  49. Los Angeles, California
  50. Fort Smith, Arizona
  51. Fort Worth, Texas
  52. Denver, Colorado
  53. Arlington, Texas
  54. Buffalo, New York
  55. Greensboro, North Carolina
  56. Bakersfield, California
  57. Fort Wayne, Indiana
  58. Providence, Rhode Island
  59. Tacoma, Washington
  60. Port St. Lucie, Florida
  61. Lewiston, Maine
  62. Laredo, Texas
  63. Cape Coral, Florida
  64. Grand Prairie, Texas
  65. Garland, Texas
  66. Aurora, Colorado

Cities 92 Through 137

This is where things begin to turn around, at least mathematically. This is the “bottom” half of the list.

Or, to phrase it another way, this section starts identifying the least-stressed cities in America.

  1. Portland, Oregon
  2. Ontario, California
  3. Lubbock, Texas
  4. Reno, Nevada
  5. Huntsville, Alabama
  6. Sacramento, California
  7. Amarillo, Texas
  8. Albuquerque, New Mexico
  9. Tampa, Florida
  10. Long Beach, California
  11. Colorado Springs, Colorado
  12. Fontana, California
  13. Tallahassee, Florida
  14. Las Cruces, New Mexico
  15. Worchester, Massachusetts
  16. Orlando, Florida
  17. West Valley City, Utah
  18. Fort Lauderdale, Florida
  19. Peoria, Arizona
  20. Riverside, California
  21. Mesa, Arizona
  22. Nashville, Tennessee
  23. Des Moines, Iowa
  24. Nampa, Idaho
  25. Tempe, Arizona
  26. Irving, Texas
  27. Oakland, California
  28. Grand Rapids, Michigan
  29. Charlotte, North Carolina
  30. Rancho Cucamonga, California
  31. Boston, Massachusetts
  32. Pittsburgh, Pennsylvania
  33. Honolulu, Hawaii
  34. Oceanside, California
  35. Pearl City, Hawaii
  36. Anchorage, Alaska
  37. Warwick, Rhode Island
  38. Virginia Beach, Virginia
  39. Cheyenne, Wyoming
  40. Petersburg, Florida
  41. Chesapeake, Virginia
  42. Billings, Montana
  43. Lexington-Fayette, Kentucky
  44. Durham, North Carolina
  45. Santa Ana, California
  46. Jersey City, New Jersey

Cities 138 through 182

Finally, we reach what cities, according to WalletHub analysis, experience the least amount of stress.

  1. Salt Lake City, Utah
  2. Aurora, Illinois
  3. Santa Clarita, California
  4. Glendale, California
  5. Manchester, New Hampshire
  6. Paul, Minnesota
  7. Garden Grove, California
  8. Pembroke Pines, Florida
  9. Yonkers, New York
  10. Chandler, Arizona
  11. Oxnard, California
  12. Juneau, Alaska
  13. Anaheim, California
  14. Santa Rosa, California
  15. Chula Vista, California
  16. Charleston, South Carolina
  17. Raleigh, North Carolina
  18. San Francisco, California
  19. Huntington Beach, California
  20. Omaha, Nebraska
  21. San Diego, California
  22. Gilbert, Arizona
  23. Scottsdale, Arizona
  24. Rapid City, South Dakota
  25. Austin, Texas
  26. Seattle, Washington
  27. Minneapolis, Minnesota
  28. Missoula, Montana
  29. Boise, Idaho
  30. Nashua, New Hampshire
  31. Plano, Texas
  32. Cedar Rapids, Iowa
  33. Lincoln, Nebraska
  34. Portland, Maine
  35. Irvine, California
  36. Burlington, Vermont
  37. Sioux Falls, South Dakota
  38. Bismarck, North Dakota
  39. San Jose, California
  40. Columbia, Maryland
  41. Fargo, North Dakota
  42. Overland Park, Kansas
  43. Madison, Wisconsin
  44. South Burlington, Vermont
  45. Fremont, California

Twelve of the cities on this part of the list are in California. Further, the least-stressed city in California: Fremont. If you read yesterday’s article, you know that WalletHub ranked Fremont, California, the happiest city in the US.

Image: Nathan Dumlao on Unsplash

by David Klemt David Klemt No Comments

Which Cities and States are the Happiest?

Which US Cities and States are the Happiest?

by David Klemt

Yellow smiley face ball

As an entrepreneur and operator evaluating a market for a first location or expansion, it can help to know where people are happiest.

Equally as helpful: Knowing the cities and states that are the least happy. Not, necessarily, so an operator can avoid these markets.

Rather, one’s concept may be a ray of stress-free sunshine for a given community. Providing a great workplace with a positive culture can work wonders for both the happiest and least-happy places. And as the cornerstones of the communities they serve, restaurants and bars can improve their guests’ quality of life.

We’ve looked at the US cities with the greatest inflow and outflow (which can reveal happiness levels), as identified by Redfin. And we’ve checked out the best US retirement cities, researched by Clever.

Now, we’re taking a look at which US cities and states are the happiest and least happy, according to WalletHub. In case you’re unaware, personal finance site WalletHub researches a vast array of topics. You can browse them here.

Happiest Cities

While determining which are happiest, WalletHub identified the happiest 182 cities. Obviously, that’s a far cry from how many cities are in the US.

According to one source, there 19,495 cities, towns, and villages across the country (per data from 2018). Of those, 4,727 cities have populations of 5,000 or more. A total of 310 cities have populations of at least 100,000, and only ten are home to one million people or more.

So, living in any of the 182 cities WalletHub suggests one is pretty happy. However, these are the ten happiest cities, in descending order:

  1. Fremont, California
  2. Columbia, Maryland
  3. San Francisco, California
  4. San Jose, California
  5. Irvine, California
  6. Madison, Wisconsin
  7. Seattle, Washington
  8. Overland Park, Kansas
  9. Huntington Beach, California
  10. San Diego, California

As you can see, six of the 10 cities are in California. In fact, 29 of the 182 cities on this list are located in the Golden State.

To create their list, WalletHub analyzed several metrics that make up three main categories: emotional and physical well-being; work environment; and community and environment.

Fremont, CA, is number one for emotional and physical well-being. The top spot for work environment goes to San Francisco, CA. And the number-one city for community and environment is Casper, Wyoming, which is number 79 on the list overall.

Least-happy Cities

Again, understanding that there are more than 19,400 cities, towns, and villages in the US alters the context of this list a bit.

Living and operating in one of these 182 cities indicates a person is living in a happy city. Basically, it isn’t the worst place to live if it’s on this list.

At any rate, let’s look at the 10 cities that make up the bottom of WalletHub’s list. Or, the “least-happy” cities, at least as far as these rankings are concerned.

  1. Detroit, Michigan
  2. Gulfport, Mississippi
  3. Memphis, Tennessee
  4. Huntington, West Virginia
  5. Montgomery, Alabama
  6. Cleveland, Ohio
  7. Augusta, Georgia
  8. Fort Smith, Arizona
  9. Mobile, Alabama
  10. Shreveport, Louisiana

Happiest States

WalletHub also ranked 50 states to determine the happiest and least happy. I checked, and, yep, that’s all of ’em! I will say it’s a bit disappointing they didn’t include Puerto Rico, but it isn’t the 51st state (yet).

WalletHub focused on 30 metrics to rank the states, which make up three main categories: emotional and physical well-being; work environment; and community and environment.

In descending order, the happiest states in America are:

  1. Hawaii
  2. Maryland
  3. Minnesota
  4. Utah
  5. New Jersey
  6. Idaho
  7. California
  8. Illinois
  9. Nebraska
  10. Connecticut

Hawaii doesn’t just take the top spot overall, it also claims number one for emotional and physical well-being. Utah takes first for work environment, and community and environment.

Rounding out the “happiest half” of the US are:

  1. Virginia
  2. South Dakota
  3. North Dakota
  4. Massachusetts
  5. New Hampshire
  6. Iowa
  7. Delaware
  8. Florida
  9. Georgia
  10. North Carolina
  11. Wisconsin
  12. Washington
  13. New York
  14. Maine
  15. Wyoming

Least-happy States

Conversely, the following are the least-happy states, starting with the unhappiest:

  1. West Virginia
  2. Louisiana
  3. Arkansas
  4. Kentucky
  5. Alabama
  6. Mississippi
  7. Oklahoma
  8. Tennessee
  9. New Mexico
  10. Missouri

Filling out the least-happy half of the country are:

  1. Alaska
  2. Michigan
  3. Ohio
  4. Indiana
  5. Texas
  6. Nevada
  7. Vermont
  8. South Carolina
  9. Kansas
  10. Arizona
  11. Colorado
  12. Montana
  13. Rhode Island
  14. Pennsylvania
  15. Oregon

In terms of the three metrics WalletHub analyzed, West Virginia is ranked last for emotional and physical well-being. Unfortunately, Mississippi is last for work environment. And Texas comes in last for community and environment.

Image: chaitanya pillala on Unsplash

by David Klemt David Klemt No Comments

New Operators Can Reject the Old Models

New Operators Can Reject the Old Models

by David Klemt

Thinking differently planning concept with light bulb on chalkboard

There’s no reason new hospitality business owners and operators have to do what’s always been done.

In fact, new owners and operators are in a prime position to create entirely new business models.

If we’re going to change things and set the industry up for success in the future, we need to pursue different ways of doing business.

Industry Pioneer and Icon

Lynnette Marrero, widely known as a pioneer in this industry, is enjoying a career that should inspire all hospitality professionals.

After getting her start as a cocktail waitress at New York City’s storied Flatiron Lounge, she transitioned to bartender. In that role, Marrero was able to learn under Flatiron Lounge co-owner and bartending sage Julie Reiner.

She has created and consulted on world-class, award-winning cocktail programs. If you find yourself in New York City, plan to stop into Llama Inn and Llama San to experience Marrero’s menu programming.

Marrero is a James Beard Award and Spirited Award winner, a Dame Hall of Fame inductee, and the co-founder of high-speed all-female bartending competition Speed Rack.

Perhaps most importantly, she’s a mentor and an innovator helping to shape the career’s of new bartenders and hospitality pros.

And on episode 54 of the Bar Hacks podcast, Marrero encourages new operators to think differently about how they run their businesses.

New Models

Specifically, Marrero explains that new owners and operators are in a position to run things differently from the start.

“I think it’s a lot about changing your structures from the beginning. Don’t feel pressure to have to go into models that already exist,” says Marrero. “You can build new models and you can think about new ways.”

Making impactful change from the very beginning requires a change in how we think about running restaurants, bars, hotels, and other hospitality businesses.

“What does ownership look like?” asks Marrero, providing examples of new approaches to ownership. “Can you start a place that’s more profit sharing for staff? Can you build that in from the beginning?”

Offering further considerations, Marrero suggests that new owners and operators consider operational elements such as earned equity and co-op-style ownership.

In theory, such structures, which are certainly far from the norm, may lead to significant reductions in turnover, boosts to staff morale and engagement, and a more dynamic team. Putting different structures in place rather relying on the old models can lead to building teams invested in helping owners grow their businesses for the long term.

Change is Necessary

While established operators can certainly make changes to their existing operations, Marrero says that it’s easier for new businesses to do so.

In part, this is because investors know going in what the labor structure is, for example. They therefore also understand how the payback structure will work.

And that’s just on the investment side of the equation. On the labor side, new structures make it easier to recruit, hire, and retain staff.

Solving labor shortages leads to operating at full strength for full days rather than relying on shortened hours. Staff are less overwhelmed and costly turnover is reduced.

It’s easier to do things the way they’ve always been done. But rejecting the old ways can be far more fulfilling and profitable for everyone involved.

Image: Pixabay on Pexels

by David Klemt David Klemt No Comments

Introducing KRG Mindset Coaching

Introducing KRG Mindset Coaching

by David Klemt

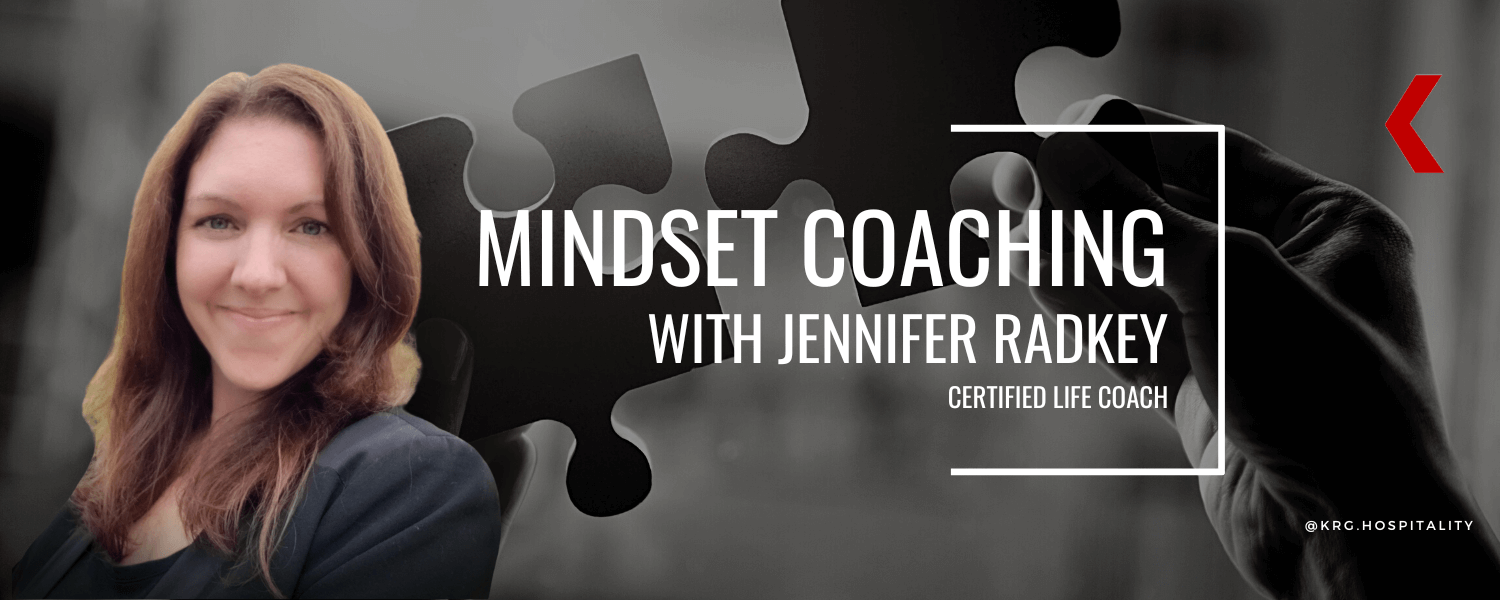
KRG Hospitality Mindset Coaching

Seeking an alternative to complete start-up planning and project management? The solution you’re looking for is KRG Mindset Coaching.

Just like every operator is unique, each project brings with it distinct challenges that require individual approaches and plans.

Some projects are already under way but need help moving forward. KRG Mindset gives these projects the help needed to cross the finish line and achieve long-term success.

What is Mindset Coaching?

Owning a hospitality business may look great on paper, but starting a hospitality business can be really quite stressful:

  • There are what seem to be endless hours of planning.
  • There are numerous third-parties involved.
  • There are often hundreds of thousands of dollars at stake.
  • There are over 500 unique tasks to complete.

It doesn’t matter if this is your first, fifth, or twentieth project—it’s crucial that you be both prepared and organized when opening a new concept or expanding operations.

However, not every project requires our full suite of targeted solutions, which includes feasibility studies, conceptual planning, business planning, brand development, guest experience strategies, food & beverage programs, and operational assessments.

If you’re beyond the idea stage but find your project is struggling to reach the finish line, we’re here to help. And just like a project in its earliest days, you’ll receive the unique, fully customized KRG treatment.

Is Mindset the Solution for You?

KRG Mindset provides a unique, coaching-style program that helps your start-up make continual forward progress:

  • Receive a dedicated consultant who will be an approachable advisor for you and your project. They’ll review and navigate your start-up questions and challenges, and be your compass to provide you with a clear path towards a successful opening.
  • Weekly 1-on-1 video/phone sessions with access to a private calendar: a weekly session in which we evaluate the past week and define required actions for the next week with a focus on budgets, timelines, and industry-specific consulting.
  • Your dedicated consultant is also available for second opinions and the review of: key documents, location, concept, branding, layouts, equipment, menu, service, technology, labor and financial optimization, system development, operations, marketing, and overall strategic clarity.
  • Your consultant will help you see the blind spots throughout your project, positioning you to maintain your budget and desired opening date.
  • Your consultant will help you make strong, educated decisions throughout your start-up project that will have a positive impact on the successful start of your restaurant, bar or hospitality brand.
  • And finally, your advisor will coach you so you become more confident, energized, and motivated about your opening while holding you accountable and helping you become a better leader through the creation of new habits, communication methods, and decision-making processes.

Click here to schedule a call.

Or, if you’re looking for a more hands-on approach where we develop the winning plans and property for and with you, we invite you to learn more by choosing your preferred option: Restaurants & Cafes, Bars & Lounges, Boutique Hotel & Resorts, or Golf, Gaming & Entertainment.

Images: KRG Hospitality

Top