35 Bar Hacks Podcast Episodes for World Bartender Day
by David Klemt
This Saturday, February 24, we celebrate World Bartender Day, so here are 35 Bar Hacks episodes featuring some of our favorite people in the bar business.
We’ve had the honor of speaking with incredibly talented, humble, and generous bartenders. Below you’ll find the Spotify and Apple Podcasts links to nearly three-dozen of these informative and entertainment conversations.
Please join us in thanking your bartenders on Saturday. And if you’re an operator, we encourage you to come up with a way to celebrate your bar team to show them your appreciation.
Cheers!
Episode 109 with Colin Asare-Appiah
Host David Klemt had the opportunity to chat with Colin Asare-Appiah, an industry icon he’s wanted to talk to for many years. Colin is Bacardí’s trade director of multiculture and lifestyle, and the brand’s LGBTQIA+ advocate. Not only does he spread the message of diversity, equity, and inclusion, he believes (as does KRG Hospitality and Bar Hacks) that diversity is necessary for our industry to thrive.
In this episode you’ll learn about Colin Asare-Appiah’s journey through hospitality, which includes saying he’d never be a bartender to becoming a bartender and creating a bartending school; his thoughts on what makes a successful operator and team; cocktail and spirits trends for 2024; the AJABU cocktail festival coming to South Africa in March of this year, spearheaded by Colin and his partner Mark Talbot Holmes; and more.
Spotify link
Apple Podcasts link
Episode 107 with Anne Becerra
Anne Becerra is the first female Certified Cicerone in New York City and has been working in beer for more than a decade. More importantly, however, she’s as passionate as she is educated about beer. Anne’s also passionate about hospitality, which comes across in this conversation. Truly, she loves hospitality, the beverage world, and how the two pair to make people feel amazing.
On this episode Anne talks introducing guests to beer; serving beer aficionados, beer neophytes, and the beer wary; how to make guests feel comfortable in a beer-centric concept; what she’s excited about in the beer world; tips for operators who want to succeed with a beer-forward venue; and much, much more. Cheers!
Spotify link
Apple Podcasts link
Episode 106 with Matthias Ingelmann
Since opening their doors, KOL Restaurant has found its way onto the World’s 50 Best Restaurants list, and Kol Mezcaleria can be found on the World’s 50 Best Disovery tool. The upscale Mexican restaurant and bar, co-owned by Chef Santiago Lastra, celebrates Mexican culture and traditions hand in hand with British ingredients. They’re also currently participating in the 14th annual London Cocktail Week.
KOL bar manager Matthias Ingelmann dropped by the Bar Hacks podcast while he and the team prepared for service. On this episode, Matthias talks agave spirits; introducing guests to artisanal and ancestral agave spirits along with Mexican rum, gin, and whiskey; planning for seasonality and menu changes; maintaining the familiar while offering new menu items; honoring Mexican culture with this fusion concept; what he looks for in team members; and more.
Spotify link
Apple Podcasts link
Episode 104 with Simone Caporale
Simone Caporale, an internationally renowned bartender and operator, swings by the Bar Hacks podcast to talk spirits, branding, the guest experience, and operations.
Noticing a gap in the industry and seeing a way to lend his expertise to help grow spirits brands, Simone and Luca Missagli founded Cocktail Concierge, a brand-building agency focusing on craft spirits brands. One of the most recent brands Cocktail Concierge has helped introduce to the world is Amaro Santoni.
Of course, Simone is also one of forces behind SIPS Drinkery House, number three on the World’s 50 Best Bars list, and the World’s Best Bar according to Tales of the Cocktail. Simone shares his thoughts on what he thinks makes SIPS so successful, why he views service as a privilege, three tips operators can implement today to plant the seeds for long-term success, and more!
Spotify link
Apple Podcasts link
Episode 103 with Ryan Chetiyawardana, aka Mr. Lyan, part 2
Ryan Chetiyawardana, also known as Mr. Lyan, returns to the Bar Hacks podcast! Ten years ago, Ryan opened the first bar in what would become the Mr. Lyan empire, White Lyan. This innovative venue set the tone for Ryan and the team’s approach to creating bars.
On this episode of the Bar Hacks podcast, Ryan shares details of the ten-year celebrations; what it means to him to have reached the ten-year operator milestone; lessons learned over the course of more than ten years running bars; what people can expect from the re-release of his book Good Things to Drink with Mr Lyan and Friends, now with brand-new content and a new title, Mr Lyan’s Cocktails at Home: Good Things to Drink with Friends; and more!
Spotify link
Apple Podcasts link
Episode 102 with Jordan Bushell
Global Hennessy brand ambassador Jordan Bushell returns to the Bar Hacks podcast. While Jordan may know people with more Cognac knowledge, we don’t know anyone who knows more about this spirit category. More importantly, he’s as generous with his time as he is knowledgeable about Cognac. If you have a question about the spirit of Hennessy you can reach out to him and he’ll answer you.
On this episode of Bar Hacks, Jordan talks about special Hennessy releases, initiatives, collaborations, and what sets the maison apart from others in the Cognac region of France. He also talks about how operators can introduce guests to Cognac and Hennessy, including paying attention how they price their menus. Cheers!
Spotify link
Apple Podcasts link
Episode 101 with Ryan Chetiyawardana, aka Mr. Lyan
Ryan Chetiyawardana, also known as Mr. Lyan, is one of the bar world’s true visionaries. He opened his first bar, White Lyan, in 2013 and the venue immediately achieved its intended purpose. Beyond being an award-winning bar and one of London’s best places to grab a drink, White Lyan started a much-needed conversation about sustainability in the industry.
Dandelyan, Lyaness, Super Lyan, Cub, and Silver Lyan would follow shortly after, making an even bigger splash not only in London but also Amsterdam and Washington, DC. All Mr. Lyan venues, while showcasing incredible innovation, accomplish something just as important: each bar is a place people to want to spend their time and money, and where professionals want to work.
During this fantastic conversation, Ryan shares insights into the menu programming processes at each venue; discusses seasonality; provides a look into hiring and engaging each team; the reissue of his book and his foray into the RTD cocktail space; and much more.
Spotify link
Apple Podcasts link
Episode 99 with Michele Mariotti
Bartender Michele Mariotti leads an illustrious career. He has worked behind the bars at some of the best hotels around the world, including the Savoy in London and Mandarin Oriental in Singapore.
As of 2020, Michele has held the title head of bars at the Gleneagles Hotel in Perthshire, Scotland. In this role, he heads the programs at 11 F&B venues on the property, overseeing dozens of bar professionals.
On this episode, Michele and Bar Hacks podcast host David Klemt talk about mentorship, interviewing potential bartenders, menu development, using a flavor map when assigning new cocktail builds to bar team members, finding inspiration, interesting hotel guests, bespoke glassware, investing in platforms and programs that boost staff retention, and more.
Spotify link
Apple Podcasts link
Episode 96 with Lynnette Marrero
You know about RTDs, but what about RTEs? Lynnette Marrero returns to the Bar Hacks podcast, dialing in from a very cool hybrid restaurant-work concept in Cincinnati to talk about Delola, the recently launched premium ready-to-enjoy cocktail brand.
The House of Delola was founded by Jennifer Lopez with the mission of launching premium, sophisticated RTE cocktails. The core lineup consists of three spritzes crafted in collaboration with bartending, mixology, and hospitality icon Lynnette Marrero. A truly collaborative effort, Lynnette created bold yet refreshing spritzes that resonate with JLo’s party personality, Lola.
Spotify link
Apple Podcasts link
Episode 95 with Bob Peters
Bob Peters has big news to share, and you can hear in his voice how excited he is to share it with everyone. He’s taking on the perfect role. In fact, he calls it his dream job during this episode. Cocktails and cuisine are about to get even better in North Carolina and South Carolina…
But it doesn’t stop there! Bob also shares his approach to bar training to make sure everyone is engaged; his assessment of the Charlotte dining and drinking scene; a simple step all restaurants and bars can take today to improve operations, team engagement, and the guest experience; a very cool project he’s taking on; and more.
Spotify link
Apple Podcasts link
Episode 93 with Adrián Michalčík
Adrián Michalčík is the director of mixology at the award-winning Pier 42 inside the Amerikalinjen hotel in Oslo, Norway. The bar has been recognized by the World’s 50 Best and has won Best Bar of Norway twice. In addition to taking home the title of 2022 Diageo World Class Global Bartender of the Year, Adrián has won several bartending competitions throughout the years.
He popped by the Bar Hacks podcast to chat with host David Klemt about his bartender journey. Adrián has worked in several types of bars and each helped him develop the skills that allowed him to elevate his skills behind the bar. Mentors, his endless quest for knowledge, his passion for hosting others, and his focus on empathy have informed his approach to team building, delivering top-level hospitality, and tapping into his creativity to develop Pier 42’s cocktail menus.
Adrián shares the three pillars he believes great bars are built upon, what he looks for in bar team members, transforming people from guests to friends, the importance of storytelling, and much more.
Spotify link
Apple Podcasts link
Episode 91 with Charles Joly
Industry icon, bar educator, entrepreneur, and bartender Charles Joly drops by the Bar Hacks podcast to chat with host David Klemt. The two discuss Charles’ start and his journey from the trenches to opening Chicago’s Drawing Room, and also his role at the city’s legendary Aviary. Charles also talks about Crafthouse Cocktails, the premium ready-to-serve brand, and his barware label Crafthouse by Fortessa. Interestingly, his love of bar history and vintage barware design not only informs his own designs, it manifests in Telltail Vintage, his Instagram shop. Not one to sit still for long, Charles is also involved in craft ice startup Abstract Ice.
The conversation also touches on spirits categories that appear to be dominating or otherwise seeing a big lift; advice for aspiring career bartenders; and advice for operators who want to succeed in today’s restaurant and bar world.
Spotify link
Apple Podcasts link
Episode 84 with Roberta Mariani
Bar Hacks host David Klemt sits down with Roberta Mariani, Global Brand Ambassador for MARTINI. The two discuss a range of topics, including Roberta’s journey through hospitality, lessons learned working at some of the best hotels in London and opening Bar Tremini in Soho, the guest experience, aperitivo culture, and more. Roberta and David also discuss why now might be the best time to introduce guests to Aperitivo Hour as an alternative to Happy Hour, the Negroni Sbagliato “controversy,” MARTINI’s Non-Alcoholic range, and the cocktails need to put on their menus to bring aperitivo culture into their restaurants, bars, and hotels.
Spotify link
Apple Podcasts link
Episode 81 with Paul Mathew
Paul Mathew, bartender, bar owner, and founder of Everleaf, sits down with Bar Hacks podcast co-host David Klemt. In this fun and informative episode, Paul shares his journey through bartending and bar ownership, and his entry into the drinks business. Non-alcoholic aperitif brand Everleaf is the culmination of Paul’s many years as a conservationist botanist, knowledge of plants, and nearly 30 years in the bar business.
Spotify link
Apple Podcasts link
Episode 59 with Theo Rutherford
Whiskey expert, spirits judge, and sommelier Theo Rutherford stops by the Bar Hacks podcast to talk about Bib & Tucker Small Batch Bourbon, a prominent addition to the Deutsch Family of wine and spirits. Theo shares the Bib & Tucker brand story, what sets the brand apart from other bourbons, and why the 6 Year expression appeals to all categories of whiskey drinkers. He also shares tips for tasting bourbon, including how easily Bib & Tucker wins over non-whiskey drinkers. Listen now to learn why Theo wants you to smell everything and stop swirling your whiskey at tastings.
Spotify link
Apple Podcasts link
Episode 58 with Ivy Mix and Conor McKee
Ivy Mix returns to the Bar Hacks podcast with Conor McKee, a partner in her off-premise endeavor FIASCO Wine and Spirits. Mix, McKee and third partner Piper Kristensen signed FIASCO’s lease a month before the pandemic halted life as we knew it in its tracks. So, they spent the next several months doing demolition and renovation. This conversation highlights the importance of partnering with the right people, even if that means having different partners for different projects; setting aside ego to ask partners who may know more about your new business than you; and leveraging your shared experience to deliver the best service possible to your clientele. If you’ve wondered about taking your on-premise experience to the off-premise space, this is a can’t-miss episode!
Spotify link
Apple Podcasts link
Episode 57 with Collin De Laval
Código 1530 not only has an intriguing story, the brand values authenticity and heritage. Company mixologist Collin De Laval stops by the Bar Hacks podcast to share the Código 1530 story with co-host David Klemt. The two discuss Código’s notable past, handmade approach to their entire production process, innovative products, unique foray into mezcal, shooting high-end spirits, and more.
Spotify link
Apple Podcasts link
Episode 54 with Ivy Mix and Lynnette Marrero
Speed Rack co-founders Ivy Mix and Lynnette Marrero come on the podcast to talk about breast cancer awareness and the role the all-female high-speed bartending competition plays in raising money for breast cancer research. Mix and Marrero also share their thoughts on nurturing work cultures that promote women, creating venues that are safe for female guests and staff, how to approach mentorship, their favorite spirits, and more.
Spotify link
Apple Podcasts link
Episode 52 with Lynn House
Lynn House, national spirits specialist and portfolio mixologist for Heaven Hill, drops by Bar Hacks to speak with host David Klemt about the second annual Old Fashioned Week. Elijah Craig is seeking to raise at least $100,000 for the Restaurant Workers’ Community Foundation, an advocacy and action nonprofit created by and for restaurant workers.
Lynn and David also discuss bourbon, rye, hospitality, building balanced cocktails, and how trust plays a role in educating guests so you and your team can introduce them to new drinks and experiences.
Spotify link
Apple Podcasts link
Episode 50 with Travis Tober
Episode 50! The only way to celebrate such a big milestone is with an incredible guest. We’re excited to bring you Travis Tober of Nickel City and Old Pal. Travis and his partners opened the first Nickel City in Austin in 2017. The Forth Worth location opened its doors during the pandemic in October 2020. Travis then opened Old Pal in Lockhart, TX, just a few months ago.
In our 50th episode, Travis explains the difference between a dive bar and a neighborhood bar, and notes that both Nickel City locations are “anytime bars” that welcome everyone. He also shares his hospitality journey, which saw him go from Buffalo, NY, to Florida, Las Vegas, and ultimately Texas; tips for staying on brand; hiring and retaining team members; how the hospitality industry is the entertainment industry; supporting the community during a crazy winter storm; location scouting; how there’s no better time to open a bar or restaurant than right now; and much more.
Spotify link
Apple Podcasts link
Episode 47 with Tony Abou-Ganim
The legend, the icon, the one and only Tony Abou-Ganim stops by Bar Hacks to chat with co-host David Klemt. The two discuss this year’s Helen David Relief Fund at the USBG Foundation fundraising events, Helen David and the Brass Rail’s legacy, current drink trends, and more.
Spotify link
Apple Podcasts link
Episode 45 with Bob Peters
Revered bar pro Bob Peters swings by the Bar Hacks podcast to chat with co-host David Klemt about a wide array of topics: his love-hate relationship with the words “pivot” and “layered”; lessons learned over more than two decades behind the bar; hiring and training bar staff; how he always seems to have the coolest new bar equipment, including the new Ripples 2.0 and Stündenglass gravity smoker; Bob’s current go-to cocktail, spirit, beer and wine; and so much more. You’ll also learn about Bob’s exciting new endeavor, CocktailClass.com. You don’t want to miss this episode. Strap in—this is a fun one!
Spotify link
Apple Podcasts link
Episode 40 with Trevor Schneider
We’re excited to present episode 40! For the big four-oh we speak with Trevor Schneider, the United States Reyka Vodka brand ambassador. Trevor shares what sets Reyka apart from other vodkas and brands, lessons learned during a career in which he worked at several types of bars throughout New York City, surviving the weeds with the Bartender Ballet, his preferred Espresso Martini recipe, vodka infusions, and more!
Spotify link
Apple Podcasts link
Episode 39 with Anthony “Terry” Bohlinger
Anthony “Terry” Bohlinger, national brand ambassador for new William Grant & Sons whiskey brand Fistful of Bourbon, drops by Bar Hacks. Terry talks with podcast co-host David Klemt about launching a brand during a pandemic, representing an irreverent brand that doesn’t take itself too seriously, the hilarious videos Fistful of Bourbon created to introduce the brand, lessons learned during his journey in hospitality, and more.
Spotify link
Apple Podcasts link
Episode 36 with Jordan Bushell
Global Ambassador and engaging educator for storied brand Hennessy, Jordan Bushell, swings by Bar Hacks to chat with host David Klemt. When he attended a bartending class with a buddy he had no idea it would lead to celebrating three major Hennessy milestones over the course of a decade. The two talk about Master Blender’s Selection No. 4, how to share Cognac knowledge with bar teams and consumers, menu tricks, and much, much more.
Spotify link
Apple Podcasts link
Episode 32 with Michael Toscano
Woodford Reserve brand ambassador Michael Toscano stops by to talk about the Kentucky Derby, crafting the perfect Mint Julep, maximizing the operator-brand-rep relationship, and more.
Spotify link
Apple Podcasts link
Episode 28 with Tim Rita
Lyre’s Spirits crafts alcohol-free spirits that masterfully mimic their full-proof counterparts. Host David Klemt sits down with Lyre’s brand ambassador, bartender and buddy Tim Rita to chat about the brand. In this episode you’ll learn about one of the fastest-growing brands in one of the fastest-growing beverage categories.
Spotify link
Apple Podcasts link
Episode 27 with Armon Noori
It’s tax season and hospitality industry professionals have unique needs. Luckily, we have unique industry friends! Host David Klemt speaks with Armon Noori, an incredible Las Vegas bartender who also has a finance degree and an entrepreneurial spirit. Armon opened a tax preparation and financial services company called Industry Financial Services this with the mission of helping his fellow industry peers.
Spotify link
Apple Podcasts link
Episode 26 with Katie Stryjewski a.k.a. Garnish Girl
The Garnish Girl herself, Katie Stryjewski, dropped by the Bar Hacks podcast to talk with host David Klemt. Katie talks about her new book Cocktails, Mocktails, and Garnishes from the Garden, available today! This book is loaded with delicious recipes along with helpful information to elevate your drinks and grow your own ingredients and garnishes. Katie shares some of her favorite drinks, photography and social media tips, edible flowers, and more!
Spotify link
Apple Podcasts link
Episode 25 with Megan Breier
Happy International Women’s Day! One of our favorite people in the industry—and in life in general—popped by to speak with Bar Hacks host David Klemt. Megan Breier is one of the most engaging, entertaining and knowledgeable educators in the hospitality and spirits industries. In this episode, Megan explains what sets Maker’s Mark apart from other bourbons, some of the amazing activations she’s executed, Private Selection, Maker’s 101, Margie Samuels’ contributions to the brand and industry, and more.
Spotify link
Apple Podcasts link
Episode 20 with Vance Henderson
Host David Klemt kicks back and talks with Vance Henderson, national brand ambassador for Hendrick’s Gin. Before joining William Grant & Sons, Vance tended, managed and operated bars for several years. He proved himself at WG&S with Drambuie and then moved to Monkey Shoulder before taking on his role at Hendrick’s. He shares details of the brand-new Hendrick’s Lunar, his thoughts on branding, his best tips for hiring, and much more.
Spotify link
Apple Podcasts link
Episode 17 with 86 Politicians, part 2
Part two of host David Klemt’s talk with bar operator Yan Agaev and bartender Holly Tripp, founders of 86 Politicians.
Spotify link
Apple Podcasts link
Episode 16 with 86 Politicians, part 1
Part one of host David Klemt’s conversation with bar operator Yan Agaev and bartender Holly Tripp. Yan, fed up with how elected officials have continually damaged the hospitality industry throughout the Covid-19 pandemic, posted a video shot and edited by Holly that spread across social media like wildfire. The duo founded 86 Politicians, a peaceful grassroots movement intended to hold politicians accountable for the harm they’ve caused the industry and their inaction on targeted financial relief.
Spotify link
Apple Podcasts link
Episode 14 with Joann Spiegel
In this episode, host David Klemt speaks with Joann Spiegel to dive deep into the global phenomenon that is Miracle, the annual Christmas-themed cocktail pop-up event. Back in 2014, nobody predicted how successful or expansive this event would become. Miracle has transformed into a juggernaut that involves months of careful planning, cocktail creation, logistics, partner liaisons, and much more behind-the-scenes preparation. The end result is a profitable and memorable pop-up that runs for 35 to 40 days.
Spotify link
Apple Podcasts link
Episode 12 with Jared Boller
The new host of the Bar Hacks podcast chats with Jared Boller, Canadian National Whiskey Ambassador at Proximo Spirits. Tending bar gave him the opportunity to live, work and travel around the world. Currently, he represents brands like Bushmills and Proper No. Twelve at Proximo Spirits in Canada. Jared discusses his journey through the world of hospitality and how operators can benefit more from working with brand ambassadors.
Spotify link
Apple Podcasts link
Cheers to the bartenders across the world!
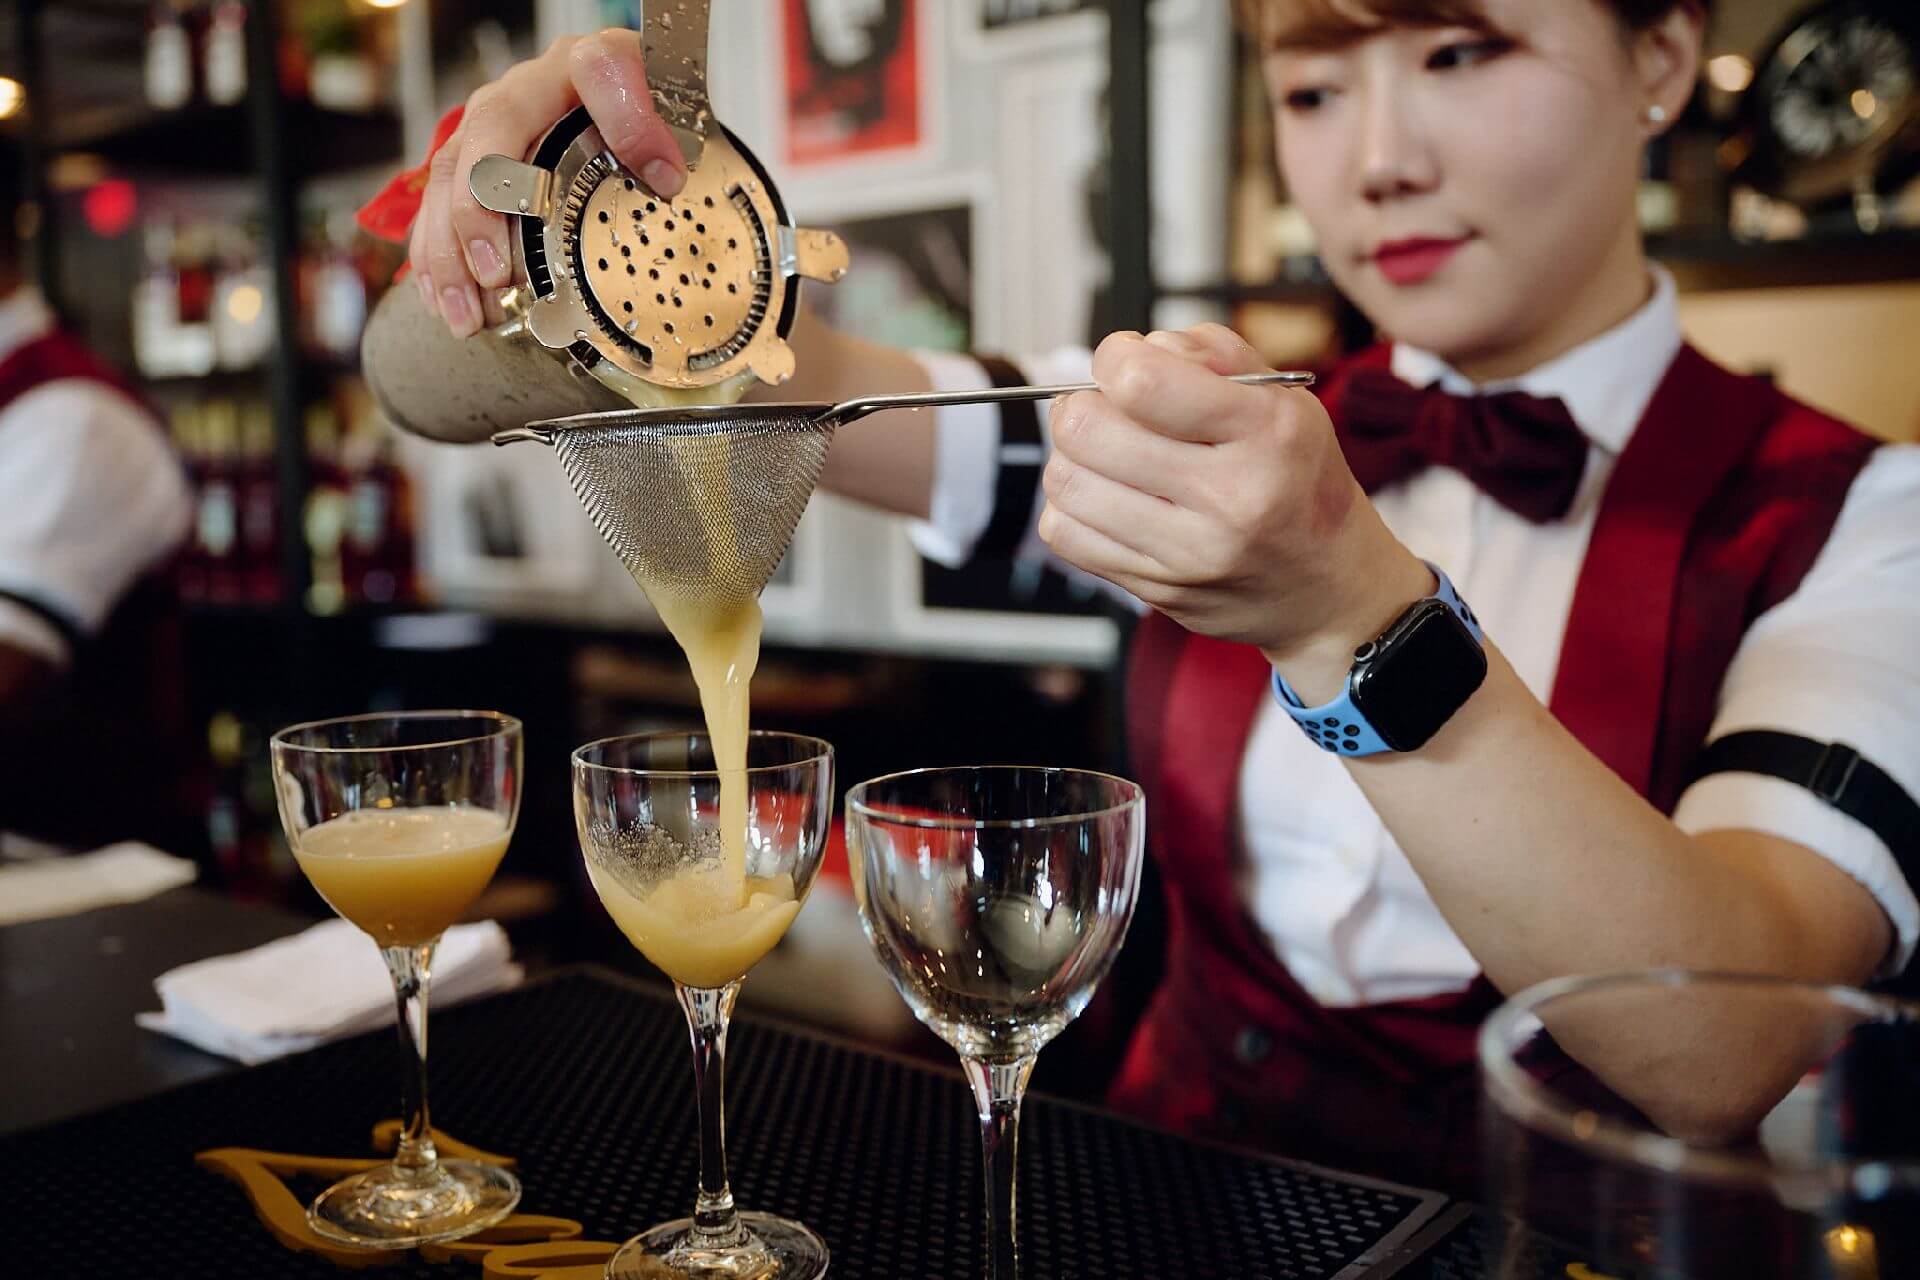
Image: Los Muertos Crew on Pexels