Dynamic Pricing or Dynamic Menus?
by Doug Radkey

A key phrase used throughout 2022 was “the new normal.” In 2023, a key term you will likely hear a lot is “dynamic pricing.”
What is dynamic pricing? It can get quite complex, but the global consulting company, McKinsey, defines dynamic pricing as “the (fully or partially) automated adjustment of prices.”
The term is not entirely new to hospitality. Hotels and the overall travel industry have used modules of the pricing model for years. But for restaurants and even bars, yes, it is something new.
It is also a model getting a lot of attention of late, which begs the following question: Why?
As the bar and restaurant industry recovers from the effects of the pandemic, a dynamic pricing model that optimizes revenue opportunities may seem quite attractive. After all, our industry is looking to rejuvenate its sales to pre-pandemic levels.
Essentially, a dynamic pricing model within this industry would work like this: increase prices when demand is up (peak periods), decrease prices to draw guests in when demand is down (off-peak times).
But should this be a model that disrupts the industry in 2023 and into 2024?
While I am all for a little disruption, the industry needs to tread carefully through this potential transition to dynamic pricing (or perhaps just around the phrase itself) that’s based on demand levels.
Guest Experiences
We all know (or should know) that we do not sell a product. What we sell is an experience.
If we can create a positive, memorable guest experience first and foremost, the revenue will follow.
While hotels and travel, as examples, have boasted “positive financial results” over the years through their different approaches to dynamic pricing (while still trying to focus on the end-user guest experience), independent bar and restaurant brands must be careful not to create a hostile brand perception.
Why? Because many consumers view changing prices based solely on levels of demand as being unfair.
Being unfair will certainly create a negative guest experience and/or brand perception. The hotel and airline industries have been able to navigate this perception successfully by offering alternatives. For example, different rooms and amenities or less convenient flight times at different price points. Essentially, companies in lodging and travel provide options and flexibility before customers make the choice to spend.
What about rideshare and surge pricing as another example? Many of you reading this have likely been burned by surge pricing as a consumer, which can be by definition a form of dynamic pricing.
Have you ever tried to book a rideshare during peak periods in a major market? What would normally be a $20 ride is suddenly $40 to $60 (or more) because of their dynamic pricing model.
What did I do in this situation during a recent business trip? I walked another 25 feet up to the cab staging area of the airport and got my ride for $25.
The end results? I had a negative customer experience with the rideshare company, first and foremost. Additionally, that negative experience drove me to the competition. The key here is I was given a choice.
Now let’s switch that scenario to a restaurant.
The Restaurant Scenario
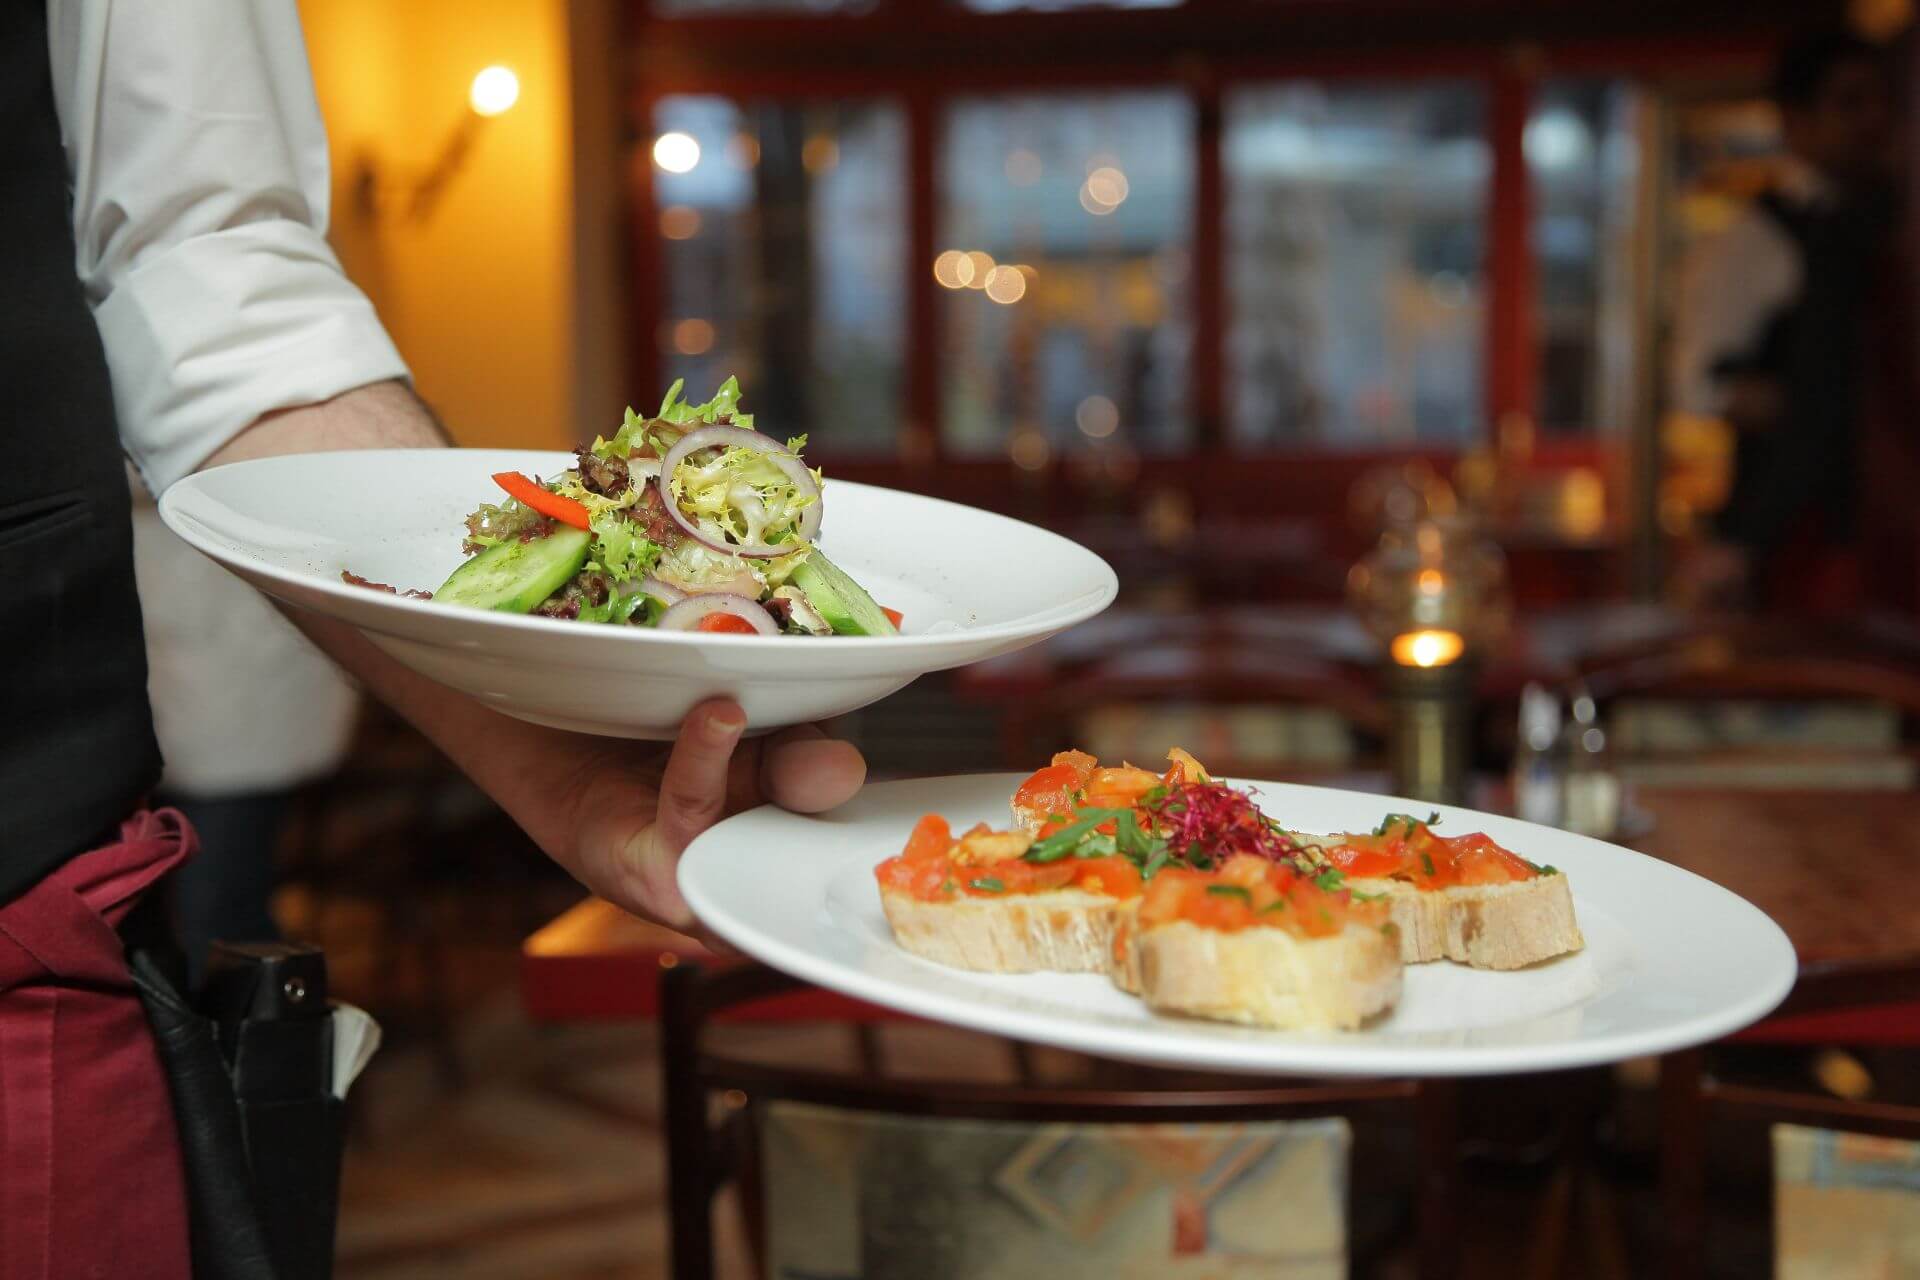
You book a table at your favorite restaurant and order that incredible steak dinner you always enjoy. But instead of it being $50 like you have grown accustomed to, it is now $75 or more. How are you as a consumer going to feel about this new price just because you visited your favorite spot during a “peak period” on a Saturday night? Were you given a choice before the spend?
Of course, this can work in the opposite direction: ordering a meal during a non-peak time and getting it for a cheaper price, thereby getting a discount.
But should we be confusing our customers based on their chosen, convenient time to visit your restaurant or bar? Should you also focus on “discounting” to drive people to your business?
I have even seen recommendations for offering an increased price for peak period but using what was the previous regular price during the non-peak times, labeling the normal price a “discount.”
Should we be framing our regular priced menu options as a discount just so we can charge and make more during a peak period? Is this being fair and ethical to your loyal customers? Should we be going down this road?
With this model (and the phrase “dynamic pricing”), which is based on demand, it is very easy to see how you can quickly confuse or alienate your loyal guests. Unless the industry in its entirety migrates over to this demand-driven model, a similar scenario as outlined above can play out for you and your guests.
Without extremely strong but transparent communication systems in place (which will be a challenge in itself), it is safe to assume that they will likely visit another restaurant up the street and/or provide negative feedback because they feel your pricing model is confusing or unfair.
Dynamic Menus
The phrase that is much more simplified and will be more easily embraced by both operators and guests is “dynamic menu.”
So, what’s the difference?
While it is still by definition “the (fully or partially) automated adjustment of prices,” it is not based on demand throughout the day. Rather, pricing is based on simple supply chain and operational cost adjustments.
According to the National Restaurant Association:
- 95 percent of restaurants have recently had significant supply delays or shortages of key food items; and
- 75 percent of restaurants have had to change their menu because of supply chain issues.
With a more dynamic menu, you can adjust pricing to suit those changes accordingly, through the lens of real-time ingredient cost, labor costs, productivity levels, and even the availability of certain menu items.
This simply means that the incredible steak dinner a guest has always enjoyed at your place is perhaps now $53 instead of $50 because the price of beef went up the past week or month. This ensures that as an operator, you will have a minimal gap between your theoretical and actual food costs.
Again, this should work both ways, meaning if the price of beef has gone down, so too should the price.
This means that your guests are paying an accurate value for each item, based on your intended sales mix and contributions, without a loss in margin on your end or negative experience on the guest end.
This means that everything on your menu is “market price” or MP. Where have we seen that before…?
Market Price
We all know restaurant menus will commonly deduct a price and replace it with the term “market price” (often abbreviated to “MP”). This means the price of the menu item depends on the market price of the ingredients, and the price is available upon request. It has been used for years for seafood in particular—most notably lobsters and oysters—in many restaurants.
Therefore, this pricing model is not entirely new. So, why should it stop at just high-priced seafood?
The reason many operators would use the abbreviated MP was because they did not want to reprint menus every single day as the prices fluctuated greatly.
As we move towards digitally savvy restaurant operations, implementing integrated technology and menus, we can begin to find alternatives and ensure that we are actively pricing our menus accordingly based on the market (and overhead costs) to strengthen top- and bottom-line results.
Knowledge is Power
To make a dynamic menu work, whether you’re a QSR, sports bar, casual-dining or fine-dining concept, or any other category of bar or restaurant, you need to know your target customers, provide a targeted menu, and know your numbers (the data).
Curating and engineering a menu should be a simplified process. To be honest, this should have been streamlined prior to the pandemic.
Your menu should be developed based on data, consumer sentiment, regional ingredients, regional suppliers, and local talent within the confines of the overall concept. Food and beverage programs should be developed with thought, care, speed, precision, execution, and last-but-not-least: consistent profits in mind.
Keeping menus “small” (10 to 12 or even 15 items at maximum) will be the new threshold of a successful, more profitable operation. This size of menu will allow bars and kitchens to operate more efficiently; keep inventory costs both low and controlled; control training and labor costs; and provide guests with the most flavorful and exciting items that they truly want.
Be Nimble
You also want to provide menu flexibility by continually reviewing your supply chain. Maintaining a strong personal relationship with your suppliers is imperative. You must also review your costs and inventory on a daily and weekly basis to make dynamic menus work.
To keep inventory, purchase orders, and potential waste to a minimum, it will be crucial that you to ensure your menu is small but innovative. The only way to accomplish this is through effective data management.
However, the new challenge for many independent brands is making data timely, relevant, digestible, and actionable for operators and their leadership teams. The ability to collect, interpret, and effectively react to key datapoints is going to be crucial for anyone who wants to implement a dynamic menu, and for moving forward in general.
At the end of the day, profiting from a dynamic menu is all about making decisions based on accurate cost and productivity data. Of course, there’s only one way to obtain data: embrace technology and create strategic clarity around it.
The Tech Stack
The key to successfully implementing a dynamic menu is integrating a stack of technology that provides real-time data and trend reports.
From point-of-sale software and reports to accounting software, inventory and recipe management software, and invoice management software or a suite that includes all of the above that’s integrated and working together, you can obtain real-time data to adjust your pricing based on real-time ingredient and productivity costs on a daily or weekly basis.
You want seamless movement of data from front- to back-of-house that will position you to make decisions and have a more complete picture of inventory stock levels, costs, and ordering needs, plus itemized sales, contribution margins, and productivity levels.
In Summary
While we must find ways to be innovative, potentially price-gouging our guests during peak periods and discounting during slow periods is not the way for this industry to recuperate and build loyal customers.
Building a strong brand through the creation of memorable experiences and by building connection with your community along with strategic planning, effective marketing, the elements of culture, and efficient operations, you can build sustainable revenue and profit channels.
By following a more dynamic menu approach within your operations, you can still maintain transparency with your guests with less challenging communication methods, remain a fair and well-respected brand within your community, and improve your margins by three to five percent or more with the right people and systems in place.
That sounds like a pretty good deal to me. The question here remains: Are you Team Dynamic Pricing or Team Dynamic Menus?
Image: Joe Neric on Unsplash


