Data

by David Klemt David Klemt No Comments

Wallethub Ranks the Best Foodie Cities in the US

Comparing 182 cities across more than two dozen “food-friendliness” indicators, Wallethub has revealed their rankings for America’s best foodie cities in 2023.

Why 182 cities? Wallethub started with 150 of America’s most-populous cities. Then, they added “at least two” of the most-populous cities in each state.

Regarding the ranking itself, Wallethub compared the cities against two key measures: affordability, and diversity, accessibility, and quality. Those two measures consist of 28 key indicators, including:

  • cost of groceries;
  • restaurant meal cost;
  • sales tax;
  • food tax;
  • restaurants per capita;
  • ratio of full-service to fast-food restaurants; and
  • restaurant diversity.

Using a 100-point grading system, affordability was worth up to 30 points. Simple math shows diversity, accessibility, and quality indicators were worth up to 70 points.

Further, Wallethub valued indicators anywhere from half-weight (international grocery stores per capita) to triple weight (restaurants per capita).

Now, it’s important to contextualize Wallethub’s use of the word “foodie city” here. For their ranking, the company is identifying “the best and cheapest” cities for consumers for whom eating is an experience, hobby, and/or lifestyle.

“These wallet-friendly cities cater to diners who prefer to cook at home, explore the local flavors or both,” reads their post, which can be reviewed in its entirety here.

by David Klemt

Eola Lake Park in Orlando, Florida

The Top 25

So, per Wallethub, the cities below are the top 25 among the 182 “best foodie cities in America in 2023.”

  1. Orlando, Florida
  2. Portland, Orgeon
  3. Sacramento, California
  4. Miami, Florida
  5. San Francisco, California
  6. Tampa, Florida
  7. San Diego, California
  8. Las Vegas, Nevada
  9. Austin, Texas
  10. Seattle, Washington
  11. Denver, Colorado
  12. Atlanta, Georgia
  13. Los Angeles, California
  14. Chicago, Illinois
  15. Richmond, Virginia
  16. Pittsburgh, Pennsylvania
  17. Washington, DC
  18. St. Louis, Missouri
  19. Houston, Texas
  20. New York, New York
  21. Oakland, California
  22. Phoenix, Arizona
  23. Santa Ana, California
  24. Grand Rapids, Michigan
  25. Cincinnati, Ohio

Interestingly, you’ll find the “usual” foodie scene suspects on this list. However, a mere handful of those cities are ranked in the top ten: Miami, San Francisco, and Las Vegas.

Chicago (14), Los Angeles (13), and New York (20) don’t make the three or five. In fact, they’re out of the top ten entirely here.

If affordability is a major factor here, it raises an eyebrow that Miami is among the top five foodie cities. After all, sources show the cost of living in the city is 20 percent higher than the national average. The cost of living in San Francisco is nearly 80 percent higher.

At any rate, Orlando, per Wallethub’s methodology, is the number-one foodie city in America.

Compelling Comparisons

With the top 25 foodie cities out of the way, let’s check out a few other interesting comparisons.

Cost of Groceries

Lowest-cost cities, in descending order:

  1. Brownsville, Texas
  2. Corpus Christi, Texas
  3. Laredo, Texas
  4. Fayetteville, North Carolina
  5. Austin, Texas

The cities with the highest cost of groceries are Honolulu and Pearl City in Hawaii.

Restaurants per Capita

The cities with the most restaurants per capita, again in descending order:

  1. Miami, Florida
  2. Orlando, Florida
  3. Las Vegas, Nevada
  4. San Francisco, California
  5. Los Angeles, California

It’s important to note each of the cities on this list is, per Wallethub, tied for first place.

The city with the fewest restaurants per capita is Pearl City, Hawaii.

Ratio, FSR to Fast Food Restaurants

On this list, the five cities with the highest ratio of full-service restaurants to their fast-food counterparts (yes, in descending order):

  1. Cape Coral, Florida
  2. Santa Rosa, California
  3. Portland, Maine
  4. Burlington and South Burlington, Vermont

That leaves the city with the lowest ration, which is Jackson, Mississippi.

The Bottom Ten

Now that we know which cities Wallethub identifies the best foodie cities in the US, let’s take a look at the bottom of their list.

  1. Augusta, Georgia
  2. Fontana, California
  3. Jackson, Mississippi
  4. Moreno Valley, California
  5. Mobile, Alabama
  6. Montgomery, Alabama
  7. West Valley City, Utah
  8. Nampa, Idaho
  9. Shreveport, Louisiana
  10. Pearl City, Hawaii

Personally, I find the data regarding restaurants per capita and the FSR to fast-food ratio the most useful.

To review this report in its entirety, including Wallethub’s methodology, please click here.

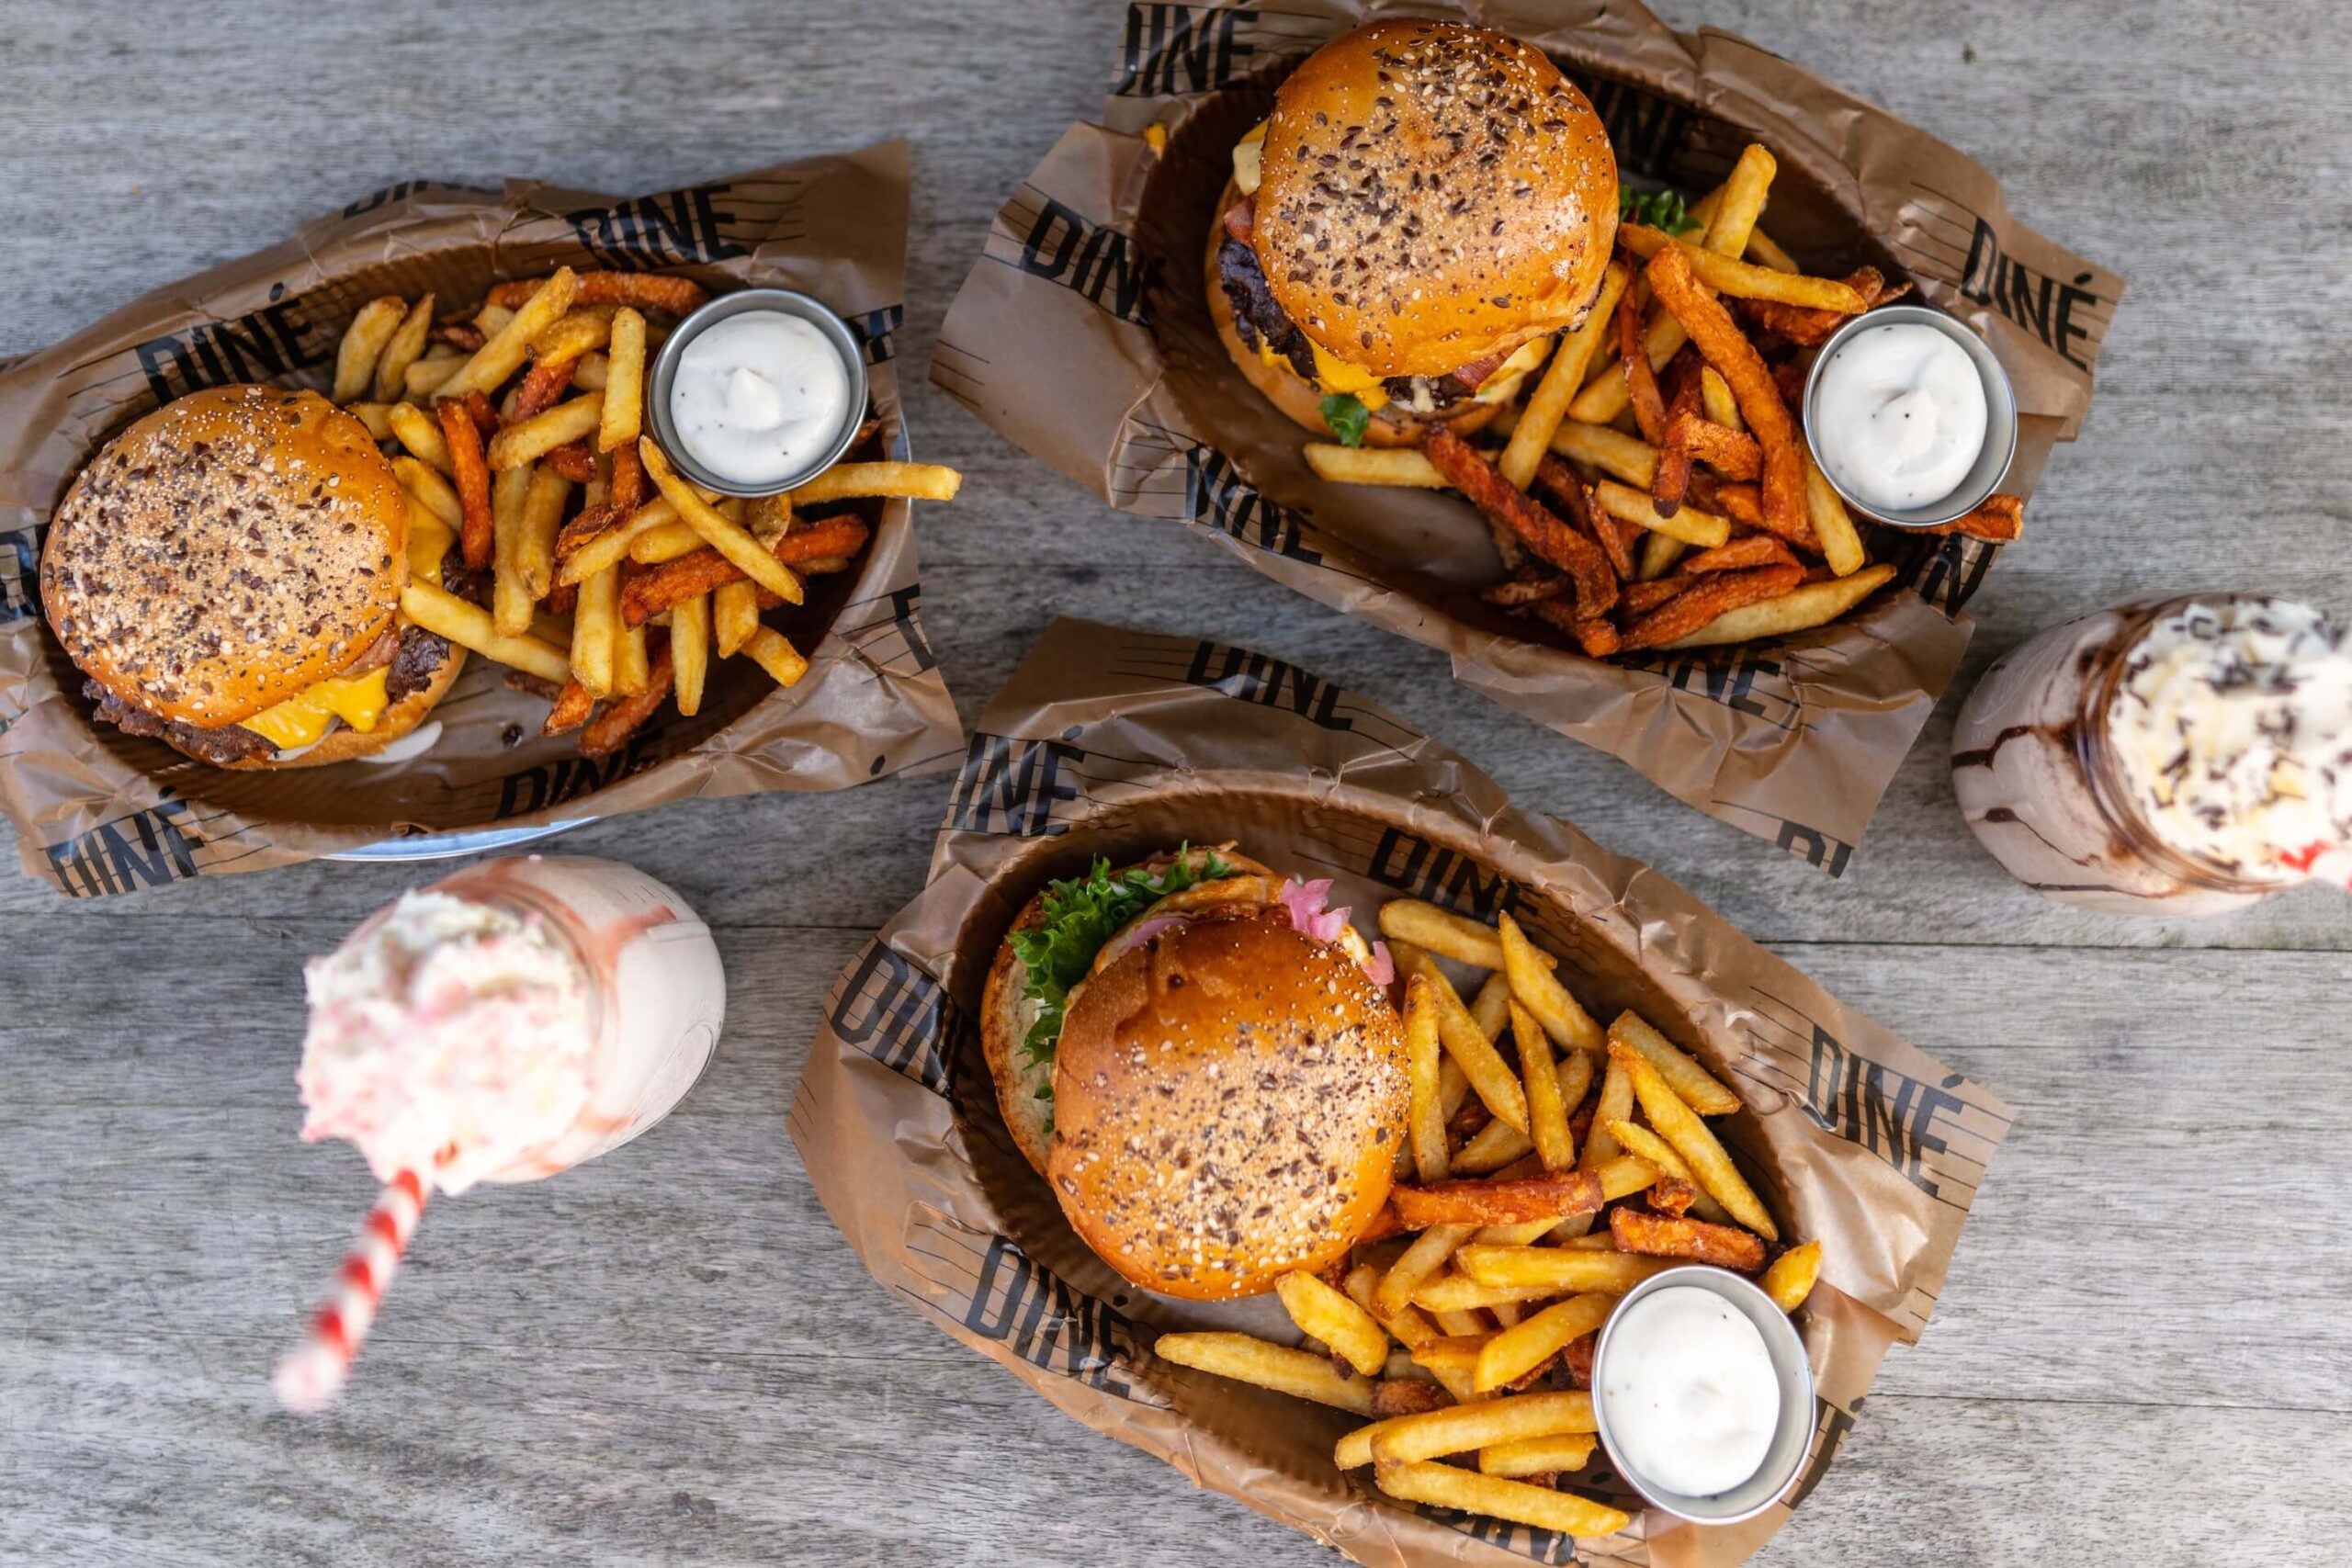
Image: Mick Haupt on Unsplash

Related Reading

Work with Us

Click the image below to work with us on starting, stabilizing, or scaling your hospitality concept.

Client Intake Form - KRG Hospitality

by David Klemt David Klemt No Comments

US Restaurant Employment Still Short

US Restaurant Employment Creeping Toward February 2020 Levels

by David Klemt

Restaurant door handle that says "push"

Keep pushing. We have work to do to reach February 2020 employment levels.

After what appeared to be a strong September 2023, restaurants and bars saw a decline of 7,500 jobs in the month of October.

In fact, the strong numbers from September were notably weaker once revised. After revisions, eating and drinking businesses added 48,300 jobs, not the nearly 61,000 from preliminary reports.

Importantly, a correction in employment numbers for August 2023 has revealed further declines. Initially, reports stated that restaurants had added 14,400 jobs. Unfortunately, the corrected number showed that restaurants shed 9,300 positions.

However, context is important. Notably, the unemployment rate in the US has remained under four percent for nearly 24 months. As of the latest reporting by the US Bureau of Labor Statistics, unemployment is at 3.9 percent.

Numbers by Restaurant Category

The data in this subsection comes from the National Restaurant Association. As the NRA notes, this information is based on data from September 2023.

These numbers should provide further context for restaurant and bar’s current situation. Some restaurant categories are struggling more than others to reach or surpass pre-pandemic levels of employment.

Below, employments numbers for September 2023 in comparison to February 2020.

  • Full-service: -214,000 jobs
  • Quick-service and Fast Casual: +128,000 jobs
  • Bars and Taverns: +50,000 jobs
  • Cafeterias and Buffets: -36,600 jobs
  • Catering and Mobile Food Service: +14,900
  • Snack and Non-alcohol Beverage Bars: +107,000 jobs
  • Foodservice Contractors: +15,100 jobs

As you can see, full-service restaurants are struggling the most to reach pre-pandemic employment numbers. However, QSRs and bars have surpassed that milestone.

By the Numbers

Below, the change in employment in each state and Washington, DC. The time period the data span runs from September 2019 to September 2023*.

  • Alabama: -5,700 (-3.4%)
  • Alaska: +100 (+0.4%)
  • Arizona: +18,200 (+7.6%)
  • Arkansas: +7,900 (+8.1%)
  • California: +32,700 (+2.2%)
  • Colorado: +9,100 (+3.8%)
  • Connecticut: -1,200 (-1.0%)
  • Delaware: +2,500 (+6.4%)
  • District of Columbia: -2,500 (-4.5%)
  • Florida: +35,200 (+4.4%)
  • Georgia: +21,800 (+5.5%)
  • Hawaii: -4,900 (-6.9%)
  • Idaho: +7,000 (+11.5%)
  • Illinois: -11,000 (-2.3%)
  • Indiana: +7,900 (+3.2%)
  • Iowa: -200 (-0.2%)
  • Kansas: +4,800 (+4.7%)
  • Kentucky: -400 (-0.2%)
  • Louisiana: -9,000 (-5.2%)
  • Maine: -4,000 (-7.9%)
  • Maryland: -16,700 (-8.0%)
  • Massachusetts: -15,600 (-5.6%)
  • Michigan: -21,400 (-6.3%)
  • Minnesota: -9,000 (-5.2%)
  • Mississippi: -1,700 (-1.7%)
  • Missouri: -3,500 (-1.5%)
  • Montana: +4,500 (+10.7%)
  • Nebraska: +600 (+0.8%)
  • Nevada: +22,300 (+16.7%)
  • New Hampshire: -1,500 (-2.9%)
  • New Jersey: +7,400 (+2.7%)
  • New Mexico: +3,100 (+4.2%)
  • New York: -10,000 (-1.4%)
  • North Carolina: +12,900 (+3.3%)
  • North Dakota: -100 (-0.3%)
  • Ohio: -6,300 (-1.4%)
  • Oklahoma: +3,600 (+2.5%)
  • Oregon: -2,000 (-1.2%)
  • Pennsylvania: -5,600 (-1.3%)
  • Rhode Island: -2,000 (-4.3%)
  • South Carolina: +1,000 (+0.5%)
  • South Dakota: +3,100 (+9.4%)
  • Tennessee: +8,000 (+3.0%)
  • Texas: +74,200 (+6.6%)
  • Utah: +12,900 (+12.0%)
  • Vermont: -1,000 (-4.7%)
  • Virginia: -100 (-0.0%)
  • Washington: +3,900 (+1.5%)
  • West Virginia: -2,600 (-4.6%)
  • Wisconsin: -8,100 (-3.8%)
  • Wyoming: -100 (-0.5%)

Ups and Downs

First, the less-positive news: restaurant employment is below pre-pandemic levels in more than half of the country. Including Washington, DC, 27 states are still lagging behind September 2019.

However, in some cases the change is negligible.

For example, Wyoming is down just 0.5 percent, and Virginia is down just 100 jobs or 0.00033 percent. Of the 27 states seeing declines, 20 are down less than five percent in comparison to September 2019.

Of course, it’s important to note that Hawaii, Michigan, and Massachusetts are down more than five percent.

So, to the good news. Two dozen states are enjoying restaurant and bar employment above September 2019 levels.

Four states are up more than ten percent. Nevada is leading the way, up 16.7 percent. Next is Utah, up 12 percent. Following in third is Idaho, up 11.5 percent.

Takeaways

Restaurant employment’s pre-pandemic peak was in February 2020. As of the most-current data, we’re down 14,000 jobs.

According to the most recent data, restaurants and bars employ 12.32 million people in the US. While we have yet to reach the 12.34 million that were employed in February 2020, we’re not far off. We still have reason to be positive about recovery.

The larger threat looming over operators is rising costs. Additionally, depending on the source, a recession is either a possible or current threat.

Of course, there’s still increasing demand from consumers to gather at restaurants and bars. So, again, there’s reason to remain positive.

This is all to say that numbers without deeper understanding and nuance only provide surface context. They can make us panic or breathe a sigh of relief, seemingly at the drop of a hat. We can either worry that we haven’t reached the pre-pandemic milestone, be positive that we’ll reach that number in the near future, or decide that perhaps that metric shouldn’t be the primary one by which we measure recovery.

In short, operators positioning themselves for long-term success understand their market, their teams, and their guests; focus on staff and guest retention; develop community engagement and support; and have strategic clarity.

*Sources: US Bureau of Labor Statistics, National Restaurant Association

Image: Tim Mossholder on Unsplash

Bar Nightclub Pub Brewery Winery Staff Talent Consulting

by David Klemt David Klemt No Comments

2023 DoorDash Ordering Trends

2023 DoorDash Ordering Trends: Canada & US

by David Klemt

Canada and the United States of America on a globe

After checking out this year’s annual Cravings Report we’re turning our attention to the 2023 DoorDash restaurant ordering trends reports.

Luckily, there are two reports available from DoorDash: one that focuses on Canada, and one for the US.

These two countries are, of course, KRG Hospitality’s primary markets. So, the data in these DoorDash reports is relevant and compelling for our current and future clients.

Perhaps unsurprisingly, Canadian and American DoorDash users are somewhat similar by a few metrics. However, where there are differences they’re fairly glaring.

For example, 78 percent of Canadian DoorDash survey respondents picked up a takeout order from a restaurant in the month prior to being surveyed. That number is 76 percent for American survey respondents.

Regarding in-person restaurant dining, 62 percent of respondents had done so the month prior. Among American survey respondents that number is 61 percent.

But when it comes to placing an order for delivery we see a notable difference. For Canada, 58 percent of survey respondents had ordered delivery. That number jumps to 77 percent among Americans.

This tells me a few (fairly obvious) things. Generally speaking, it appears consumers in Canada and America—according to DoorDash—prefer delivery and takeout to in-person dining. Going further, it seems that overall, Canadians prefer pickup or takeout to delivery. However, Americans seem to place delivery and pickup orders at nearly identical rates.

If it’s true that consumers favor delivery or takeout to in-person dining currently, there could be a couple of simple reasons. First, convenience.

Second, fees. It’s possible that today’s consumer perceives delivery fees are lower than in-person dining fees, unfortunately. If that’s the case, third-party delivery services can exploit this perception.

More Similar than Different

In comparing both DoorDash reports, I find that Canadian and American consumers who use DoorDash are rather similar.

Survey respondents in both countries indicate that Friday is the most popular day of the week to order food. Further, 6:00 PM is the most common local time to place orders in both countries.

And when it comes to the fastest-growing dayparts for order placement? In both Canada and the US it’s late-night and breakfast. Although, I most note that both dayparts are growing faster in Canada.

Nearly half of American respondents and a little over half of Canadian respondents indicate they want to try new restaurants and dishes.

Definitely not surprisingly, consumers in both countries primarily focus on menu selection and pricing when seeking a new restaurant to try. In fact, these numbers are identical for Canadians and Americans, at 55 percent and 51 percent, respectively.

Top Canadian Food Orders

When we look at the top items ordered via DoorDash, we don’t find anything out of the ordinary.

  1. Burgers
  2. Fries
  3. Pizza
  4. Salad
  5. Sandwiches

Looks like standard fare and comfort foods to me. This tells me that operators who have these items on their menus need to ensure they’re of the highest quality to stand out from other restaurants and bars.

Top American Food Orders

Interestingly but not too surprisingly, the list below is quite similar to the list above.

  1. French fries
  2. Burgers
  3. Tacos
  4. Salad
  5. Pizza

With the exception of tacos and sandwiches, the list is nearly identical.

Hey, who wants to debate whether tacos and sandwiches are in the same food family?

I encourage you to review both reports in their entirety for yourself. For the Canadian Edition of DoorDash’s report, click here. And click here for the US edition.

Image: Lara Jameson on Pexels

Bar Pub Brewery Nightclub Club Nightlife Technology Plan Tech Stack

by David Klemt David Klemt No Comments

2023 Cravings Report: “The Most” Orders

2023 Uber Eats Cravings Report: “The Most…” Orders

by David Klemt

Kentucky Fried Chicken packaged for delivery or pickup

Let’s take a look at the top orders, delivery requests, order combinations, surprising pairings, and more from the 2023 Uber Eats Cravings Report.

It appears that the chicken sandwich dominance we’ve seen over the years is winding down. At least, that seems to be the case among Uber Eats users.

As you’ll see below, not only is the chicken sandwich not the most popular item, it’s not even among the top five. It does edge out the cheeseburger and wings among the most popular combos, but it doesn’t outperform French fries and salt as a combo.

Another eyebrow-raising detail? Pizza doesn’t show up anywhere among the most ordered items, most popular combos, or even the most surprising combos.

Now, if you’re curious about the 2022 Uber Eats Cravings Report, you’re in luck. You can click here for the top food orders from that report, and here for the top beverage orders.

The Most…Ordered Items

  • French fries
  • Garlic naan
  • Pad Thai
  • Miso soup
  • California roll

Am I the only one who expected to see burgers, chicken sandwiches, and pizza on this list?

The Most…Popular Combos

  1. Burrito bowl + cheese
  2. French fries + salt
  3. Chicken sandwich + shredded lettuce
  4. Cheeseburger + mustard
  5. Wings + ranch

Fairly standard, really. Every one of these orders makes complete sense. Now, the category coming up next…it’s a different story.

However, before we move on, let’s compare these items to those found on the 2022 Uber Eats Cravings Report.

Interestingly, the number-one item is nearly identical: burrito + cheese. And French fries + salt is the second most-popular item on both lists.

The Most…Surprising Combos

  1. Steak + jelly
  2. Cottage cheese + mustard
  3. Condensed milk + avocado
  4. Seaweed + pasta sauce
  5. Butter + pickled onions

I really have nothing to say after reviewing this short list. I mean…hey, do your thing, everyone. Make your order yours.

To the operators out there, be ready for some odd order combos.

The Most…Popular Requests

  1. No onions
  2. Dressing on the side
  3. Ranch
  4. Extra soy sauce
  5. Spicy
  6. Sauce on the side
  7. No lettuce
  8. No jalapenos
  9. Extra gravy
  10. No slaw

Looking at the top request, Uber Eats has a theory as to what’s driving it: the return to the office.

People, it appears, are self-conscious about their breath in an in-person, face-to-face setting.

The Most…Popular Food and Alcohol Combos

  1. Ribeye + Vodka
  2. Cheeseburger + Frozen Margarita
  3. Chicken + Frozen Piña Colada
  4. Lobster tail + Apple whiskey
  5. Tamales + Daiquiris

Last year’s report reveals the following combos:

  1. Steak + Margaritas
  2. Pizza + White Claw
  3. Burritos + Margaritas
  4. Chicken + Sangria
  5. Wings + Beer

Overall, a lot of change from the 2022 Cravings Report to this year’s report.

Image: Nik on Unsplash

Bar Nightclub Pub Brewery Menu Development Drinks Food

by David Klemt David Klemt No Comments

Brand Love: BrandVue’s 2023 Rankings

Brand Love: BrandVue’s 2023 Rankings

by David Klemt

Black and white image of a winners' podium under a spotlight

As we near the end of the year, Savanta has revealed their BrandVue’s Most Loved Eating Out Brands 2023 report, ranking 100 restaurant brands in America.

The B2B and B2C market consultancy has been publishing this report since 2019. Their fifth-annual report includes 16 categories, including ranking consumer opinion of third-party delivery services.

As a category, Burger boasts the greatest presence with 17 loved restaurant brands. In second is Italian or Pizza with 13 brands. With ten brands, Specialty comes in third as a category. Tied for fourth are Mexican and Chicken, featuring eight brands each.

Download the full report here.

Top Restaurant in Each Category

Below you’ll find the gold medalist in each category, in alphabetical order by restaurant type.

  • Asian: Panda Express
  • Burger: McDonald’s
  • Café or Bakery: Starbucks
  • Chicken: Chick-fil-A
  • Family Style: Cracker Barrel Old Country Store
  • Frozen Dessert: Cold Stone Creamery
  • Italian or Pizza: Olive Garden
  • Mexican: Taco Bell
  • Sandwich: Subway
  • Seafood: Red Lobster
  • Specialty: Krispy Kreme
  • Steak: Texas Roadhouse
  • Varied Menu: The Cheesecake Factory

Other Categories

There are a handful of other categories on the BrandVue list. Namely, Delivery, Sports Bar, and Meal-kit.

I’ve separated Delivery in particular because it doesn’t represent brick-and-mortar brands. Rather, these are third-party services.

For this year’s list, Savanta ranks five delivery services. Below, the top three:

  1. Caviar
  2. DoorDash
  3. UberEats

However, it’s important to note that DoorDash bought their one-time rival Caviar back in 2019. So, it’s really as though DoorDash claims two spots among the top three.

Of course, UberEats owns Postmates, which is among the five Delivery brands on this list. So is Seamless, owned by Grubhub. However, Grubhub itself doesn’t appear on this list.

The other two categories, Sports Bar and Meal-kit, count just one brand each among them: Buffalo Wild Wings and Plated, respectively.

Top 26 Restaurant Brands

Below, the top quarter of the 2023 BrandVue list. As you’ll see, the gold medalists among the top 25 are in bold.

Why did I decide to show the top 26 rather than the top 25? My reasoning is simple: one of the top 25 is a delivery service, not a brick-and-mortar restaurant.

  1. Domino’s (Italian or Pizza)
  2. Red Lobster (Seafood)
  3. Cold Stone Creamery (Frozen Dessert)
  4. Culver’s (Burger)
  5. Caviar (Delivery)
  6. Cinnabon (Specialty)
  7. Braum’s (Burger)
  8. Auntie Anne’s (Specialty)
  9. Wingstop (Chicken)
  10. Popeyes (Chicken)
  11. Wendy’s (Burger)
  12. Pizza Ranch (Italian or Pizza)
  13. Pizza Hut (Italian or Pizza)
  14. KFC (Chicken)
  15. The Cheesecake Factory (Varied Menu)
  16. Subway (Sandwich)
  17. In-N-Out Burger (Burger)
  18. Dunkin’ Donuts (Café or Bakery)
  19. Taco Bell (Mexican)
  20. Raising Cane’s (Chicken)
  21. Olive Garden (Italian or Pizza)
  22. Krispy Kreme (Specialty)
  23. Texas Roadhouse (Steak)
  24. McDonald’s (Burger)
  25. Starbucks (Café or Bakery)
  26. Chick-fil-A (Chicken)

Unsurprisingly, the top six spots go to gold medalists. In total, gold medalists claim seven slots amongst the top ten. Twelve of the top performers out of all 16 categories are in the top 25.

Interestingly, the list also puts America’s love for burgers, chicken, and pizza on full display. Of the top 25 most-beloved restaurant brands, five fall into the Burger category, and five fall into Chicken. Four slots belong to the Italian or Pizza category.

Notably, there are no Asian or Family Style restaurants among the top 26. However, I expect more Asian and Mexican restaurants to earn places in the top quarter over the next few years.

To see the full list of the 100 most-beloved restaurant (and delivery) brands in the US, click here.

Image: Joshua Golde on Unsplash

KRG Hospitality. Restaurant Business Plan. Feasibility Study. Concept. Branding. Consultant. Start-Up.

by David Klemt David Klemt No Comments

Leisure and Hospitality Adds 96,000 Jobs

Leisure and Hospitality Adds 96,000 Jobs

by David Klemt

"Optimist" graffiti

Update: The figure of 61,000 restaurant and bar jobs was adjusted to 48,300 after revisions.

The latest report from the US Bureau of Labor Statistics reveals that the outlook looks promising for hospitality.

Put together, leisure and hospitality added 96,000 jobs in September. However, hospitality certainly leads the way according to the most recent report.

In particular, the news is wonderful for the restaurant and bar sector. Adding 61,000 jobs in September, “food services and drinking places” are back to February 2020 levels.

Put more simply, restaurants and bars are back to pre-pandemic employment numbers. It has taken more than three years, but we can finally breathe a collective (but cautious) sign of relief.

In fact, one in five jobs created in September was in a restaurant or bar. That’s incredible growth and welcome news.

But reaching this point hasn’t been easy. Operators, along with restaurant and bar workers, have clawed their way through the past several years.

The industry has changed, and operators need to avoid the temptation of regressing. Yes, employment levels are back to where they were before the pandemic. Worker and guest expectations will not return to where they were before February 2020. The changes are here to stay.

Lodging/Accommodation

Unfortunately, not every sector of hospitality is back to pre-pandemic employment levels.

First, the positive news. Lodging (or accommodation, if you prefer) did add jobs in September. Whereas restaurants and bars rose 61,000 jobs, lodging is up 16,000.

That’s good growth and reason to be optimistic regarding that sector. That’s where the good news ends when it comes to hard employment numbers.

On the negative side, lodging hasn’t yet returned to pre-pandemic employment levels. In fact, the sector is remains down by 217,000 jobs when compared to February 2020.

Should lodging/accommodation continue to add jobs at this pace, we could see a full recovery in Q4 2024.

However, the past few years have been an eyeopener for many lodging and accommodation operators. Many hotels, for example, have reduced the sizes of their teams.

It’s possible that as long as guest feedback remains positive, hotels and resorts will continue to operate with smaller teams. Indeed, technological innovations have made it simpler for mid- and large-scale properties to pare back labor.

Takeaway

While returning to pre-pandemic employment levels in restaurants and bars is great news, we must still be cautious.

This is a delicate situation, and one month of growth isn’t enough to shout, “We’re back!” There’s reason to be optimistic, to be sure, but adding jobs is just one part of an equation that features many variables.

For example, the unemployment level in the US remains unchanged at 3.8 percent.

So, be optimistic. Allow yourself to feel some hope. But be cautious. Continue to work toward empowering your teams, increasing traffic and revenue, mastering the guest experience, and achieving short- and long-term goals.

Image: George Pagan III on Unsplash

KRG Hospitality Start-Up Restaurant Bar Hotel Consulting Consultant Solutions Plans Services

by David Klemt David Klemt No Comments

Canadians Preparing for NHL Opening Week

Canadians Preparing for NHL Opening Week

by David Klemt

Vintage tabletop hockey game toy

Now nobody can accuse me of showing any NHL teams favoritism. Go Knights Go!

As one should expect, Canadian hockey fans are preparing for the 2023-2024 NHL season opener, and those preparations include on-premise visits.

On Tuesday, October 10, three teams will face off to start the regular season.

First, the Nashville Predators take on the Tampa Bay Lightning. Then, the Chicago Blackhawks will face the Pittsburgh Penguins.

Finally, after raising their brand-new, first-ever Stanley Cup championship banner, which they won just six seasons after their founding, the fastest an expansion team has accomplished this feat, the Vegas Golden Knights will welcome the Seattle Kraken to T-Mobile Arena in Las Vegas.

According to on-premise data from CGA by NIQ, Canadian hockey fans are planning to celebrate the start of the season at bars and restaurants. That means operators have less than two weeks to finalize plans to attract these guests to their venues.

In particular, operators in four provinces need to ensure their NHL opening week plans and promotions are good to go. Per CGA’s data, consumers in Québec are showing the greatest interest in watching this season’s opening games in bars and restaurants. Following and driving on-premise interest are British Columbia, Ontario, and Alberta.

Of course, operators throughout the provinces who serve sports fans should be ready to welcome hockey fans.

For our Canadian readers, the Montréal Candiens will take on Toronto Maple Leafs on Wednesday, October 11. On that same day, the Ottawa Senators face the Carolina Hurricanes; the Edmonton Oilers face off against the Vancouver Canucks; and the Winnipeg Jets will battle the Calgary Flames.

Click here for the full opening week schedule.

Why Does this Matter?

I may catch some flack for this but technically, any bar with televisions events can be a sports bar.

Yes, I understand that’s a very simplistic view. And yes, of course that comes with the caveat that sports should be authentic to a given concept. Also, showing sports should take into account the expectations of bar or restaurant’s guests.

In other words, most bars and restaurants can benefit from sports but they’d likely be a hindrance to some high-end cocktail bars and fine-dining concepts.

With that out of the way, operators who want to establish themselves as the go-to spot for sporting events need to nail opening week. That means having all of their ducks in a row.

Do they have the proper business TV packages in place? Will promotions and programming appeal to the target audience? Are the screens and audio system high quality for the best viewing experience? Does the menu offer sports fans what they want for great value? Is the team pulling out all the spots to make viewing fun?

Regarding the menu, CGA by NIQ has a couple of valuable insights. First, beer is the top beverage alcohol category among those planning to celebrate NHL opening week on-premise. Second, among those who plan to consume spirits, tequila is the top pick. Sounds like offering beer and tequila shot pairings could perform well.

However, operators should certainly take into account their own data. What F&B items are selling the best? Which items performed the best this same time last year?

Between 15 and 16 million Canadians follow hockey. That’s a vast pool of potential customers to convert to loyal guests. The importance of becoming their sports home base, their third spot, cannot be overstated.

This coming opening week, lay the groundwork to become the go-to place for hockey fans, fantasy sports competitors, and sports bettors.

Image: cottonbro studio via Pexels

KRG Hospitality. Gaming. Entertainment. Consultant. Food Service. Bowling Alley. Golf. Simulator. Arcades. Eatertainment.

by David Klemt David Klemt No Comments

Indies in the US & Canada: The Numbers

Independents in the US & Canada: The Numbers

by David Klemt

Canadian and America flags flying together

Operators who wonder how many independent restaurants there are throughout America and Canada finally have their answer thanks to Datassential.

The well-known food and beverage research and intelligence platform’s recent infographic reveals the state of indies in both countries.

For the purposes of their infographic, Datassential splits restaurants into two overarching categories. One major category is full-service restaurants, the other is limited-service.

From there, the platform organizes restaurants into five segments: casual, QSR, midscale, fast casual, and fine dining.

To my understanding, QSR and fast casual fall under Datassential’s limited-service designation. Casual, midscale, and fine dining are full-service restaurants.

To review the infographic yourself, please click here.

Number of Indie Restaurants: America

According to Datassential, there are 483,885 independent restaurants in the US.

Of those restaurants, 57 percent are full-service. It follows, then, that 43 percent are limited-service.

Close to half—44 percent—of full-service restaurants in the US boast more than five years of being open. Just a quarter of limited-service restaurants (26 percent) can claim the same.

This does, anecdotally, make some sense. QSRs and fast-casual brands have been on the rise over the past couple of years. In fact, some casual chains are developing and launching QSR brands off the strength of the category.

Finally, 21 percent of full-service restaurants in the US see annual sales under $500,000. That number climbs to 27 percent for limited-service restaurants.

Now, let’s take a look at independent restaurants in Canada.

Number of Indie Restaurants: Canada

Per Datassential, there are a total of 59,914 independent restaurants throughout Canada.

The split between full-service restaurants and limited-service restaurants is just about even. Fifty-one percent of indie restaurants in Canada are full-service. Forty-nine percent are limited-service operations.

A little under 40 percent of full-service independent restaurants in Canada (36 percent) can say they’ve been operating for more than five years. That number is 28 percent for limited-service restaurants.

Interestingly, just five percent of independent full-service restaurants in Canada bring in less than $500,000 in sales annually. That number jumps to 34 percent when we look at the limited-service category.

Indie Restaurants by Segment

The breakdown of the five Datassential independent restaurant categories is the same for America and Canada.

Most independent restaurants in either country are casual. Following, in descending order of number of restaurants, are QSR, midscale, fast casual, and fine dining.

For America, the numbers are as follows:

  • Casual: 37 percent
  • QSR: 34 percent
  • Midscale: 19 percent
  • Fast casual: 9 percent
  • Fine dining: 1 percent

And for Canada the breakdown is nearly identical:

  • Casual: 37 percent
  • QSR: 30 percent
  • Midscale: 18 percent
  • Fast casual: 14 percent
  • Fine dining: 1 percent

There are eight times as many independent restaurants in America as there are in Canada. But as you can see, the industry segmentation by country is nearly the same.

Future independent operators can look at this information a few different ways. They can choose to join the most popular segments and differentiate themselves from the competition. They can look for and fill a need for an indie fast-casual or fine-dining concept. Or they can shoot for the middle and go midscale, a segment that’s gaining traction across several hospitality industry sectors.

For you own copy of Datassential’s infographic, follow this link.

Image: chris robert on Unsplash

KRG Hospitality. Restaurant Business Plan. Feasibility Study. Concept. Branding. Consultant. Start-Up.

by David Klemt David Klemt No Comments

Fantasy Sports, Sports Betting on the Rise

Interest in Sports Betting and Fantasy Sports Grows

by David Klemt

Wall full of American footballs behind large NFL logo

A recent CGA by NIQ On Premise Impact Report for August, 2023 reveals an interesting insight into consumer behavior and expectations.

To be clear, all the data on this new one-pager is useful. However, a particular revelation stands out from the rest, for me.

The CGA by NIQ US On Premise Impact Report for August 24, 2023 addresses:

  • total on-premise sales;
  • dining versus drinking occasions;
  • cost of living impact in the past month; and
  • consumer interest in fantasy sports and sports betting.

It’s that final bullet point that I find compelling. However, let’s check out the numbers for the first three points before we jump into sports.

To download your own copy, please click here.

August by the Numbers

In comparison to August 20, 2022, check value is up one percent to $50.09. Ticket count, however, is down one percent to 1,569.

As one would expect, dining occasions outweigh drinking occasions. Seventy percent of consumers have dined out in a restaurant or bar in the past two weeks.

Compared to July 2o23, that’s a two-percent increase in dining traffic.

Over the course of the same amount of time, 40 percent of consumers have gone drinking in a bar or restaurant. That’s a decrease of one percent in comparison to July 2023.

Considering that many families travel in the month of August before kids head back to school (or to drop them off at university), these numbers make sense.

Of course, cost of living may also be impacting dining and drinking occasion. Most consumers report no changes to the frequency with which they go out for drinks. Some consumers even report going out more frequently for drinks. But some are also cutting back.

For example, 28 percent of consumers have decreased how often they go out for drinks. Eleven percent are consuming lower quality drinks when they do go out, and nine percent are decreasing the “quality” of the establishments they visit.

That said, 20 percent of consumers are increasing drink quality and 21 percent are increasing establishment quality per visit. Seventeen percent are increasing how often they go out for drinks.

Fantasy Sports & Betting

This, as you may have guessed, is the statistic that I find most compelling.

Fantasy sports and sports betting has been on the rise for some time in the US. Who among us isn’t the target of sports-betting-app ads when streaming or watching sports?

Sports bar operators and operators who can position themselves as sports fans’ “third spot” will find this next number interesting.

According to CGA by NIQ’s latest report, 63 percent of consumers revealed they had plans for NFL week one. Those plans included participating in daily fantasy sports or sports betting.

So, it would be wise for operators who will air NFL games this season to ensure they’re catering to fantasy football and sports betting fans. Becoming the hub for fantasy sports groups in your area can increase traffic, sales, and loyalty. And, of course, it opens up the door to many traffic- and revenue-generating sport- and team-themed LTOs.

Again, to download this new report for yourself, please click here.

Image: Adrian Curiel on Unsplash

KRG Hospitality. Gaming. Entertainment. Consultant. Food Service. Bowling Alley. Golf. Simulator. Arcades. Eatertainment.

by David Klemt David Klemt No Comments

Top-performing Menu Items in the US

Top-performing Menu Items in the US (So Far)

by David Klemt

Barbecue chicken wings, chili peppers, and chili flakes

Thanks to a recent mid-year report from F&B intelligence platform Datassential, we now know the top-performing menu items in the US.

For the low, low price of filling out a handful of fields, you can download a copy of Datassential’s “Foodbytes: 2023 Midyear Trend Report” for yourself.

There’s plenty of useful data packed into this short report. You may find some of the top food items a bit surprising.

But First…

Datassential does more than just list the top mid-year menu performers in their latest report. There are also a couple of interesting datapoints for operators to consider.

The first piece of information is an alarming statistic: 54 percent of consumers are of the belief that “tipping culture has gotten out of control.”

As we’ve reported earlier, it’s likely that a major driver of “tip fatigue” comes from retail. The expectation for consumers to tip at a restaurant, bar or nightclub is ingrained deeply in American culture.

However, consumers throughout America are being prompted to tip after just about every transaction they’re attempting to complete. In fact, it’s not just retail that has been encouraging (in some cases, guilting) people to tip. Some contractors are also adding tip lines when handing over tablets to clients so they can pay their invoices.

One result is that servers and bartenders are reporting lower tips; guests are so over tipping that they’re pushing back against the practice in venues where they’d traditionally have no problem doing so.

Of course, tip fatigue isn’t the only reason consumers are pushing back against tipping. Many people feel that operators should increase what they pay staff. Indeed, some people feel that operators are asking them to subsidize their employee pay. Whether they’d be happy to pay higher prices remains to be seen.

Fads Aren’t Bad?

Whenever we cover trends or discuss them with clients, we caution against chasing too many (or the “wrong” trends). And fads? It can be even riskier to hop on the bandwagon of something that may never even reach the trend stage of its lifecycle.

However, likely due to the ubiquity of TikTok, consumers expect restaurants to embrace fads. According to Datassential, 67 percent of consumers overall “want to see more fads at restaurants and retail.”

That number jumps to 74 percent when focusing on Millennials and Gen Z.

So, while we still caution operators about jumping on fads (or “micro trends”) and trends, that doesn’t mean be too cautious. If a fad or trend works with your brand and won’t cost much to feature, at least give it consideration.

Not sure you’re great at identifying fads that will work for your business? Ask your staff which fads and trends are hot at the moment.

Speaking of Hot…

Alright, let’s take a look at the F&B items Datassential identifies as popular at the midway point of 2023.

Again, I encourage you to download the report in its entirety. You can do just that by clicking here.

But for those who want instant gratification, check out these menu items:

  • Super Duper: Let’s kick things off with the hottest chain LTO, the Denny’s Super Slam. Per Datassential, restaurant chains have already featured in excess of 2,000 LTOs in 2023. The F&B intel agency tests them all, and the Super Slam is wearing the LTO crown at the moment.
  • Chef Chatbot: Datassential tapped ChatGPT to create a burger recipe and had Midjourney create an image for the resulting Caprese Avocado Burger. More than half of consumers surveyed—57 percent—want to try it at a restaurant.
  • Big Winner: Datassential asked consumers a simple question: Which would you rather eat for the rest of your life, a hamburger or a hot dog? A staggering 87 percent chose hamburgers, meaning just 13 percent of consumers would choose a hot dog over it’s burger buddy.
  • What a Pickle: Back in March we checked out Slice’s Slice of the Union report, and it predicted pickle pizzas would be a hot trend this year. Well, Datassential has crunched the numbers and says 40 percent of consumers are aware of this pizza style already. Looks like Slice may be proven right by the end of the year.
  • Speed Demon: Curious about the fastest-growing menu item on the US? Well, wonder no more: Datassential says it’s the barbecue chicken wing. Over the past year, they’ve grown 373 percent on menus across the States. Datassential posits the overall growth of chicken and the embracing of flavor trends like Carolina gold barbecue sauce are contributing factors.

There’s a lot to unpack here, so I’ll leave you to it. Just remember that when it comes to fads and trends, there’s a fine line between what’s hot, what’s not, and jumping on the wrong one. Good luck!

Image: Ahmed Bhutta on Pexels

KRG Hospitality Start-Up Restaurant Bar Hotel Consulting Consultant Solutions Plans Services

by David Klemt David Klemt No Comments

Should You Offer Your Guests Brunch?

Should You Offer Your Guests Brunch?

by David Klemt

Person with tattoos pouring coffee from French press

Is brunch on its way to becoming a lucrative daypart that can grow traffic, increase revenue, boost guest engagement, and promote loyalty?

If a report from Square is anything to go off, yes.

Owing in part to changes in consumer behavior from 2019 to now, brunch appears to be a solid traffic and revenue generator. The number of people working from home is impacting daypart spending, which makes sense. Traditional office workers will often pop into a QSR or cafe for coffee and breakfast on their way in to work. And when lunch rolls around, they tend to head out to restaurants nearby for their break.

Now, the data support the belief that more people are staying home on weekdays and unleashing pent-up demand for socializing and dining out on the weekends. And apparently that demand is rather voracious, because brunch appears to be on the rise.

In 2019, just over eight percent of all dining dollars were spent on Saturdays during traditional brunch hours. That has grown to just over ten percent this year.

In terms of engagement and bringing more brand awareness, the term itself is growing on social media platforms.

Along with revisiting hours of operation, it may be wise for operators to consider offering Saturday or Sunday brunch.

Bristory

Yes, that’s a brunch-style portmanteau of “brunch” and “history.” No, I’m not proud of myself but I’m leaving it in.

The portmanteau “brunch” is believed to have first been coined by a British writer named Guy Beringer in 1895. He included the word in an article he wrote for Hunter’s Weekly. Beringer was making the case for noontime meal that combined breakfast and lunch.

In arguing for what may be the world’s first hybrid meal, Beringer wrote that, “the arguments in favor of Brunch are incontestable. In the first place it renders early rising not only unnecessary but ridiculous. You get up when the world is warm, or at least, when it is not so cold. You are, therefore, able to prolong your Saturday nights…”

The word would appear a year later in a Pennsylvanian publication called the New Oxford. More than 30 years later, brunch was on its way to becoming “a thing” in the US.

Oh, and there are arguments that an American reporter, Frank Ward O’Malley, who should credit for the word “brunch.” Those who believe this is the case say O’Malley created the portmanteau some time between 1906 and 1919. As is the case with many classic cocktails, the origin of brunch is at least somewhat hazy.

By the 1970s, the stigma that once came with brunch—that drinking publicly during the day could harm one’s reputation—began to dissipate.

Brunch by the Numbers

According to Square, brunch is appealing for several reasons.

Let’s take a look at this infamous daypart by the numbers.

  • 9.8 percent: Growth in the number of restaurants in the US offering breakfast and brunch in 2022 alone.
  • 10 percent: Amount of overall spending in restaurants on Saturdays between the hours of 8:00 AM and 1:00 PM in 2023.
  • 35 million: Number of #brunch Instagram posts, and the number is growing.
  • 4.5 billion: Number of TikTok views of posts with #brunch.
  • 71 percent: Number of Americans who wish restaurants in the US would serve breakfast items all day.

To me, the most striking statistic is that brunch spending now accounts for ten percent of all restaurant spending.

That spend is logical when we think about who tends to enjoy brunch: people with time and money to spend on a leisurely, all-day meal.

As professor Farha Ternikar, author of Brunch: A History, has said, “Brunch continues to grow anywhere there is disposable income or time.”

So, operators who are considering offering brunch for the time or investing more into brunch have some questions to answer: Who is my target audience? What’s the population density of my market? Who has disposable income and time? Should I offer brunch on Saturday, Sunday, or both days? Does brunch work for my concept? Which venues near me are already offering brunch?

Answer those questions and speak with your staff before jumping feet first into this potentially lucrative daypart.

Image: Helena Lopes on Pexels

by David Klemt David Klemt No Comments

iPourIt Releases Their 2023 Pour Report

iPourIt Releases Their 2023 Pour Report

by David Klemt

Beer pouring into glass from tap

Interactive self-serve beer experience platform iPourIt‘s latest report, the 2023 Pour Report, is now available for download and review.

iPourIt is a pioneer in the self-serve beverage space. While it may seem counter-intuitive to some, many guests have shown time and again that they enjoy using self-serve walls. For these guests, a not in any way insignificant number, iPourIt installations enhance the guest experience, increase loyalty, and boost revenue.

And while many people associate iPourIt and self-serve programs with beer, these systems can also pour wine, cocktails on tap, spirits, non-alcohol beverages, and soft drinks.


View this post on Instagram


A post shared by Matt Plapp (@mattplapp)

Another benefit from iPourIt? Transparency and sharing of data. The company doesn’t limit providing valuable guest behavior insight to their clients. Rather, they make the data they collect available to anyone. Simply head to their website, fill out a few fields, and gain important beverage insights.

Anyone curious can choose between a standard report and a “pro” version. Both are free to download and peruse. People can also read our article that dives into their fourth-annual report via this link.

Below you’ll find key takeaways from their 2023 report. I strongly urge operators to download and review either report.

The Who

We agree that demographics are a metric that people and businesses often misuse. Valuegraphics can be far more effective for businesses looking to build loyalty and boost revenue.

Still, demographics can provide beneficial insights.

First, let’s look at how men and women used iPourIt systems in 2022. Men poured 20,477,288 ounces last year, whereas women poured 10,848,435 ounces. The average per pour for men was 6.4 ounces in comparison to 5.3 ounces per pour from women. On average, men spent $14.72 per visit to an iPourIt-equipped location; women spent $12.24.

Next, the generational breakdown. IPA was the number-one style poured for Baby Boomers, Generation X, and Millennials. For legal-drinking-age Generation Z drinkers, IPA came in second; their top pour style was cider. Likewise, Lager claimed second place for Boomers, Gen X, and Millennials. Second was IPA for Gen Z, and Lager was third. Wheat beer was third place for Boomers, fourth for Gen X and Millennials, and fifth for Gen Z. Sour came in fifth for Gen X and Millennials fourth for Gen Z; for Boomers, the style didn’t rank among the top five. Stout clinched the fifth spot for Boomers.

Finally, in terms of traffic, men of every age group poured more ounces than their female counterparts.

The What

Below, the top 10 styles of beer poured by men:

  1. Fruit beer
  2. Pale Ale
  3. Blonde
  4. Pilsner
  5. Stout
  6. Sour
  7. Wheat beer
  8. Cider
  9. Lager
  10. IPA

In descending order, the top five (download the report for the top ten) products poured by men were Michelob Ultra, Bud Light, Golden Road Brewing Mango Cart, Coors Light, and Modelo Especial.

And now the top styles of beer or category of beverage poured by women:

  1. Stout
  2. Fruit beer
  3. Blonde
  4. White wine
  5. Hard seltzer
  6. Wheat beer
  7. Sour
  8. Lager
  9. IPA
  10. Cider

Also in descending order, the top products poured by women were Michelob Ultra, Mango Cart by Golden Road Brewing, Bud Light, Ace Pineapple Cider, and Coors Light.

The Where

The 2023 Pour Report by iPourIt breaks the US down into five regions: West, Southwest, Midwest, Southeast, and Northeast.

Because our American head office is in Las Vegas and our hotel consultant is in Pennsylvania, we’ll look at the West and Northeast.

The top-five pours for the West in 2022 were:

  1. Bud Light
  2. Firestone Walker Brewing Co. 805
  3. Golden Road Brewing Mango Cart
  4. Coors Light
  5. Modelo Especial

While the top-five pours in the Northeast were:

  1. Blue Moon Brewing Co. Belgian White
  2. Allagash Brewing Co. White
  3. Lord Hobo Brewing Co. Boom Sauce
  4. Sloop Brewing Co. Juice Bomb
  5. Stella Artois

For the curious, Bud Light and Coors Light are categorized as American-style Light Lagers, 805 is a Blonde Ale, Mango Cart is a Wheat Ale, and Modelo Especial is a Mexican-style Pilsner. Blue Moon and Allagash White are both Belgian-style wheat beers (or Witbiers), Boom Sauce is a Double IPA, Juice Bomb is a Northeastern IPA, and Stella Artois is a Lager.

For further insights, please download this year’s iPourIt report here.

Image: cottonbro studio on Pexels

KRG Hospitality Beverage Programming

by David Klemt David Klemt No Comments

Why Pickleball Should Have Your Attention

Why Pickleball Should Have Your Attention

by David Klemt

A pickleball racket and pickleballs

The explosive popularity of pickleball and its legions of rabid players should have the attention of restaurant, bar, and hotel operators.

In fact, the sport may just result in the next Topgolf-esque eatertainment concept.

According to an October 2022 Fortune article, pickleball is the fastest-growing sport in America for three years running. That article follows previous coverage from an array of publications that come to the same conclusion.

In Canada, the popular sport is also growing fast. It’s up against soccer, lacrosse, and cricket, but the numbers are impressive. In 2020, estimates showed 350,000 Canadian households playing pickleball. As of last year, that number was growing past 900,000.

Another sign that the sport is gaining incredible traction throughout North America? Doctors are encountering growing numbers of pickleball injuries. The Journal of Emergency Medicine says that about 19,000 people suffer pickleball injuries per year.

That may not seem like a lot when considering how many Americans play. According to the Association of Pickleball Professionals, there are 36.5 million Americans playing, from beginners to professionals.

Speaking of professional pickleball, there are professional leagues and teams. And those teams have the attention—and backing—of big-name sports celebrities. Major League Pickleball (MLP) boasts investments by Lebron James, Draymond Green, and Kevin Love. Tom Brady and Kim Clijsters are investing in an MLP expansion team.

Attention-grabbing Statistics

There’s a website—Pickleheads—that helps people locate pickleball courts. When I visit the site it shows me three casino resorts with courts immediately.

And the site just happens to have a page of useful statistics. I choose to accept that these stats are accurate.

Those who want to take a look themselves can do so by following this link. However, I’m going to share a few below:

  • Pickleball growth: 158.6 percent over the last three years
  • Top age bracket: 18 to 34 years old
  • Compound annual growth rate through 2028: 7.7 percent

Also per Pickleheads, the only popular sports with higher participation rates than pickleball are running and hiking.

The Next Topgolf?

The stats above should get operators’ creative juices flowing. The current growth of the sport along with the largest age group, growth projections, and support in the form of leagues, teams, and celebrities, is highly appealing.

Will a pickleball-forward eatertainment concept be the next Topgolf? It’s possible, and that’s why people considering their first or next concept need to look into pickleball.

The sport is perfect for our industry. It’s easy to learn, simple to play, and popular with most operators’ ideal age bracket—ages 21 to 34. However, pickleball is also very popular amongst the 50 to 70 set, a group with disposable income and time to indulge their interests.

Then there’s the undeniable fact that the sport is often described as fun and social. There are even articles lauding pickleball for encouraging networking.

Finally, there are organizations with which pickleball-centric eatertainment concepts can partner. An illuminating example comes from Shake Shack.

Toss and Spin, a racket sports organization, is partnering with Shake Shack this year. Their 2023 campaign is called the Shake Shack Pickleball Club. This nationwide activation centers around a nationwide tour across America featuring one-day pickleball clinics for all skill levels and tournaments.

One can only assume that this tour, backed by such a visible restaurant brand, will introduce even more people to pickleball. In turn, that creates an even larger pool of potential customers for the right concept.

Opportunity

We speak with a hospitality group pursuing an F&B-driven pickleball concept on the Bar Hacks podcast.

Brian Harper, a partner in Competitive Social Ventures and the company’s senior vice president of sales and marketing speaks about Pickle and Social on episode 94. Not only do his partners on the leadership team see potential for the sport, they love to play it themselves.

Should you think you have a solid idea for a successful pickleball concept, let us know.

Our industry standard feasibility studies will help you select the right market and site. Our fully customized concept development plans will help you and others visualize your big idea. And our in-depth business plan will provide a realistic roadmap for you to throw open your doors and march toward success.

Someone out there has the next big eatertainment concept inside their head. Is it you?

Image: Brendan Sapp on Unsplash

KRG Hospitality. Gaming. Entertainment. Consultant. Food Service. Bowling Alley. Golf. Simulator. Arcades. Eatertainment.

by David Klemt David Klemt No Comments

Addressing Employee Theft

Addressing Employee Theft

by David Klemt

Security camera stencil graffiti design

Recent posts about employee theft in the hospitality industry throughout Canada and the US have the KRG Hospitality team talking.

Indeed, the statistics are startling. For instance, there’s the claim that a staggering 75 percent of employees admit to stealing from their employers “at least once.”

A few years back, the Retail Council of Canada reported that while “customers” stole $175 on average, employees stole $2,500 before being caught.

Then there’s the incredible economic impact. Multiple sources claim employee theft in the US costs businesses $50 billion annually. In Canada, theft costs businesses more than $1 billion per year. Both numbers are shocking.

Looking at US restaurants specifically, the number ranges from $3 billion to $6 billion in losses due to employee theft. According to Business.com, employee theft affects four percent of a restaurant’s sales and accounts for 75 percent of shortages in inventory.

At this point, you’re probably Googling security cameras. But hold on for a moment.

Disclaimer

Before proceeding, know this: I’m going to make a few points that will seem like victim blaming. In part, this perception will be the result of my addressing recruiting, hiring, onboarding, training, the leadership team, and workplace culture.

Let me be clear: I’m not excusing employee theft. I don’t think there’s any justification for it.

Despite what a (hopefully) small number of loud voices claim on various social media platforms and forums, I don’t think it’s acceptable to steal from a corporation or business owner. No, theft isn’t a justifiable response to feeling slighted by ownership or leadership. And no, it’s not “okay” because a company generates “so much” revenue, has insurance, and can “write it off.”

With that out of the way, let’s proceed.

People are Going to Steal

Here’s one immutable fact: You’re going to hire someone who’s going to steal from your business.

Is your business up and running and serving guests? You employ someone right now who has either stolen from you already or is going to steal.

So, you can run your business under a cloud of suspicion and distrust. Or, you can improve your odds of reducing theft and ferreting out thieves before they do too much damage.

Again, you can install security cameras and place them above each POS terminal and every cash drawer. You can ensure you have clear, cutting-edge CCTV coverage of the entire bar and dining areas. Walk-ins and storage areas can have clear, high-resolution camera coverage.

Honestly, you should have that type of coverage. That type of security can improve employee and guest safety, and your insurance carrier will likely be happy about it.

But you don’t need to impose an atmosphere of suspicion, fear, and intimidation along with the cameras. If you were an employee, would you want to work somewhere that makes it clear you’re always under suspicion? Would you want to work alongside a leadership team whose default setting is that all employees are thieves unworthy of trust?

Workplace Culture

You’re never going to have a theft-free business, period. That’s another reason to not “lead” with fear, anger, and suspicion.

Truly, all that style of leadership will do is drive good, honest employees out. So, the approach should be attracting honest workers. You build a strong, trustworthy team through respect and empowerment.

Yes, there will be employees who take advantage of that respect. They were going to behave that way and steal or otherwise disrespect you, your business, and the team regardless.

Putting in the work to reflect on your leadership style and that of your leadership team pays dividends. It aids in recruitment and fosters an atmosphere of respect and honesty.

Become known for a healthy, positive workplace and you’ll attract the best workers. Nurture that culture and the team will police itself; they won’t tolerate anyone harming the business.

Am I suggesting you view your business through rose-colored lenses? Absolutely not. Install security cameras. Maintain the right insurance coverage. Conduct regular inventory checks. Review comps and voids for irregularities. Limit access to cash. Outline what constitutes theft—including time theft—and make consequences clear.

And here’s a crucial item: Prove you respect and care about your workers. Not say it, prove it.

You don’t need to know their life stories and everything going on in their lives. But you can let it be known that if they’re struggling with something, you and your leadership team are there to listen and help how they’re able.

Nothing you do will eradicate employee theft completely. You can, however, reduce it and learn to quickly stamp it out. And you can do that while maintaining a happy, healthy workplace.

Image: Tobias Tullius on Unsplash

KRG Hospitality. Business Coach. Restaurant Coach. Hotel Coach. Hospitality Coach. Mindset Coach.

by David Klemt David Klemt No Comments

Slice Releases 2023 “Slice of the Union”

Indie Pizzeria App Slice Releases 2023 Report

by David Klemt

Wood-fired pizza on paddle

The annual Slice of the Union report from independent pizzeria ordering app Slice offers excellent insight into the indie pizza space.

Per the company’s website, Slice serves all 50 states and works with 19,000 pizzerias. For context, that’s a network of pizzerias more than double in size in comparison to Domino’s.

In my opinion, then, the company is well-positioned to deliver data regarding the indie pizzeria space.

Additionally, Slice says they save independent operators money. To date, Slice claims partners have saved more than $265 million in fees that would have gone to third-party delivery services.

In part, that’s due to a 2021 innovation by the company. At the International Pizza Expo in Las Vegas in August of 2021, Slice unveiled fixed-price, tiered packages for partners.


View this post on Instagram


A post shared by Slice (@slice)

Essentially, Slice intends to help local, indie pizzerias boost their reach, discoverability, and revenue. The company’s mission is “empowering independent pizzerias.” In part, Slice accomplishes their mission to “Keep Local Thriving” by offering indie pizzeria operators access to technology and services that rival the big pizza chains.

Below you’ll find some of the insights from the 2023 Slice of the Union that most stand out to me. To review the report in its entirety yourself, please click here. Not only is it an informative read, it’s actually fun.

Ordering Occasion

Kicking things off, ordering occasions. As all operators should know, many guests seek out particular cuisine, drinks, or venues dependent upon their dining or drinking occasion.

In the 2023 Slice of the Union, Slice takes a look at a couple occasions that motivate people to order pizza: sports and awards shows.

Now, it’s no surprise that people order pizza to enjoy while watching sports. So, since that’s common knowledge, Slice goes deeper and identifies the top sports leagues:

  1. Football
  2. Basketball
  3. Baseball
  4. Hockey

No mention of my two favorites, F1 and MotoGP, but at least hockey makes the cut. (My Vegas side says, “Go Knights!” but my born-in-Chicago side says, “Go ‘Hawks!”)

When we look at awards shows, the top spot may be somewhat of a surprise:

  1. People’s Choice Awards
  2. Tony Awards
  3. Emmy Awards
  4. Golden Globes
  5. The Oscars

Interestingly, the Grammys only manage an honorable mention. And there’s something poetic about pizza being the “people’s choice” for the People’s Choice.

Another bit of compelling data. Slice says that most people buckle and give up on their New Year’s resolution to keep away from pizza on January 13.

What’s in a Name?

There are certainly some creative pizzeria names out there.

However, Slice identifies not just some of the most common names but how many pizzerias use them:

  1. Joe: 206 pizzerias
  2. Sal: 206 pizzerias
  3. Tony: 114 pizzerias
  4. Johnny: 56 pizzerias
  5. Ray: 43 pizzerias
  6. Nino: 21 pizzerias

Flavors on the Rise

Wondering what the top topping is? What Slice sees as the pizza trends to watch?

Well, Slice has the answers to those questions (and more) in their annual report.

Pepperoni, as Slice says, “is a classic.” So, it wouldn’t provide much insight to just say, “Hey, pepperoni is popular.” Operators who offer pepperoni—and why wouldn’t they?—are already aware of its ubiquity.

Instead, Slice identifies the topping that’s showing the most growth. Per Slice, mushrooms has shown up on 8.9 percent more pizzas. Also, ranch dressing showed up on 9.7 percent more pizza orders in 2022.

Now, which trends may gain more significant footholds in the pizza space this year? Slice identifies two in their report:

  • Roman-style pizza
  • Pickle pizza

A Roman-style pizza is thin crust and pushes the toppings out all the way to the edges. A pickle pizza features—shocker—pickles heavily. According to Slice, this style of pizza normally includes a garlic sauce and mozzarella cheese.

Again, you’ll want to check this report out for yourself as there’s much more useful information. Click here to read it now.

Image: Dylan Sauerwein on Unsplash

KRG Hospitality Restaurants & Cafes, 2023 icon

by David Klemt David Klemt No Comments

SevenRooms Email Marketing Integration

SevenRooms Introduces Email Marketing Integration

by David Klemt

Public red and blue mailbox

Today, SevenRooms announces a new marketing innovation that integrates with the platform’s Automated Email feature: Email Marketing.

This is more evidence of SevenRooms’ continued growth. The company began 2023 by adding their first-ever chief marketing officer. Just two months later, SevenRooms announced a new investor: Enlightened Hospitality Investments, spearheaded by Danny Meyer.

Additionally, offering this new tool to operators makes clear the platform’s intent to truly be an all-in-one operations solution. Email Marketing, for example, can replace third-party email services. Streamlining marketing makes it simpler for operators and their teams to ensure they keep guests engaged with their venue and brand.

And, of course, including effective tools within a single platform can lead to reduced costs and the relief of pain points. When systems are difficult to use, some operators are less inclined to want to actually use them. That’s a waste of valuable resources.

Combined with Automated Emails, SevenRooms Email Marketing gives more control over marketing to operators. Not only are emails triggered based on various tags, the emails can be customized fully. And, to ensure marketing runs smoothly for everyone, operators will have access to templates if customization isn’t necessarily in their wheelhouse.

You’ll find the SevenRooms Email Marketing press release in its entirety below.

SEVENROOMS EXPANDS MARKETING SUITE WITH INTEGRATED EMAIL MARKETING

New Email Marketing Tool Provides Key Data Insights and Revenue Potential for SevenRooms Clients

NEW YORK (March 14, 2023)—SevenRooms, a global guest experience and retention platform for the hospitality industry, has announced a new solution and expansion of its marketing suite for hospitality operators worldwide: Email Marketing. The product will work in conjunction with SevenRooms’ Automated Emails, a set of personalized, trigger-based emails sent to customers on behalf of the operator, to continue to engage guests once they’ve visited a venue.

Email Marketing enables SevenRooms customers to send one-time, customized marketing emails directly within the SevenRooms platform to give operators more control over the way they use their guest data. Having ownership of this guest data allows operators to build their brand through direct touchpoints with guests to drive loyalty and repeat visits. It also provides detailed insights into email performance with metrics that matter to their business, including showing the reservations, covers and revenue attributed to each email.

Email Marketing supports operators with a solution that is connected throughout a restaurant’s tech stack and removes the need to use third-party email service providers that create additional work for staff trying to manage email preferences across multiple systems. It is directly linked to the SevenRooms CRM and operating system giving operators full control over their messaging and who receives it by using Auto-tags or Client tags to segment marketing audiences. Additionally, operators using Email Marketing have the ability to create either fully customized emails with an easy-to-use visual editor or utilize curated templates.

The new product also enhances the experience for guests of SevenRooms customers by allowing them to stay in touch or up-to-date with their favorite venues, receive targeted messages and promotions, or simply control the venues from which they receive marketing. Leveraging Email Marketing, restaurants can use their guest data to tee up relevant, customized emails. For example, sending guests who have purchased wine at least five times an invite to a dinner with their sommelier, or excluding guests with shellfish allergies from an email about their annual clambake.

“SevenRooms Email Marketing product provides restaurants with functionality that simply does not exist in the email marketing platforms that restaurants traditionally use,” said Allison Page, Co-Founder and Chief Product Officer at SevenRooms. “We enable restaurant marketers to leverage their robust SevenRooms guest database to quickly and easily build targeted campaign segments, eliminating the need to manually export and import mailing lists between systems. While other email service providers promise revenue, SevenRooms can prove it with accurate data on the revenue generated by each campaign to truly measure email marketing performance.”

“The combination of SevenRooms’ Email Marketing and Automated Emails makes guests feel very connected with us,” said Alyssa Fenu, Sales & Marketing Manager at Mango’s Tropical Café. “Being able to choose who our emails are going to — a specific customer segment or broadcasting to our whole database — makes the process a lot simpler. And it’s super easy to understand how many people opened our emails, how many people actually made a reservation, and how much money we’re making because it’s all in one place.”

For more information about SevenRooms and its services, please visit www.sevenrooms.com.

About SevenRooms

SevenRooms is a guest experience and retention platform that helps hospitality operators create exceptional experiences that drive revenue and repeat business. Trusted by thousands of hospitality operators around the world, SevenRooms powers tens of millions of guest experiences each month across both on- and off-premises. From neighborhood restaurants and bars to international, multi-concept hospitality groups, SevenRooms is transforming the industry by empowering operators to take back control of their businesses to build direct guest relationships, deliver exceptional experiences and drive more visits and orders, more often. The full suite of products includes reservation, waitlist and table management, online ordering, mobile order & pay, review aggregation and marketing automation. Founded in 2011 and venture-backed by Amazon, Comcast Ventures, PSG and Highgate Ventures, SevenRooms has dining, hotel F&B, nightlife and entertainment clients globally, including: MGM Resorts International, Mandarin Oriental Hotel Group, The Cosmopolitan of Las Vegas, Wynn Resorts, Jumeirah Group, Wolfgang Puck, Michael Mina, Bloomin’ Brands, Giordano’s, LDV Hospitality, Zuma, Australian Venue Company, Altamarea Group, AELTC, The Wolseley Hospitality Group, Dishoom, Live Nation and Topgolf.  www.sevenrooms.com

Image: Brett Garwood on Unsplash

KRG Hospitality Planning Phase, 2023 icon

by David Klemt David Klemt No Comments

Do Super Bowl Ads Work on Consumers?

Do Super Bowl Ads Work on Consumers?

by David Klemt

Pepsi Zero Sugar bottle

One of the biggest Super Bowl ad winners is Pepsi Zero Sugar.

Brands spent hundreds of millions of dollars to advertise during Super Bowl LVII, but do their ads actually translate to demand for their products?

A week ago we shared our ten favorite beverage-focused Big Game ads. Along with those ads we shared some numbers.

One of those numbers was $7 million, the cost of a 30-second Super Bowl ad on Fox. Other numbers? $500 million and $700 million, the range of revenue it’s estimated that Fox generated this year from Super Bowl ads.

At this point, these ads and the Halftime Show have essentially become their own entities. Some people watch the Big Game for the ads, some for the show halfway through. It stands to reason that brands are well aware of this development. So, they try to create the most impactful ad possible in the hopes of generating consumer demand.

In other words, these brands aren’t spending all this money just so they’re commercial can be deemed cool. Sure, brands want that buzz. But they also want an ROI on the millions they spend.

The big question is, then, are they seeing a return? Well, it just so happens that behavioral insight platform Veylinx has a data-driven answer to that question.

In short, the answer is yes. Of course, it’s a nuanced yes. For example, it appears Gen Z doesn’t care much about Super Bowl ads, as you’ll see below. Also, non-advertisers in the same categories as Super Bowl advertisers appear to see a benefit from the ads.

You’ll learn more from the Veylinx press release below. It’s an interesting read with valuable data for restaurant, bar, and hotel operators.

NEW YORK, Feb. 22, 2023 — A new study from behavioral research company Veylinx determined whether or not Super Bowl commercials boost consumer demand for the products advertised. The results show that 2023 Super Bowl advertising fueled a 6.4% increase in demand among viewers.

The overall increase in consumer demand was driven by women, who accounted for a 21% increase in demand growth. The commercials had minimal impact on men, yielding just 1% demand growth for the brands tested. Gen Z viewers were largely unimpressed by the Super Bowl ads, with demand among 18 to 25 year olds actually shrinking by 1%.

2023 Veylinx impact of Super Bowl ads on consumers chart

“It’s not really a surprise to see that Super Bowl ads improve sales, but the short term bump alone may not be enough to justify the $7 million price tag,” said Veylinx founder and CEO Anouar El Haji. 

Using Veylinx’s proprietary methodology—which measures actual demand rather than intent—the study tested purchase behavior during the week before the Super Bowl and again the week after. The research focused on measuring the change in consumer demand for eight brands with Super Bowl ads: Michelob Ultra, Heineken 0.0%, Hellmann’s Mayo, Downy Unstopables, Crown Royal Whisky, Frito-Lay PopCorners, Pringles and Pepsi Zero Sugar. 

Super Bowl Advertising Winners Overall

Michelob Ultra – 19% increase in demand

Pepsi Zero Sugar – 18% increase in demand

Frito-Lay PopCorners – 12% increase in demand

Heineken 0.0% – 11% increase in demand

Super Bowl Advertising Winners Among Women

Pepsi Zero Sugar – 45% increase in demand

Michelob Ultra – 40% increase in demand

Heineken 0.0% – 40% increase in demand

Crown Royal Whisky – 26% increase in demand

Veylinx, top performing brands during 2023 Super Bowl

Halo Effect for Non-Advertisers

The biggest winners were arguably brands in the same product categories as Super Bowl advertisers. Non-advertisers in those categories appeared to benefit nearly as much as the advertisers: demand grew by 4.2% percent for the study’s control group of non-advertising competitors. Corona Extra, Kraft Mayo and Lay’s STAX were the greatest beneficiaries in a control group that also included Budweiser Zero, Arm & Hammer Clean Scentsations, Canadian Club Whisky, Popchips, and Coke Zero Sugar. Notably, every non-advertiser saw at least a slight increase in post-Super Bowl demand.

“The goal of our study was to look specifically at how consumer demand is affected by running a commercial during the Super Bowl,” El Haji said. “It’s possible that the non-advertisers deployed other marketing efforts to offset or take advantage of the Super Bowl advertising—or they simply benefited from increased exposure for their categories.” 

Additional Findings

Study participants also answered a series of follow-up questions about their preferences, perceptions and how they watched the Super Bowl. More than three-quarters watched at home through various platforms, the most popular being the live cable/satellite broadcast (38%), followed by YouTube TV (15%) and Hulu (10%). When asked why they watched, it’s no surprise that participants were all about the game (64%)—but the commercials were the next most popular reason for watching (39%), followed by halftime (35%), the social aspect (26%) and fear of missing out (13%). 

About the Research

Veylinx studied the behavior of 1,610 U.S. consumers pre- and post- Super Bowl LVII. Unlike typical surveys where consumers are simply asked about their purchase intent, Veylinx measures whether consumers will pay for a product through a real bidding process. Consumers reveal their true willingness to pay by placing sealed bids on products and then answering follow-up questions.

For more information about the study and the Veylinx methodology, visit info.veylinx.com/super-bowl

About Veylinx

Veylinx is the most realistic behavioral insights platform for confidently answering critical business questions during all stages of product innovation. To reliably predict demand, Veylinx captures insights through a Nobel Prize-winning approach in which consumers have real skin in the game. This is a major advance from traditional market research practices that rely on what consumers say they would hypothetically buy. Veylinx’s unique research methodology is trusted by the world’s largest and most innovative consumer goods companies.

Main article image: PepsiCo / Article body images: Veylinx

KRG Hospitality Bars & Lounges, 2023 icon

by David Klemt David Klemt No Comments

4 Takeaways from Resy’s State of Dining

4 Takeaways from Resy’s State of Dining Report

by David Klemt

Guests enjoying an array of dishes at a restaurant

The State of Dining and What’s To Come in 2023 from Resy is an informative report that highlights several key developments to watch this year.

In fact, Resy’s report shines a light on ten trends and predictions for operators to consider. However, I’m going to address the four that stand out the most (to me).

For those who may be unfamiliar with Resy, the company is an online reservation platform. While Resy mostly serves major American cities, it does have a presence in Toronto, Canada, and London, UK.

Most importantly, the platform has a unique view of the industry. Resy looks at the industry through the lens of reservations, meaning they collect data concerning consumer behavior in real time.

So, let’s start with some compelling revelations based on reservation data. To view this report in its entirety, visit Resy via this link.

1. 5:00 PM

According to Resy, one reservation time is standing out from the rest. In comparison to 2019 and 2021, 5:00 PM reservations grew by two percent in 2022.

Now, two percent may seem like insignificant growth. However, given Resy’s reach and the platform’s number of active users, the opposite is true.

A two percent increase equates to hundreds of thousands of reservations.

Now, think about your restaurant or bar and consider your reservation distribution. Do you know which hour sees the most reservations? Not an assumption—do you have the data and therefore know the time?

If not, that’s information you need. Not only is this important for scheduling and controlling costs, it’s the benchmark you need to know if you have any chance of tracking change.

2. The Return of In-person Dining

This is one prediction that multiple industry (and even non-industry) publications are making for 2023. It’s the same for hospitality industry platforms: Companies see 2023 as the year restaurants and bars really come roaring back.

But when Resy makes this prediction, they’re using their reservation data to back it up.

First, last summer represents the single busiest season in the platform’s nine-year history. Second, a specific event, a dinner with chef-operator Massimo Bottura, sold out via Resy in a minute.

Third, October 2022. Why is this month worth pointing out in particular? By October, more Resy users had visited restaurants in 2022 than they had during the entirety of 2021.

Clearly, Resy expects this trend to continue and strengthen in 2023. Given their access to reservation data, this seems like a well-informed prediction.

3. Miami

In December of last year we checked out the best states in America for starting a business. Pennsylvania stood out to us for obvious reasons: our Northeastern office is in Philadelphia, with Kim Richardson at the helm.

Overall, Pennsylvania holds the number four spot on the Forbes list. For comparison, Florida slots in at number 45.

However, Miami appears to be an outlier for restaurant and bar entrepreneurs when it comes to Florida.

Per Resy, the restaurant footprint in Miami grew fourfold from 2017 to 2022. Moreover, Resy is seeing continuous growth in Miami. Going even further, this growth is coming from local and outside operators.

In fact, Resy describes South Florida as “white hot for high-profile sequels.” An operator has a top-tier concept? They’re likely to expand into Miami.

4. TikTok

Last week I addressed Datassential weighing in on photos versus videos. According to the F&B research firm, video is now dominating social media engagement.

And also last week, I explained the importance of discovery functionality. Operators who are considering adding a platform to their tech stack should consider whether it will help people discover their restaurant, bar, or hotel.

Resy is a platform that doesn’t just offer discoverability, it’s a core feature. So, when they say that TikTok appears to be a powerful discovery tool for restaurants and bars, that’s likely true.

Now, a poll Resy cites in their report reveals that traditional word of mouth is the top method of discovery. However, the same poll cites that TikTok is the top discovery platform for 43 percent of Gen Zers. Or, in other words, video, or digital word of mouth.

Should operators jump on TikTok? That’s something only individuals can determine is good for their business.

But if they’re courting Gen Z, well…they may need to add TikTok to their social media toolbox.

KRG Hospitality Success Session, 2023 icon

Image: Meredith Jenks for Resy

by David Klemt David Klemt No Comments

Picture vs. Video: Datassential Weighs In

Picture vs. Video: Datassential Weighs In

by David Klemt

Vintage Rolleiflex camera

If you want to meet guests—both regular and new—where they are, it helps to know how they prefer to consume social media content.

However, I’m not talking about which platforms are the most popular. We’ll get to that, but I’m talking about the content itself.

It appears that two camps are emerging: Team Picture and Team Video. And yes, they appear to follow demographic delineations.

Veteran operators and front-of-house teams know the drill. It’s standard for a server to drop food off and phones to hover over dishes immediately.

Bartenders, of course, also know the routine. In fact, bartenders working behind the stick across the globe know chronically online guests will come seeking specific drinks because they’re “Instagrammable.”

Hey, I’m not above it—I’ve snapped pics at bars and restaurants known for their innovative drink presentations. The same can be said about certain dishes at particular restaurants.

But is that camera just rapid-fire snapping photos? Or is it becoming more common for the guest holding the phone to record video?

Luckily, F&B market research agency Datassential has data-driven answers to those questions.

Still Photography vs. Moving Pictures

Okay, I’ll admit that this subheading title is a bit lame. Whatever—I’m keeping it in.

At any rate, you know what I’m talking about here, pictures versus videos. Interestingly, Datassential suggests that our industry is already at least a bit behind in this debate.

As they say in their latest Foodbytes report, 2023 Food Trends, “It seems like the food industry only just figured out how to cater to the importance of photography and Instagram and now it’s all being replaced by video.”

Specifically, Datassential speaks about short-form video in this report. Essentially, the agency is saying that guests (younger generations, in particular) are “over” still or static images of F&B items.

Today, just like video killed the radio star, video is on a still photography killing spree. And as I mention above, Datassential’s data reveals what people expect regarding this topic when it comes to age groups.

Unsurprisingly to some, Gen Z is most likely to consume video content. It follows, then, that 67 percent of this group has taken video of food at a restaurant or at home.

Next up, at 54 percent, is Millennials. Forty percent of Gen X says they’ve taken video of food at a restaurant at home. Just 18 percent of Baby Boomers have done so.

Where are People Consuming Video Content?

So, that’s the “who.” Now for the “where.”

According to Datassential, these are the top platforms for video consumption:

  1. BeReal: 11 percent
  2. TikTok Live: 25 percent
  3. Twitter video: 27 percent
  4. Snapchat video: 35 percent
  5. Instagram Reels: 38 percent
  6. TikTok: 41 percent
  7. Facebook Live: 41 percent
  8. Instagram videos: 44 percent
  9. Instagram Stories: 45 percent
  10. Facebook Stories: 48 percent
  11. YouTube: 77 percent

Does this mean you need to create content for each platform? Well, unless you somehow have the time or a digital marketing team, probably not.

Instead, you’ll want to pick the platforms that make the most sense for your brand and audience. There are also cross-posting tools that can save you time and simplify the process.

Takeaway

It’s up to individual operators to choose their social channels. The same is true for what they plan to post, photos or videos.

There’s a different consideration I want operators to keep top of mind. If video continues to dominate social, think about what could happen to dining rooms. It won’t be unusual for “influencers” to break out handheld lighting equipment to create videos. And I think we all know what that will do to the atmosphere in restaurants, bars, and lounges.

As strange as it may seem, operators may need to post signs banning flash photography and lighting for videos. Otherwise, the guest experience will diminish. Who pays the price for that negatively impacted experience? Not the influencer; the operator takes the hit in their reviews and traffic.

If video is here to stay, operators need to observe their dining rooms and adjust accordingly. That doesn’t just mean crafting video-worthy interiors and menu items. Now, it also means protecting the guest experience.

Image: Alexander Andrews on Unsplash

KRG Hospitality, Intro to Garnishes

by David Klemt David Klemt No Comments

Datassential: The Flavors of 2023

Datassential: The Flavors and Menu Items of 2023

by David Klemt

Basket of hot chicken wings

Food and beverage market research agency Datassential has some data-driven thoughts on the flavors and menu items that will define 2023.

Featured in their latest Foodbytes report are 20 items for operators to consider this year. There are ten food items, drinks, and ingredients Datassential predicts will be on basically every menu.

And there are another ten food items, drinks, and ingredients the agency feels could suddenly hit in 2023.

For you own copy of Datassential’s 2023 Food Trends, click here.

Prolific Performers

As Datassential refers to them in their report, these are the items “that will be everywhere” this year.

Food

  • Birria. This one makes sense as birria only appears to be capable of continually growing in popularity.
  • Mushroom. In Datassential’s opinion, we should expect more menus to feature mushroom snacks. Also, expect to see (or add yourself) lesser-known, rare, and exotic mushrooms on menus.
  • Salsa macha. Over the past four years, according to Datassential, salsa macha as grown a staggering 339 percent on menus.

Drink

  • London Fog. A compelling earl grey tea latte.
  • Mangonada. Salty, tart, fruity, and bold, the Mangonada is a flavorful frozen drink.
  • Ranch Water. Simple, timeless, and refreshing. In 2022, per Datassential, Ranch Water was the fastest-growing cocktail.
  • Soju. According to Datassential, soju is the third fastest-growing spirit on restaurant and bar menus.

Ingredient

  • Spicy maple. As the image atop this article suggests, expect spicy maple to replace or at least give hot honey a run for its money.
  • Ube. A striking purple yam from the Philippines.
  • Yuzu. Datassential predicts this citrus fruit will start showing up on many chain restaurant menus.

Promising Performers

In Datassential’s data-driven opinion, the following items need to be on every operator’s radar.

These are the items that have the potential to “hit it big” in 2023.

Food

  • Pickled strawberries. Interestingly, this matches up with Technomic’s trend prediction for the US, Canadaworldwide, really.
  • Savory granola. Not only on its own but as an element of savory, healthy bowl.
  • Sisig. A Filipino delicacy with pork belly, pig’s face, and chicken liver as key elements.

Drink

  • White coffee. As Datassential states, “there’s always room for coffee innovation on menus.”

Ingredient

  • Black tahini. The appearance of black tahini is quite striking, making for dramatic presentations. And as we know, striking presentations are perfect for social media marketing and engagement.
  • Cannabis. The legalization of recreational cannabis use in almost half of US states is leading to innovation in this space. And as more markets legalize public consumption in the form of F&B items on-premise, restaurants and bars will add cannabis-infused items to their menus.
  • Cherry blossom, or sakura. It seems that cherry blossoms are poised to take off in the US market.
  • Chestnut flower. Per Datassential, this ingredient is gaining popularity for use in winter baked goods.
  • MSG. For decades, restaurants proudly proclaimed “no MSG” or “MSG-free” on menus due to misconceptions. Now that consumers are better educated about ingredients, restaurants are proudly proclaiming their use of MSG.
  • Verjus. An ancient juice made by crushing unripened wine grapes. It can be an ingredient in a sauce, as a condiment, or to deglaze a pan.

There you have it—20 items to consider adding in your next menu update, featuring in your next LTO, or at least keeping an eye on in 2023.

Image: Scott Eckersley on Unsplash

by David Klemt David Klemt No Comments

Global Trends 2023: Technomic

Global Trends 2023: Technomic

by David Klemt

Shawarma stacked with fire in the background

Not content to focus solely on North America, foodservice research firm Technomic is predicting foodservice trends that will span the globe in 2023.

As the firm points out themselves, making predictions is a best-guess proposition. Many of Technomic’s 2022 predictions for Canada, the USA, and the globe have proven true. However, a handful of their trend predictions have yet to manifest.

Further, not all trends will work for all operators and their concepts. Chasing every passing fad or trend is great if you like to watch your costs spiral. Doing so is also an excellent way to confuse guests and stress staff.

So, when considering any trend, make sure it works with your concept, has some staying power, and will resonate with your guests. Speaking to that last point, this is one reason it’s crucial to collect guest data. Making important menu and guest-impacting operational decisions without data just doesn’t make sense.

When you’re done with this article, take a look at our examination of Technomic’s other predictions. The firm’s Canadian predictions are here. And you can read the American trends by clicking this link.

For your own copy of Technomic’s international trends report, click here.

Operations

For 2023, Technomic is making predictions that certainly appear plausible. A number of them pertain to operations.

Kicking things off, sustainability. Driven in part by the global impact of the pandemic, the health of our planet is top of mind for many people.

For example, Canada’s single-use plastics ban is now in effect. England plans to move forward with a similar ban by October of this year.

Alongside such bans, Technomic believes operators—small independents and global chains alike—will implement entire sustainability strategies. These will range “from packaging and restaurant operations to marketing and menu development.”

Does your concept have a dedicated pickup window? Perhaps a takeaway counter? Maybe even a drive-thru? If not, 2023 may be the year you make that change. Not only that, you’ll likely want to position them front and center.

Per Technomic, many consumers are done with delivery. From rising costs outweighing convenience to delivery failures, pickup may become more appealing. Pickup is still convenient, it’s less expensive, and the consumer is in control.

Additionally, many people are well aware of how costly third-party platforms are to operators. In fact, Technomic identifies these platforms and their fees as “the biggest industry villain” of 2023.

Menu

One of Technomic’s predictions is particularly enticing: Lebanese street foods. To clarify, the firm believes all manner of street foods from around the globe will perform well in 2023.

However, they feel Lebanon’s street foods will stand out from the rest. So, think shawarma, labneh, kibbe, and pickled vegetables. That last item, by the way, follows Technomic’s prediction that pickling and fermenting will be hot trends in the US and Canada.

Of course, there are other items that Technomic thinks will shine in 2023. If the firm is correct, there’s a new “holy trinity” to keep an eye on and consider for your menu: sushi, poke, and ceviche. According to Technomic, each performs very well when it comes to takeout.

Interestingly, the research firm suggests that this particular holy trinity will spawn new virtual brands. If Technomic’s predictions prove accurate, some of these brands will focus on fried chicken or plant-based versions.

Speaking to that last point, Technomic is predicting that plant-based will “evolve” in 2023. This evolution will focus on more traditional meat counterparts. Providing examples, Technomic suggests that avocado, modern takes on black bean patties, cauliflower, tofu, tempeh, and seitan will be this year’s plant-based rock stars.

Are this year’s 2023 Technomic predictions going to prove accurate? It’s far too early to tell. However, one thing I can say with confidence is this: their predictions are rooted deeply in data. When Technomic makes a “guess,” it’s always an informed one.

Click here to read Technomic’s report in its entirety.

Image: Slashio Photography on Unsplash

KRG Hospitality Restaurants & Cafes, 2023 icon

by David Klemt David Klemt No Comments

Canadian Trends 2023: Technomic

Canadian Trends 2023: Technomic

by David Klemt

Tortilla with beans, cotija cheese and egg

Restaurant, bar, and hotel operators will find this year’s data-driven trend predictions from Technomic for 2023 insightful.

Interestingly but perhaps not surprisingly, some operators may be looking beyond North America for inspiration.

Per Technomic, Central and South American cuisines could influence menus in Canada this year. Other food trends that might take hold are “retro” health items, and all manner of pickled foods.

Of course, not every Canadian trend prediction involves F&B. According to Technomic, tech and the guest experience will play important roles.

To review last year’s Technomic predictions, click here. Now, let’s jump into Technomic’s 2023 predictions.

Guest Experience

Certainly, the guest experience should always be top of mind for operators, their leadership teams, and their staff.

In this instance, Technomic isn’t suggesting that the guest experience in general will be a trend. Obviously, with as important as it is to the success of any business, it’s a cornerstone.

Rather, Technomic predicts that guests will continue to feel the need to rein in their spending due to ricing costs and prices. However, the foodservice research firm also believes there’s still heavy desire for social interaction.

So, both those financial and social influences translate to the following: overdelivery.

Operators and their teams must ensure they position their brands well; make guests feel special every visit; and really dial in the guest experience. Specifically, Technomic suggests focusing on younger generations and menus with at least a couple specialty items that aren’t easy for a guest to replicate at home.

In other words, do whatever it takes to entice guests with memorable experience and quality menu items, and keep them coming back for more.

Technology

Multiple industry sources believe that 2023 is the Year of Tech for the hospitality industry. In particular, some sources believe that POS systems will receive significant attention from operators looking to upgrade.

Compellingly, Technomic sees the situation a bit differently. In particular, they’re suggesting that QR code menus may find themselves on the sidelines. Traditional menu, according to Technomic, will make their comeback this year.

Also making a (possible) resurgence? Per Technomic, in-person ordering for carryout and in-person dining.

As far as tech innovations that Technomic expects to take off this year, they see the following as standouts:

  • loyalty programs;
  • enhanced/upgraded cooking equipment;
  • automated inventory software/platforms; and
  • digital menu boards for back of house.

Culinary

As hinted at above, Central and South American cuisines are expected to take off in Canada, per Technomic.

The research firm provides specific—and delicious—examples:

  • Honduras: Baleadas tacos
  • Dominican Republic: Wasakaka sauce
  • El Salvador: Curtido slaw or relish
  • Peru: Aji amarillo and rocoto peppers
  • Bolivia: Saltenas, similar to empanadas

Another culinary trend Technomic predicts will perform well in Canada? Pickled everything.

Okay, maybe not everything. However, Technomic expects “pickling, fermenting, dehydrating and freeze-drying” to “increasingly pop up on menus.” The firm expects that operators will offer a wide range of “unusually pickled items outside of the typical veggies, including proteins and seeds.”

So, if you’re an operator reading this, it may be time to motivate your back-of-house staff to get creative with their pickling ideas.

Finally, pandemic-driven, health-based trend foods like turmeric and ginger may start to fade in popularity. Instead, predicts Technomic, items with “classic” health descriptors such as “natural,” “real,” “free,” “reduced,” and “lower” will get attention from guests looking to eat and drink healthier.

For your own copy of this Technomic report in its entirety, click here.

Image: Roman Odintsov on Pexels

by David Klemt David Klemt No Comments

Top 2022 Grubhub & Uber Eats Drinks

Top 2022 Grubhub and Uber Eats Drink Orders

by David Klemt

Margarita with dehydrated citrus garnish

The year-end Grubhub 2022 Delivered and 2022 Uber Eats Cravings reports identify this year’s delivery order drink trends.

Last week, we dove into Grubhub and Uber Eats’ top food orders. If you haven’t already, read that article here.

This week we’re going to check out what drinks were most popular in 2022 for both platforms.

Top Grubhub Coffee Orders

People are still working from home, full- or part-time. So, it makes sense that consumers are placing coffee orders for breakfast, snack, and lunch dayparts.

  1. Iced Coffee
  2. Hot Coffee
  3. Iced Caramel Coffee
  4. Iced French Vanilla Coffee
  5. Frozen Coffee

Top Grubhub Milk Alternatives

Of course, with coffee orders come milk orders. And as you’re probably well aware, milk alternatives are only growing more popular with consumers.

So, below are the top milk alternatives among 2022 Grubhub users.

  1. Oat Milk
  2. Almond Milk
  3. Coconut Milk
  4. Soy Milk
  5. Cashew Milk

As a possible explanation for the dominance of oat milk, sustainability could be a driver. According to available data, producing a pound of oats is much more sustainable than producing one pound of almonds.

It’s believed that oats are more favorable when it comes to basically every measure of sustainability.

Top Grubhub Alcohol Orders

I can’t say that I’m shocked to find the Margarita is the top cocktail order. It is, after all, the long-reigning Queen of Cocktails.

  1. Beer
  2. Margarita
  3. Hot Sake
  4. Piña Colada
  5. White Wine (Sauvignon Blanc)

I’ll admit that I’m slightly surprised that a red wine isn’t among the top five.

Top Uber Eats Alcohol Orders

Interestingly—perhaps a bit frustratingly—Uber Eats took a different approach to identifying their top drinks.

Rather than dedicating space solely to alcohol orders, their top drinks are part of combinations. As in, the “most frequently paired food + alcohol” combos.

So, here’s their list in its entirety:

  1. Steak + Margaritas
  2. Pizza + White Claw
  3. Burritos + Margaritas
  4. Chicken + Sangria
  5. Wings + Beer

However, there’s another drink in the Uber Eats “most unexpected food combos” section:

  • Ham + Cream Cheese
  • Fruit Roll Up + Hot Cheetos
  • Pickles + Whipped Cream
  • Popcorn + Pickle Juice
  • Dark Chocolate + Tomato Salad
  • Pizza + Applesauce
  • Sushi + Ranch
  • Peanut Butter + Pizza
  • Cheese + Martinis
  • Watermelon + Mustard

Therefore, we can reasonably extrapolate that the top 2022 Uber Eats alcohol orders are the Margarita, White Claw, Sangria, beer, and Martini.

Takeaway

If we compare reports and look for similarities, we see that two drinks are at the top: beer and Margaritas.

Both make sense. Beer, in can, bottle, and growler forms, travels very well. That makes beer ideal for delivery where it’s legal.

And as far as Margaritas go, there’s a wide array of canned options available. Again, canned cocktails travel well for delivery. Of course, restaurants and bars can also obtain the equipment to prebatch and package their signature Margaritas.

Ideally, your POS system can run reports to identify which drink orders are most popular for your delivery customers. Also ideal: operators should take as much control over their business as they can, implementing direct delivery as long as it’s feasible.

So, look into direct delivery, run your reports, and take more control while reducing costs.

Image: Edward Howell on Unsplash

by David Klemt David Klemt No Comments

Canada’s Top 2022 DoorDash Orders

Canada’s Top 2022 DoorDash Orders

by David Klemt

Burgers, French fries and milkshakes

Operators curious about the most popular delivery items in 2022 will be happy to learn that DoorDash’s year-end report is ready for viewing.

Those who want to compare it to predictions from several sources earlier this year can click here. The DoorDash Canada report can also be compared to consumer trends in Canada revealed back in October.

Before we jump in, I’m not detailing the DoorDash report in its entirety here. To review the entire report, please click here.

Instead, I’ll be sharing the top takeaways in terms of top menu items; top cuisines; and top items by province.

Speaking of provinces, a word to New Brunswick, Newfoundland and Labrador, Northwest Territories, Nova Scotia, Nunavut, Prince Edward Island, and the Yukon. Please don’t break out the pitchforks and come for me for not including you in this article. DoorDash’s report only covers data from six provinces—I didn’t leave you out intentionally.

Top DoorDash Cuisines in Canada

  1. American
  2. Mexican
  3. Japanese
  4. Thai
  5. Mediterranean
  6. Indian
  7. Chinese
  8. Italian
  9. Korean
  10. Filipino

Top DoorDash Items in Canada

  1. Burgers & Fries
  2. Fried Chicken
  3. Poutine
  4. Sushi Rolls
  5. Chicken Wings
  6. Burritos
  7. Chicken Rice Bowl
  8. Shawarma Wraps
  9. Curry
  10. Pad Thai

I think there’s one key takeaway that stands out in regards to this list. Notably, it appears that while chicken isn’t number one, it’s undeniably popular amongst Canadian DoorDash users.

In fact, according to DoorDash data, chicken reigns supreme in British Columbia. When you reach the province-specific sections below, you’ll see how powerful the cravings in BC are for chicken.

Top DoorDash Late-night Items

Again, chicken rules the DoorDash roost in this category.

  1. Chicken Nuggets
  2. Fries
  3. Poutine
  4. Chicken Wings
  5. Chicken Burgers
  6. Apple Pie
  7. Cheeseburger
  8. Spinach & Cheese Dip
  9. Chocolate Fudge Sundae
  10. Crispy Chicken

Top DoorDash Items: British Columbia

  1. Burrito Bowl
  2. Szechuan Chicken Lettuce Wraps
  3. Butter Chicken
  4. California Roll
  5. Crispy Chicken Sandwich
  6. Tofu Bowl
  7. Chocolate Chip Cookies

Top DoorDash Items: Ontario

  1. Cheeseburger
  2. Coffee
  3. Burrito Bowls
  4. Chicken Shawarma
  5. Crispy Chicken
  6. Bagels
  7. Pad Thai
  8. Beef Patty
  9. Pizza
  10. Onion Rings

Top DoorDash Items:Alberta

  1. Spinach and Cheese Dip
  2. Chicken Cheddar Sandwich
  3. Chilli Chicken
  4. Kale Salad
  5. Margarita Pizza
  6. Hot Apple Turnover

Top DoorDash Items: Québec

  1. Poutine
  2. Cappuccino
  3. Pad Thai
  4. Steak and Cheese
  5. Croissant
  6. Dumplings
  7. Chips
  8. Tacos

Top DoorDash Items: Saskatchewan

Interestingly, a beverage item holds the top spot in Saskatchewan.

  1. Bubble Tea
  2. Pepperoni Pizza
  3. Pork Bun
  4. Crispy Pork
  5. Garlic Bread
  6. Pasta

Top DoorDash Items: Manitoba

  1. Fries
  2. Butter Chicken
  3. Red Velvet Cake
  4. Poke Bowl
  5. Shawarma Wrap

As I stated in Wednesday’s article detailing Grubhub and Uber Eats’ reports for the US, we believe operators should take as much control over their restaurants and bars as possible. At KRG Hospitality, that means implementing direct delivery if it makes sense: ease of use, delivery capabilities, favorable costs, etc.

It’s also helpful to know what consumers in your area are craving and ordering. Such information can provide a useful baseline for many concepts’ menu development.

Image: John Fornander on Unsplash

Top