Data

by David Klemt David Klemt No Comments

Grubhub and Uber Reveal Top 2022 Items

Grubhub and Uber Reveal Top 2022 Items

by David Klemt

Chef pointing burrito halves toward camera

Grubhub’s 2022 Delivered and Uber Eats’ 2022 Uber Eats Cravings reports are live and there’s one surprise that’s immediately evident.

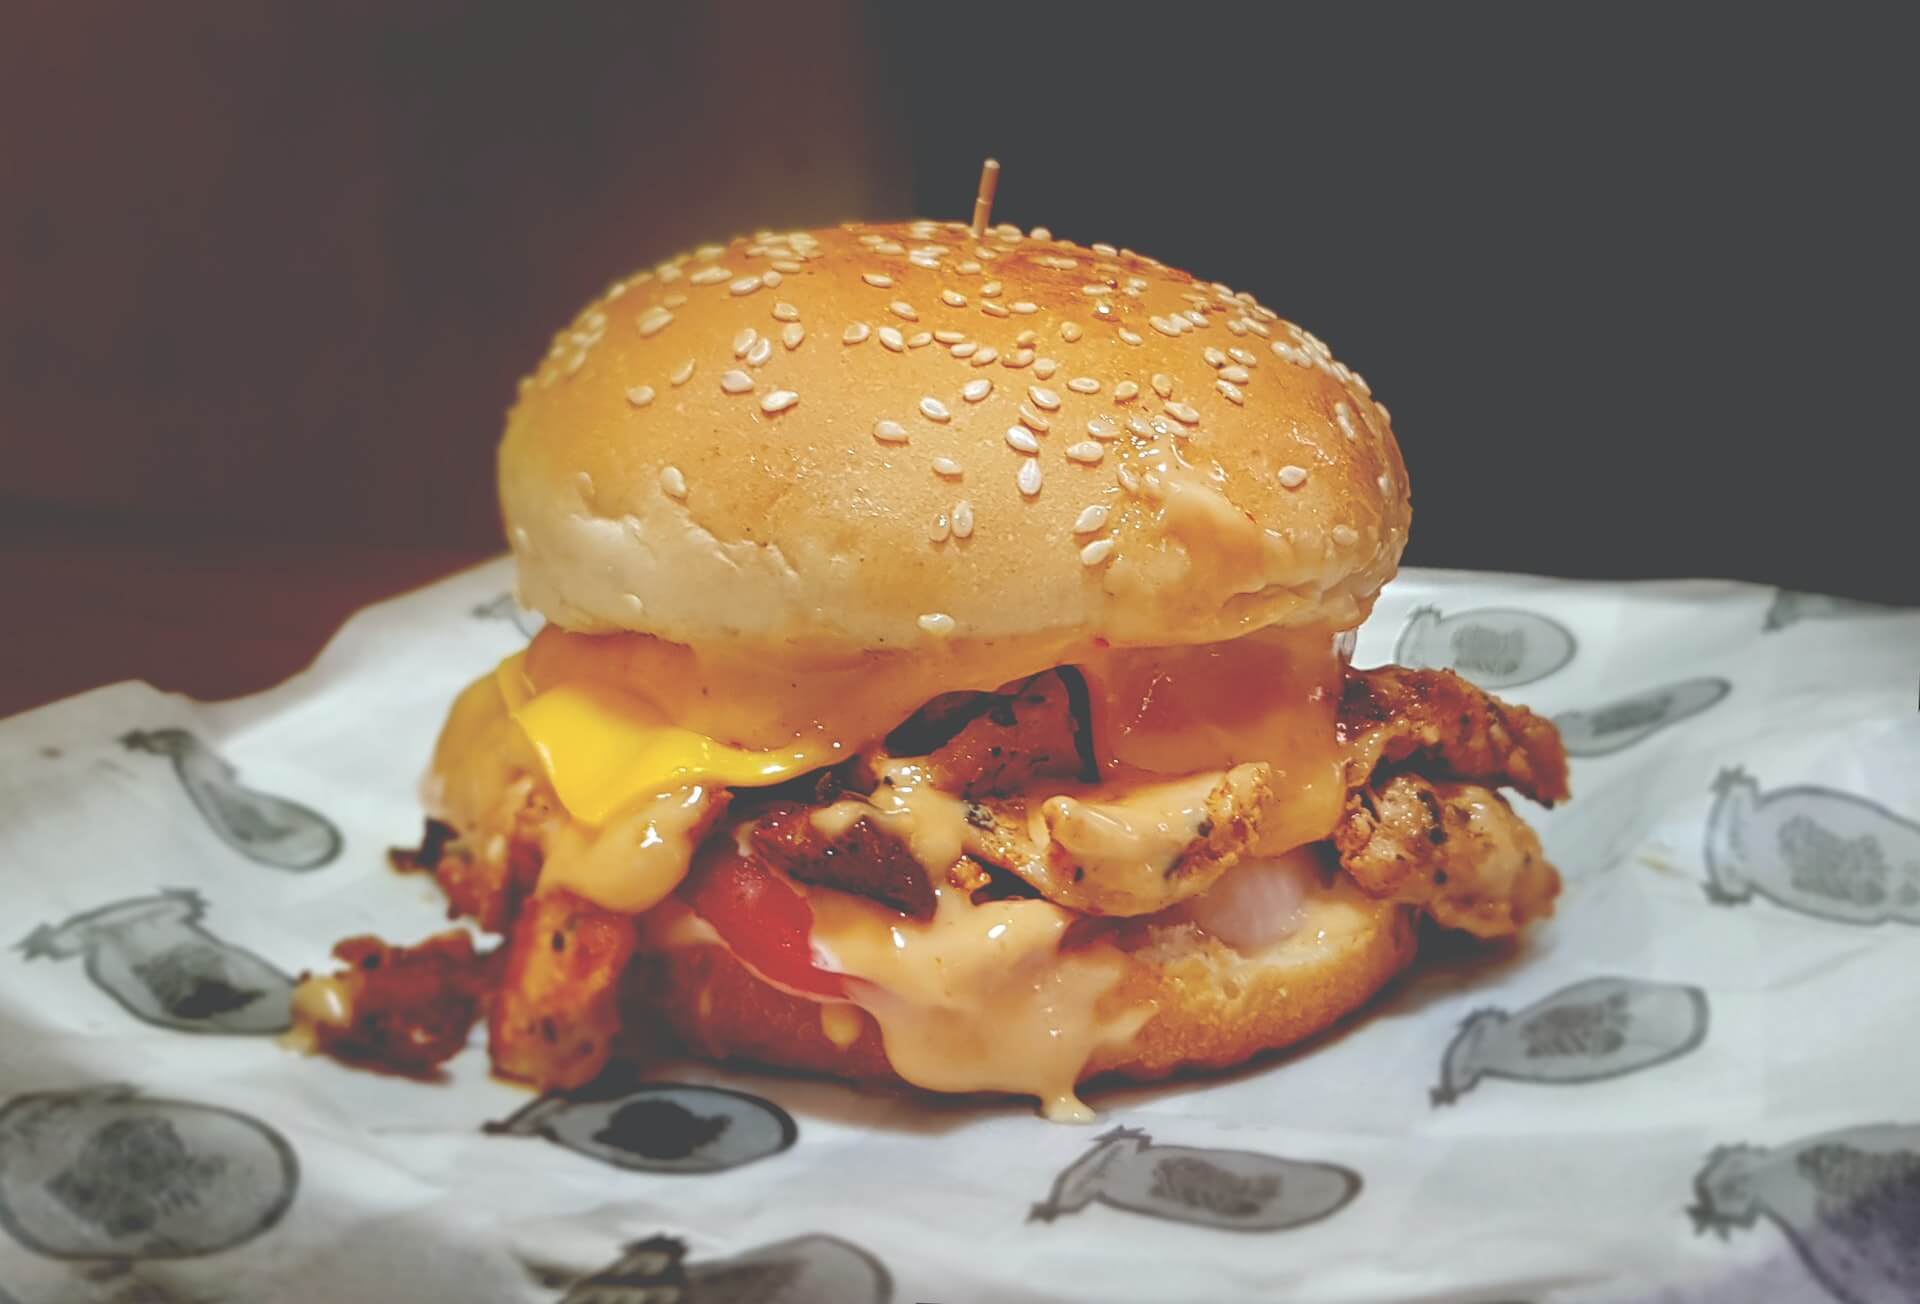
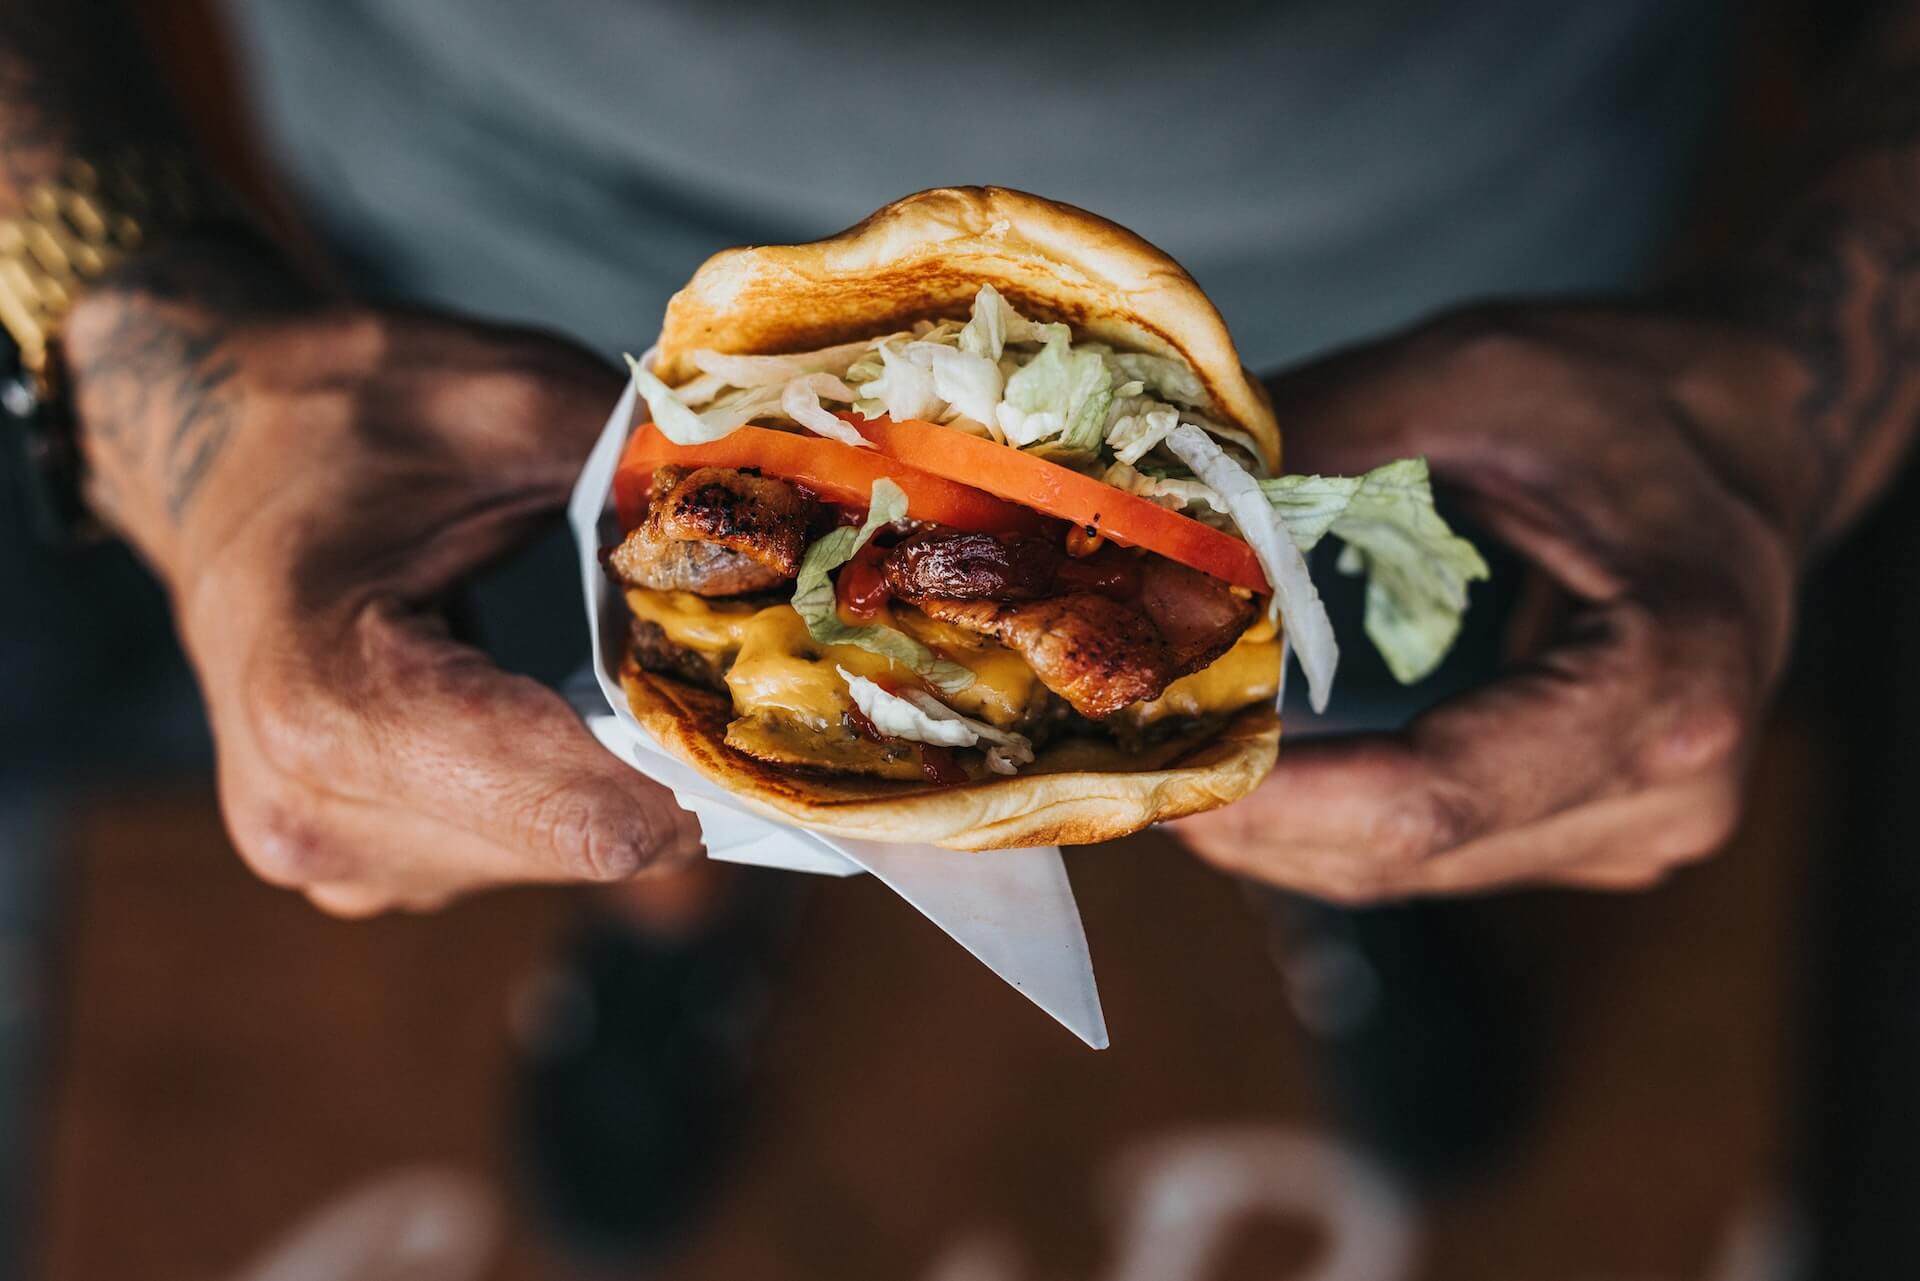
The top food item lists for both platforms make one thing clear right away: the chicken sandwich is no longer sitting on its throne.

Instead, as far as the data for these two delivery powerhouses show, there’s a new food item king. More compellingly, this menu item holds the throne on both platforms.

Now, I’m not suggesting the fried chicken sandwich is in the dungeon. In fact, the popular sandwich causing “wars” in the QSR space is still holdings it own. Indeed, the sandwich is still in the top five overall at Uber Eats.

Shockingly, it’s not in the top five overall at Grubhub. However, the fried chicken sandwich is among the top five Grubhub lunch and late-night orders.

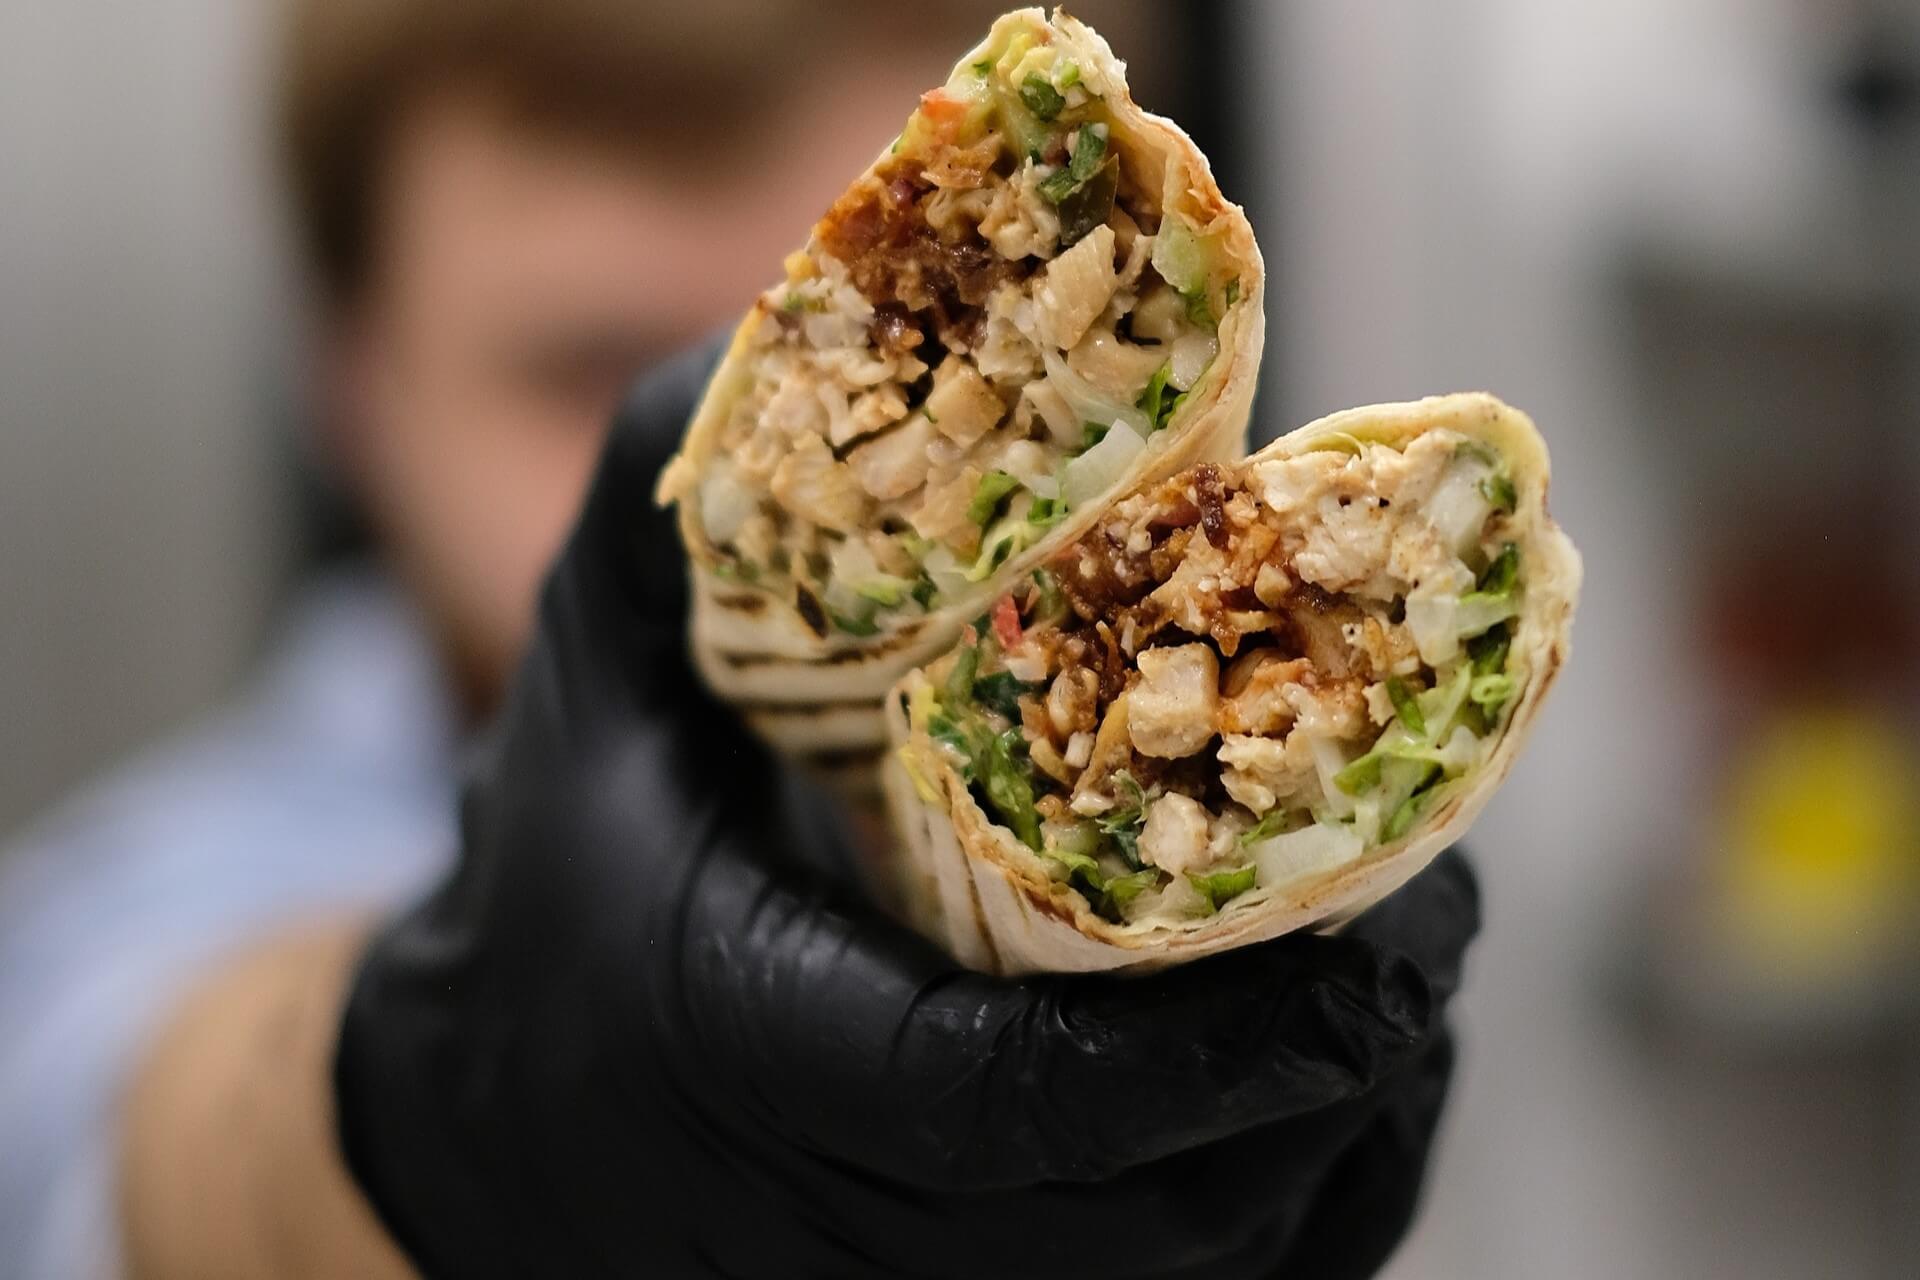
So, which menu item wears the crown for 2022 in the kingdoms of Grubhub and Uber Eats? The burrito.

That’s awesome news for most operators. Much like the humble but mighty chicken sandwich, concepts can put their signature spin on a burrito. In fact, most concepts can put multiple signature spins on the new king of delivery items. One way to approach this would be to create a permanent signature and then seasonal LTOs.

Top 10 Grubhub Items

In 2022, the fried chicken sandwich only clinches the number seven spot at Grubhub.

Just like Uber Eats, cheeseburgers and pizza outperform the chicken sandwich.

  1. Burrito (bowl or regular)
  2. Cheeseburger
  3. Cheese Pizza
  4. Pad Thai
  5. Chicken Quesadilla
  6. California Roll
  7. Fried Chicken Sandwich
  8. Caesar Salad
  9. Chicken Tikka Masala
  10. Boneless Wings

Top 5 Grubhub Breakfast Items

  1. Sausage, Egg + Cheese Sandwich
  2. Donuts
  3. Sausage Burrito
  4. Bagel with Cream Cheese
  5. Muffins

Top 5 Grubhub Lunch Items

  1. Burrito
  2. Cheeseburger
  3. Fried Chicken Sandwich
  4. Cheese Pizza
  5. Chicken Quesadilla

Top 5 Grubhub Late-night Items

  1. Chicken Quesadilla
  2. Fried Chicken Sandwich
  3. Cheeseburger
  4. Mozzarella Sticks
  5. Cheese Pizza

As we see, the chicken quesadilla does some heavy lifting at Grubhub. The item holds the number five spot overall, at lunch, and during the late-night daypart.

Top 10 Uber Eats Combos

For their 2022 report, Uber Eats takes a different approach than Grubhub. Instead of just listing individual items, the platform identifies their top combos.

  1. Burrito + Cheese
  2. French Fries + Salt
  3. Cheeseburger + Diced Onions
  4. Chicken Sandwich + Fries
  5. Breakfast Sandwich + American Cheese
  6. Soup + Bread
  7. Pancakes + Sausage
  8. Pizza + Mozzarella
  9. Salad + Balsamic Vinaigrette
  10. Quesadilla + Sour Cream

Most “Unexpected” Uber Eats Combos

  • Ham + Cream Cheese
  • Fruit Roll Up + Hot Cheetos
  • Pickles + Whipped Cream
  • Popcorn + Pickle Juice
  • Dark Chocolate + Tomato Salad
  • Pizza + Applesauce
  • Sushi + Ranch
  • Peanut Butter + Pizza
  • Cheese + Martinis
  • Watermelon + Mustard

To read both reports in their entirety, click here for Grubhub and here for Uber Eats. There are more insights, including beverages and beverage combos.

Of course, longtime readers and our clients know where we stand on third-party delivery platforms. Ideally, operators should take as much control over their business as they can. For us, that means implementing direct delivery as long as it’s feasible and incurs lower costs than third-party.

We view delivery platform reports as menu development resources. It’s always wise to keep up to date on consumer and food trends, after all.

Image: Kamila Bairam on Pexels

by krghospitality krghospitality No Comments

KRG Unveils 2023 Start-Up Guide

KRG Hospitality Unveils 2023 Restaurant Start-Up Cost Report + Checklist

2023 KRG Hospitality Start-up Costs Guide

KRG HOSPITALITY RELEASES FIFTH ANNUAL RESTAURANT START-UP COST REPORT + CHECKLIST

Toronto-based hospitality industry consulting firm with offices in key markets throughout Canada and the United States of America unveils their latest restaurant cost report, milestone checklist, and interactive hospitality calculator.

December 15, 2023 (TORONTO)—Today, KRG Hospitality unveils their 2023 Restaurant Start-up Cost Report + Checklist. The Toronto-based consulting firm specializes in startup restaurant and bar projects along with boutique hotels, experiential concepts, and entertainment venues. KRG also has offices in key markets throughout the United States of America.

For the past five years KRG has researched, reviewed, and published the annual start-up cost guide, one of the industry’s leading resources dedicated to restaurant project costing.

And each year this informative and transparent guide is used as a trusted budgeting tool by developers, lenders, contractors, consultants, and aspiring restaurateurs. The guide is founded upon KRG Hospitality’s proprietary database of previous project costs, which includes project data from restaurants, bars, and cafes developed over the past 24 months.

Further, this annual KRG Hospitality also includes a start-up checklist that identifies an array of crucial milestones: KRG president Doug Radkey has identified 500 unique tasks that must be completed for a successful restaurant opening.

This year’s checklist reveals a number of these crucial tasks. Updated for 2023, the guide also includes the interactive KRG Hospitality Calculator.

The costs to start a restaurant have been on a steady rise over the past 5 years. Major drivers are increases in inflation, interest, labor, construction, equipment. Of course, there are also the unique materials required to deliver a scalable, sustainable, memorable, profitable, and consistent on-premise, off-premise, or hybrid-style concept.

Drawing upon this comprehensive guide, an industry-leading expert has analyzed the information and provided a succinct and user-friendly summary of the findings for each major start-up category. This isn’t simply a couple of pages identifying a few costs. Rather, the fifth annual guide is a deep dive that provides real insight into what to expect in 2023.

The Checklist

As stated, there are 500 unique tasks an operator needs to complete over the course of developing and opening the doors to their concept.

To make it simple to navigate, the 2023 checklist is organized into sections: Planning & Admin, the Support Team, Site Development, Operations Development, Brand Development, and Team Development.

From starting off with the targeted, customized, and in-depth feasibility to planning and executing the soft opening, KRG identifies dozens of key milestones in this year’s guide.

Download your copy of the 2023 KRG Hospitality Restaurant Start-up Cost Report + Checklist today! Click here.

About KRG Hospitality

KRG Hospitality is a storied and respected agency with proven success over the past decade, delivering exceptional and award-winning concepts throughout a variety of markets found within Canada, the United States, and abroad since 2009. Specializing in startups, KRG is known for originality and innovation, rejecting cookie-cutter approaches to client projects. The agency provides clients with a clear framework tailored to their specific projects, helping to realize their vision for a scalable, sustainable, profitable, memorable, and consistent business. Learn more at KRGHospitality.com. Connect with KRG Hospitality and the Bar Hacks podcast on social: KRG Twitter, Bar Hacks Twitter, KRG Media Twitter, KRG LinkedIn.

Disclaimer

While using this guide helps develop a rough preliminary financial and strategic milestone plan, it is strongly recommended that you seek professional expert advice to provide you with a more precise, project specific estimate as each concept and market will be slightly different. KRG Hospitality Inc. is not responsible for any project that is not currently under contract within the company.

Image: KRG Hospitality
by David Klemt David Klemt No Comments

Top 10 US Metro Areas by Inflow, Q3 2022

US Metro Areas with Greatest Outflow and Inflow, Q3 2022

by David Klemt

Tower Bridge in Sacramento, California

Real estate brokerage Redfin identifies the top ten American cities in terms of inflow and outflow, according to Q3 data.

Interestingly, a quarter of people appear to be searching for homes in cities different from where they currently live. Also compelling: one state, per the brokerage’s data ending in the month of October, is a clear favorite.

Obviously, this is important data for operators to have. When it comes to labor and guest pool changes, inflow and outflow information can be quite useful.

Top Inflow Cities: August to October 2022

Review the list below to see the metro areas experiencing the greatest inflow.

  1. Orlando, Florida
  2. Dallas, Texas
  3. North Port, Florida
  4. Cape Coral, Florida
  5. Phoenix, Arizona
  6. Tampa, Florida
  7. San Diego, California
  8. Miami, Florida
  9. Las Vegas, Nevada
  10. Sacramento, California

Did you spot the big trend? The state of Florida represents 50 percent of the list. Per Redfin‘s interpretation of the data, home buyers want leave expensive coastal cities behind.

Interesting to us in particular, two cities—Las Vegas and Orlando—are key KRG Hospitality markets. Also interesting is that Nevada and Florida are on the back half of Forbes’ best cities for starting a business in 2023.

However, we’ve seen strong hospitality industry recovery in Las Vegas this year. In fact, even the entertainment industry in Las Vegas is exploding. Additionally, we continue to gain clients in Orlando.

Top Outlow Cities: August to October 2022

Below are the metro areas seeing the greatest outflow.

  1. Philadelphia, Pennsylvania
  2. Seattle, Washington
  3. Denver, Colorado
  4. Detroit, Michigan
  5. Chicago, Illinois
  6. Boston, Massachusetts
  7. Washington, DC
  8. New York, New York
  9. Los Angeles, California
  10. San Francisco, California

If we compare Redfin’s Q2 data to the list above, it’s mostly the same. In fact, the top four outflow cities are identical. Spots five through nine are simply a reshuffling of Q2 and Q3 data.

However, Minneapolis, number ten in Q2, is replaced by Philadelphia in Q3. According to Redfin data, those Philly residents searching for homes elsewhere are showing interest in Salisbury, Maryland.

Consider how expensive it can be to move to and live in LA and San Francisco. It makes sense that California is the only state with two cities on the list above, doesn’t it?

Per Redfin, San Francisco residents are searching Sacramento and Seattle. Those in LA are looking at San Diego and Las Vegas.

Takeaway

It’s important to know where people are moving to and what cities they’re leaving behind. And it’s interesting to get a data-driven view of which states may be best for starting a business.

However, it’s far more useful to know how feasible a given ZIP code may be for a specific concept. So, while these types of lists are helpful, they’re not as practical as a targeted feasibility study.

Moreover, the dust doesn’t appear to have settled when it comes to migratory patterns of home buyers. It’s quite possible that Redfin’s 2023 inflow and outflow data will change once again in Q1 and Q2.

Image: Stephen Leonardi on Unsplash

by David Klemt David Klemt No Comments

The NRA’s 2023 Culinary Trend Forecast

The National Restaurant Association’s 2023 Culinary Trend Forecast

by David Klemt

Cheesy chicken sandwich on paper wrapper

Ahead of the beginning of a new year, the National Restaurant Association unveils their culinary trend predictions for 2023.

The report is the result of a collaboration between the NRA, Technomic, and the American Culinary Federation (ACF).

For those unfamiliar, Technomic is at the forefront of foodservice trend tracking, industry research, and analysis. Likewise, the ACF is a premier industry organization. Tracing its founding to 1929, the ACF promotes “the professional image of American chefs worldwide through education of culinarians at all levels.”

To predict what will be “hot” next year, the NRA, Technomic, and ACF sent the 17th annual What’s Hot survey to thought leaders and chefs. In direct partnership with the Technomic Menu Research & Insights Division, the NRA predicted the top menu trends from 110 items spanning 11 categories.

Now, this isn’t a full dive into the report in its entirety. Rather, we strongly encourage our readers to download a copy of What’s Hot 2023 Culinary Forecast for themselves and their teams.

What readers will find below are the top 10 trends for 2023. Additionally, we’ll share the top three macro trends for next year, as forecast by the NRA and their partners.

More than Food

Somewhat surprisingly, the NRA’s top-ten list of culinary trends isn’t just a list of food items. Instead, this forecast paints a picture of where restaurants are heading in 2023.

While there are some specific cuisine predictions, the NRA’s top culinary predictions show us, in part, how consumers want to experience the restaurants they visit.

  1. Southeast Asian cuisines (examples: Vietnamese, Singaporean)
  2. Zero waste/Sustainability/Upcycled foods
  3. Globally inspired salads
  4. Sriracha variations
  5. Menu streamlining
  6. Flatbread sandwiches/Healthier wraps
  7. Comfort fare
  8. Charcuterie boards
  9. Fried chicken sandwiches and Chicken sandwiches “3.0” (example: fusion of flavors)
  10. Experiences/Local culture and community

As we can see, operators and consumers expect tighter, more concept-specific menus. Also, comfort foods; shareable (and “Instagrammable”) items like charcuterie boards; and items that show local and global influences may be hot in 2023.

One can consider, then, streamlining their menu to include their top sellers along with local and/or global flavors authentic to their brand.

Below, readers will see that three of the trends above make up the NRA’s top-three 2023 macro trends:

  1. Menu streamlining
  2. Comfort fare
  3. Experiences/Local culture and community

Operator and Consumer Behavioral Shifts

Looking at the macro trends, it’s reasonable to believe the past few years will influence 2023 heavily.

Operators are dealing with inflation, higher costs for everything, labor shortages. Further, according to Datassential, more than a third of American operators are experiencing low traffic and sales levels.

We can expect these issues to follow us into 2023, at least for Q1 and Q2. Therefore, the NRA’s macro trends forecast makes sense. Streamlining menus often leads to streamlining the back and front of house. In turn, doing so can lower costs and boost staff retention.

On the consumer side, it appears comfort foods, chicken sandwiches, and experiences are driving visits and online orders. These are, as we all know, behavioral shifts we can trace back to the start of the pandemic.

We always suggest proceeding with caution, logic, and data when considering embracing trends. Missing out on trends can be just as costly as latching onto a trend too late.

That said, the macro trends certainly seem reasonable. Only time will tell, but the NRA’s 2023 forecast certainly contains several items operators and their teams should give serious consideration.

Image: Arabi Ishaque on Unsplash

by David Klemt David Klemt No Comments

Traffic Up but Margins Thinner

Traffic Up but Margins Thinner

by David Klemt

Chef checking tickets

The One Table 2022 report from Datassential focuses on the state of the operator and what the industry can expect moving forward.

This informative report shares survey results from 801 operators across America. While some of the findings are positive, it’s clear many operators are enduring significant challenges.

For some, traffic and sales are up. However, that’s not the situation others find themselves in.

To download and review the Datassential One Table 2022, please click here.

The Respondents

For this report, Datassential shares the survey answers from 801 respondents.

Most survey respondents are independent operators. In fact, they account for 71 percent of the participants. Making up the rest of the field are chain operators (15 percent) and franchise operators (14 percent).

As far as segment types, the majority of survey participants operate in the fast-casual space (18 percent). Unsurprisingly, fine dining is the smallest group of respondents at six percent. Thirteen percent operate midscale restaurants, and 12 percent are at the helm of casual-dining concepts. Somewhat surprisingly, just ten percent of participants operate QSRs.

Interestingly, the service format is fairly even among survey participants. Fifty-three percent of operators are full-service and 47 percent are limited-service.

Similarly, survey respondents represent the country’s regions pretty evenly:

  • South: 30 percent
  • Midwest: 29 percent
  • Northeast: 21 percent
  • West: 20 percent

In terms of market type, most respondents operate in the suburbs (49 percent). Following somewhat closely are urban-market operators, at 31 percent. Just 20 percent of survey participants operate in rural markets.

Traffic, Sales and Margins

At first glance, Datassential’s survey reveals positive news.

Now, I’m sure people find the terms “pandemic, “pre-pandemic,” and “post-pandemic” exhausting at this point. However, there’s no denying we continue to feel the aftershocks sent through the industry by the pandemic.

So, how do things look now in comparison to pre-pandemic traffic and sales levels?

First, the positives. Nearly half of survey respondents—47 percent—say their traffic is up in comparison to where it was pre-pandemic. Add to that the 14 percent who say their traffic is the same and 61 percent of operators appear to be in good shape.

In terms of sales, 51 percent of survey participants have good news. That news is that their sales are higher in comparison to pre-pandemic levels. Again, add the 14 percent who don’t see any change. So, that’s 65 percent of operators who appear to be performing well.

But with the good there’s bad. Unfortunately, 39 percent of respondents report lower traffic than pre-pandemic levels. And sales are lower than they were before the pandemic for 35 percent of survey participants.

Operator margins are lower for all respondents. Generally speaking, the profit margin for operators before the pandemic sat at 21 percent. Now, the average is 13 percent. QSRs and fast-casual restaurants are a bit higher among survey respondents: 17 percent and 15 percent, respectively.

On paper things do look up for many operators. However, the industry is still suffering, with a third struggling to rise to even pre-pandemic levels of traffic and sales.

Image: Daniel Bradley on Unsplash

by David Klemt David Klemt No Comments

Is There Demand for Non-alcohol?

As the Holidays Approach, is There Demand for Non-alcohol?

by David Klemt

Friends toasting with pink drinks

There’s no denying that non-alcohol is a growing beverage category, but does the data support the hype and operator consideration?

A report by behavioral research firm Veylinx offers compelling insight into non-alcohol and consumers.

By now, there’s really no excuse for failing to give non-alc serious consideration. When planning menus, operators should treat non-alc as much more than an afterthought.

Admitting fully that I’m repeating myself, giving alcohol-free beverages the same attention as their full-proof counterparts is crucial. Doing so is smart business; non-alc is capable of driving traffic and revenue.

And then there’s the guest experience element of the non-alc equation. Hospitality is about service, about ensuring every guest is comfortable. Giving guests who are abstaining from alcohol consumption a different experience than others isn’t hospitality—it’s alienation. Not only is that the antithesis of hospitality, it’s bad business.

Reviewing Veylinx data shows that non-alc is worthy of operators’ time and consideration. In my opinion, it’s even more important that non-alc menus and offerings be dialed in now. After all, the end-of-year holidays on our doorsteps.

The infamous Busiest Bar Night of the Year is nearly here. From November 23 through New Year’s Eve, people will be meeting up with family and friends. Many will also be seeking an escape from the stress of those gathering and the holidays.

Non-alcohol by the Numbers

One of the most important points made by Veylinx is this: Abstinence from alcohol isn’t limited to “social media” events like Dry January and Sober October.

Rather, consumers are choosing to abstain from alcohol throughout the year for myriad reasons. Specifically, Veylinx data reveals that more than 75 percent of Americans have abstained from alcohol consumption at some point for at least one moment.

Further, 46 percent of Americans plan to reduce their consumption of alcohol “right now.” As in, the holidays may be upon us but they’re actively working on a plan to drink less, not more.

Two major factors motivating this behavioral change are mental well-being and physical health. In service of those factors, more than half of LDA drinkers in America plan to replace beverage alcohol with non-alc beverages.

Interestingly, Veylinx finds that these consumers will pay more for non-alc alternatives in comparison to the general population.

Drilling down further, this shift in consumer behavior appears to be driven by a handful of consumer types:

  • 21- to 35-year-old consumers;
  • “light” drinkers; and
  • consumers who have set aside alcohol consumption for one month or more.

Speaking of the first group, demand for RTDs is 48 percent greater in comparison to those aged 35 or older. Add CBD to RTD and the demand among the 21 to 35 cohort grows by 18 percent.

However, not all non-alc growth comes from the 21-to-35 group. Non-alc beverages with mood boosters see an increase in demand from the 35-plus group of 29 percent.

In short, if an operator is ignoring the non-alc consumer, they’re harming their own business and reputation. Alcohol-free RTDs, cocktails, beer, and wine are growing.

Savvy operators will leverage that growth.

Image: Helena Yankovska via Unsplash

by David Klemt David Klemt No Comments

These are the Happiest Provinces in Canada

These are the Happiest Provinces in Canada

by David Klemt

Newfoundland and Labrador during daytime

If you’re wondering which province in Canada is the happiest, Statistics Canada has the answer—and the happiest may surprise you.

Of course, those who live and work in the happiest province won’t find it shocking. After all, they’re largely happy to be there.

However, if you expect the happiest province to be the home of Toronto, Vancouver, Montreal or Canada… Well, you’re in for a surprise.

Earlier this week we took a look at the happiest cities and states in America. Congratulations Fremont, California, and Hawaii, respectively. To learn where 181 other cities and 49 states rank, please click here.

The Happiness Survey

Or more accurately, the “life satisfaction” survey. For this survey, that’s what Statistics Canada reveals: life satisfaction.

Interestingly, the survey is very simple. Apparently, Statistics Canada simply asked participants to rate the satisfaction of living in their province, zero through ten. For this survey, zero is least satisfied, ten is most.

Ages 15 through 75 (and older) were able to participate. The survey was also broken down to gauge the satisfaction of men and women.

Before we jump into the breakdown of province satisfaction or happiness, some good news. Reviewing the Statistics Canada data, most participants across all age groups are happy. In fact, age groups 65 to 74 and 75-plus appear to be happiest.

On the other side, ages 15 to 54 had the most people who rated their life satisfaction between zero and five. Even so, just over 20 percent of survey respondents rated their satisfaction a five or less.

So, on the whole, Canadians seem satisfied or happy with their lives, regardless of the province in which they live. Personally, I find that to be great news.

The Happiest Province

Okay, let’s dive into the reason you’re here: to learn which province is the happiest.

  1. Newfoundland and Labrador
  2. Prince Edward Island
  3. Quebec
  4. New Brunswick
  5. Manitoba
  6. Alberta
  7. Saskatchewa
  8. Nova Scotia
  9. Ontario
  10. British Columbia

The above rankings are determined by the percentage of survey respondents who rated their life satisfaction eight, nine or ten. So, if you’re in Newfoundland and Labrador, Prince Edward Island or Quebec, wow—you’re apparently one incredibly happy person.

Conversely, below you’ll find the rankings as determined by the largest percentage of respondents who rated their satisfaction a five or lower. As you’ll find, the list below isn’t simply the inverse of the one above.

  1. Ontario
  2. British Columbia
  3. New Brunswick
  4. Alberta
  5. Nova Scotia
  6. Prince Edward Island
  7. Manitoba
  8. Saskatchewa
  9. Quebec
  10. Newfoundland and Labrador

As far as Canada overall, the results of this particular survey are positive. Just 19.4 percent of survey respondents rated their satisfaction or happiness zero through five. And only 28.9 percent provided a rating of six or seven.

More than half of Canadians, 51.7 percent, rate their lives an eight, nine or ten. That’s some great and welcome news.

Image: Erik Mclean on Unsplash

by David Klemt David Klemt No Comments

Which Cities and States are the Happiest?

Which US Cities and States are the Happiest?

by David Klemt

Yellow smiley face ball

As an entrepreneur and operator evaluating a market for a first location or expansion, it can help to know where people are happiest.

Equally as helpful: Knowing the cities and states that are the least happy. Not, necessarily, so an operator can avoid these markets.

Rather, one’s concept may be a ray of stress-free sunshine for a given community. Providing a great workplace with a positive culture can work wonders for both the happiest and least-happy places. And as the cornerstones of the communities they serve, restaurants and bars can improve their guests’ quality of life.

We’ve looked at the US cities with the greatest inflow and outflow (which can reveal happiness levels), as identified by Redfin. And we’ve checked out the best US retirement cities, researched by Clever.

Now, we’re taking a look at which US cities and states are the happiest and least happy, according to WalletHub. In case you’re unaware, personal finance site WalletHub researches a vast array of topics. You can browse them here.

Happiest Cities

While determining which are happiest, WalletHub identified the happiest 182 cities. Obviously, that’s a far cry from how many cities are in the US.

According to one source, there 19,495 cities, towns, and villages across the country (per data from 2018). Of those, 4,727 cities have populations of 5,000 or more. A total of 310 cities have populations of at least 100,000, and only ten are home to one million people or more.

So, living in any of the 182 cities WalletHub suggests one is pretty happy. However, these are the ten happiest cities, in descending order:

  1. Fremont, California
  2. Columbia, Maryland
  3. San Francisco, California
  4. San Jose, California
  5. Irvine, California
  6. Madison, Wisconsin
  7. Seattle, Washington
  8. Overland Park, Kansas
  9. Huntington Beach, California
  10. San Diego, California

As you can see, six of the 10 cities are in California. In fact, 29 of the 182 cities on this list are located in the Golden State.

To create their list, WalletHub analyzed several metrics that make up three main categories: emotional and physical well-being; work environment; and community and environment.

Fremont, CA, is number one for emotional and physical well-being. The top spot for work environment goes to San Francisco, CA. And the number-one city for community and environment is Casper, Wyoming, which is number 79 on the list overall.

Least-happy Cities

Again, understanding that there are more than 19,400 cities, towns, and villages in the US alters the context of this list a bit.

Living and operating in one of these 182 cities indicates a person is living in a happy city. Basically, it isn’t the worst place to live if it’s on this list.

At any rate, let’s look at the 10 cities that make up the bottom of WalletHub’s list. Or, the “least-happy” cities, at least as far as these rankings are concerned.

  1. Detroit, Michigan
  2. Gulfport, Mississippi
  3. Memphis, Tennessee
  4. Huntington, West Virginia
  5. Montgomery, Alabama
  6. Cleveland, Ohio
  7. Augusta, Georgia
  8. Fort Smith, Arizona
  9. Mobile, Alabama
  10. Shreveport, Louisiana

Happiest States

WalletHub also ranked 50 states to determine the happiest and least happy. I checked, and, yep, that’s all of ’em! I will say it’s a bit disappointing they didn’t include Puerto Rico, but it isn’t the 51st state (yet).

WalletHub focused on 30 metrics to rank the states, which make up three main categories: emotional and physical well-being; work environment; and community and environment.

In descending order, the happiest states in America are:

  1. Hawaii
  2. Maryland
  3. Minnesota
  4. Utah
  5. New Jersey
  6. Idaho
  7. California
  8. Illinois
  9. Nebraska
  10. Connecticut

Hawaii doesn’t just take the top spot overall, it also claims number one for emotional and physical well-being. Utah takes first for work environment, and community and environment.

Rounding out the “happiest half” of the US are:

  1. Virginia
  2. South Dakota
  3. North Dakota
  4. Massachusetts
  5. New Hampshire
  6. Iowa
  7. Delaware
  8. Florida
  9. Georgia
  10. North Carolina
  11. Wisconsin
  12. Washington
  13. New York
  14. Maine
  15. Wyoming

Least-happy States

Conversely, the following are the least-happy states, starting with the unhappiest:

  1. West Virginia
  2. Louisiana
  3. Arkansas
  4. Kentucky
  5. Alabama
  6. Mississippi
  7. Oklahoma
  8. Tennessee
  9. New Mexico
  10. Missouri

Filling out the least-happy half of the country are:

  1. Alaska
  2. Michigan
  3. Ohio
  4. Indiana
  5. Texas
  6. Nevada
  7. Vermont
  8. South Carolina
  9. Kansas
  10. Arizona
  11. Colorado
  12. Montana
  13. Rhode Island
  14. Pennsylvania
  15. Oregon

In terms of the three metrics WalletHub analyzed, West Virginia is ranked last for emotional and physical well-being. Unfortunately, Mississippi is last for work environment. And Texas comes in last for community and environment.

Image: chaitanya pillala on Unsplash

by krghospitality krghospitality No Comments

2023: Year of the POS Systems?

2023: Year of the POS Systems?

by David Klemt

SpotOn POS system on laptop

Image from SpotOn press release

According to SpotOn, the industry could be in for a tech revolution next year as independent operators pursue more powerful POS solutions.

The results of a survey conducted by the cloud-based POS platform are rather revealing. In an effort to better understand where the industry is heading, SpotOn surveyed 300 independent and small-chain restaurant operators.

Both full-service and limited-service (LSR) concept operators participated in this SpotOn survey. Intended to identify the challenges operators face currently, the results reveal much more.

Below, the picture these survey results paint for the industry.

Legacy vs. Innovation

This isn’t the first time I’ve stated the following: Our industry hasn’t been the fastest to implement new technology.

However, we did appear to turn that around in 2021. Now, heading into 2023, our industry may be pursuing cutting-edge tech solutions even more fervently. Today’s guest expects more tech, and your team likely wants access to more modern tech that makes their jobs easier.

Per SpotOn’s survey, 81 percent of independent operators still use so-called “legacy” POS systems. These are “traditional” systems from companies that have been around for quite some time.

It’s not difficult to understand why the vast majority of independent operators continue using legacy systems:

  • Investing in a new platform requires expenditures of money and time.
  • Introducing a new POS platform requires staff training.
  • Staff need to grow adept at using the new system.
  • It can be daunting to research the available platforms and implementing change.

So, independent and small-chain operators have a choice to make: Stick with the familiar or invest in the future. Change can not only be intimidating, it can be expensive.

However, it seems that most operators are ready to throw comfort to the wayside and embrace innovation.

State-of-the-art Benefits

Should the SpotOn survey prove to be accurate snapshot of the industry, 75 percent of operators will implement new tech next year. According to SpotOn, this is largely in response to growing labor challenges, such as scheduling and retention.

The restaurant, bar, nightclub, and food truck platform found that operators are spending as much as 20 hours per week on administrative tasks. State-of-the-art POS systems can slash those hours by:

  • streamlining operations;
  • making scheduling simpler;
  • calculating tips and payout for payroll; and
  • managing overtime, an increasingly common task.

More modern POS platforms can automate labor management tasks, saving operators time, money, and frustration. Automation and streamlining give operators something invaluable: time.

In particular, innovative and helpful tech solutions provide an operator with time to focus on growing their business. When weighing whether to keep a familiar but less feature-rich POS system or invest in a modern platform that seamlessly integrates many solutions, ask yourself a couple important questions:

  • What’s my time worth?
  • What am I focusing on every day?
  • Am I growing my business or stagnating?
  • Is my current POS system helping or hindering my team?
  • Does my POS system streamline and automate any tasks?

Image: SpotOn

by David Klemt David Klemt No Comments

Menus in Canada: Who Wants What Items?

Menus in Canada: Who Wants What Items?

by David Klemt

Bar and restaurant food and drink menus

Nobody has a crystal ball telling them what they should put on their menus to boost traffic and revenue, but we do have data.

In this instance, we have useful data regarding Canadian consumers specifically. Not only do we have helpful information from Restaurants Canada, David Henkes from Technomic has also weighed in. For those who are unfamiliar, Technomic is one of the best foodservice research and consulting firms.

Before we dive into Restaurant Canada’s menu trend information, this is not a review of the top menu item orders in Canada. For a deep dive into that topic in particular, please read our article “F&B in Canada: Top Menu Items.”

Instead, in this article we’re reviewing broader menu categories and interest in them among Canadian consumers. For your own copy of the 2022 Foodservice Facts report, click here.

Word of Warning

Now, it’s important to bear in mind that the data below is a snapshot. It’s important, informative data but it shouldn’t influence your menu completely.

In other words, when considering revising your menu in any way, make sure you’re staying true to your brand and the community you serve. If your data differs from Restaurants Canada and Technomic data, that’s okay.

Not only are there always outliers, not all data applies to every concept. So, don’t take drastic action on your menus based solely on the data below.

For this particular topic, Restaurants Canada asked three age groups about their interest in eight menu categories.

The groups are: 18 to 34, 35 to 54, and 55-plus. The industry advocacy group then reviewed the numbers for those who indicated they’re “very interested” or “somewhat interested” for each category or item.

Who Wants What?

The menu category generating the most interest from Canadian consumers, according to Restaurants Canada data, is food sourced from local farmers. Overall, 93 percent of survey respondents very or somewhat interested. Those in the 55-plus age group are the most interested.

More than 80 percent are interested in comfort foods, or creative riffs on comfort foods. Age groups 18 to 34 and 35 to 54 have the most interest. Precisely 80 percent are interested in trying globally inspired foods and flavors, led by the 18 to 34 age group.

Foods that promote health and wellness come next, with 79 percent of Canadian consumers showing interest. The 55-plus age group is particularly interested. However, dishes that utilize ingredients that boost one’s immune system are only popular among 53 percent of survey respondents. Interestingly, it’s the 18 to 34 age group with the most interest in this category.

In what’s possibly a contrast from American consumers, the final three categories have no more than 41 percent of survey respondents’ interest. Forty-one percent have interest in meatless and vegetarian items. Next, just 38 percent show interest in alcohol-free cocktails. Finally, just 33 percent are interested in plant-based burgers and sausages.

For each of those categories, the greatest interest comes from the 18 to 34 age group, and the 55-plus group shows the least amount of interest.

Recommended Reading

We’ve been reviewing the 2022 Foodservice Facts report from Restaurants Canada in depth for several weeks. To learn more about this important report, please read the following:

Image: Samuel Regan-Asante on Unsplash

by David Klemt David Klemt No Comments

F&B in Canada: Top Menu Items

F&B in Canada: Top Menu Items

by David Klemt

Closeup of hands holding burger

Those wondering what food and beverage menu items are performing best among consumers throughout Canada need wonder no more.

And why is that? Well, Restaurants Canada has the answers, revealing the top ten food and top ten beverage items.

Further, the organization compares each item’s performance. In this instance, Restaurants Canada analyses the percentage of orders that contained each food or beverage item from January to April 2022 in comparison to 2019.

These insights (and many more) are available in Restaurants Canada’s 2022 Foodservice Facts report. In fact, you can find our reviews of several of the restaurant advocacy group’s report topics via the links below:

For your own copy of this year’s Foodservice Facts report, click here.

Top 10 Canadian Drink Menu Trends

As you’ll see below, coffee is outperforming nearly every other beverage category. Specifically, Hot coffee is at the top, while Iced or frozen coffee is ranked third.

Unsurprisingly, Carbonated soft drinks / Pop / Soda split the two coffee categories. According to Restaurants Canada, the Carbonated soft drink category can credit its performance in large part to QSRs.

  1. Milk: 1.8% (2019) to 1.8% (2022)
  2. Iced tea: 2.9% (2019) to 1.6% (2022)
  3. Milkshakes / Smoothies: 2.1% (2019) to 2.0% (2022)
  4. Fruit juice: 3.8% (2019) to 3.0% (2022)
  5. Hot tea: 5.5% (2019) to 4.5% (2022)
  6. Alcohol beverages: 5.1% (2019) to 5.7% (2022)
  7. Water: 6.6% (2019) to 5.0% (2022)
  8. Iced or frozen coffee: 5.3% (2019) to 7.5% (2022)
  9. Carbonated soft drinks / Pop / Soda: 19.7% (2019) to 20.2% (2022)
  10. Hot coffee: 40.9% (2019) to 41.9% (2022)

Compellingly, Alcohol beverage performance in restaurants fluctuated by age group between 2021 and 2022. Alcohol order shares in restaurants, per Restaurants Canada:

  • Legal drinking Age (LDA) to 34: 46% (2021) to 43% (2022)
  • 35 to 49: 17% (2021) to 21% (2022)
  • 50-plus: 37% (2021) to 36% (2022)

Alcohol order shares in bars, according to Restaurants Canada:

  • LDA to 34: 35% (2021) to 35% (2022)
  • 35 to 49: 17% (2021) to 19% (2022)
  • 50-plus: 49% (2021) to 47% (2022)

Overall, the 35 to 49 age group appears to be consuming less alcohol in bars and restaurants in comparison to the LDA to 34 and 50-plus cohorts.

Top 10 Canadian Food Menu Trends

As Restaurants Canada notes, the Sandwich / Sub category has grown in 2022. Interestingly, the category just below it in growth, Chicken, is partially responsible for boosting Sandwich / Sub performance.

As far as entrees or “main attractions,” the Burger category remains at the top, beating out Breakfast, Sandwich / Sub, Chicken, and Pizza menu items.

  1. Cake / Squares / Muffins: 3.7% (2019) to 3.3% (2022)
  2. Salad: 4.3% (2019) to 3.8% (2022)
  3. Donuts / Beignets: 3.0% (2019) to 3.8% (2022)
  4. Breads: 4.3% (2019) to 3.4% (2022)
  5. Pizza / Panzerotti / Calzone: 4.1% (2019) to 4.3% (2022)
  6. Chicken: 7.6% (2019) to 8.5% (2022)
  7. Sandwich / Sub: 8.0% (2019) to 8.5% (2022)
  8. Breakfast: 10.8% (2019) to 11.4% (2022)
  9. Burger: 9.0% (2019) to 10.9% (2022)
  10. French fries / Potato / Sweet potato / Onion rings: 15.0% (2019) to 16.1% (2022)

Image: Nathan Dumlao on Unsplash

by David Klemt David Klemt No Comments

Your Guests are Likely Ready for More Tech

Your Guests are Likely Ready for More Tech

by David Klemt


Raspberry Pi motherboard

After the past few years of innovation and implementation in our industry, guests are probably ready to use even more technology.

Driven in large part by operator adaptation to ever-changing restrictions in 2020 and 2021, guest-facing tech is far more prevalent than ever. This is particularly true in the quick-service restaurant space.

Of course, tech has certainly become a crucial operational component in the full-service space as well. However, operators many FSR operators find themselves walking a fine between tech innovation and providing personalized service.

Restaurants Canada addresses QSR and FSR tech implementation in their 2022 Foodservice Facts report. Click here for your own copy of the report.

QSR vs FSR Implementation

One benefit of updating a given operation’s tech stack is automation. After all, more tasks handled automatically via tech solutions means a reduction in labor costs.

In theory, removing mundane tasks from front-of-house team members should equate to guests receiving more personalized service. Equally as impactful: Many guests would rather have more control over their visit in the names of convenience and speed.

A couple of examples are placing orders and paying via tablet or other table-side device. For some guests, this is more convenient than the traditional method.

As stated above, QSRs have been quick to embrace and implement tech innovations. And according to a Restaurants Canada survey, nearly three-quarters of QSR operators will wade deeper into tech waters within the next two years. Almost half—49 percent—of QSR survey respondents “probably will” increase their usage of technology by April 2024; a quarter “definitely will.”

On the FSR side, operators are a bit more cautious in their approach to their tech stacks. Of these survey respondents, 37 percent will probably adopt more tech within the next two years, while 15 percent say they “definitely will” do so.

Per Restaurants Canada, the three main concerns of operators relating to implementing more tech are:

  • cost;
  • guest acceptance; and
  • people being able to relate to the equipment (which to me seems directly tied to guest acceptance).

However, FSR operators have also indicated another concern: the perception from guests that tech innovations are leading to a loss of personalized service. So, individual operators must decide not just what tech solutions to embrace but how they may impact the guest experience in negative ways.

Guest Expectations

When Restaurants Canada looked into tech in the restaurant space, they didn’t just focus on operators. The restaurant industry advocacy organization also surveyed consumers.

Perhaps unsurprisingly, the 18 to 34 age group appears to be the most eager to embrace new tech in restaurants. However, they’re not that far ahead of the 35 to 54 group. Interestingly, the 55-plus demographic is less tech-resistant in at least one area than one may assume.

Let’s take a look at Restaurant Canada’s survey results, broken down by tech solution.

  • Order and pay via tablet at FSR: 18 to 34 (55%), 35 to 54 (54%), 55+ (41%)
  • Place an order for food that’s prepared by automated method, either robots or other systems: 18 to 34 (27%), 35 to 54 (17%), 55+ (11%)
  • Order food that’s delivered on-premises by an automated system or a robot: 18 to 34 (32%), 35 to 54 (28%), 55+ (18%)
  • Place an order through a ghost or virtual kitchen: 18 to 34 (34%), 35 to 54 (26%), 55+ (13%)
  • Order food that’s then delivered off-premises via robot or self-driving car: 18 to 34 (36%), 35 to 54 (29%), 55+ (19%)

Considerations

Looking at the above data, most guests are already comfortable placing orders and paying through a tablet. Interestingly, the age group people think of as most tech-averse seem to be open to the idea of robots preparing and delivering their orders.

The keys to implementing tech solutions are deceptively simple: initial costs, subscription costs, maintenance fees, ease of use by staff, and ease of use by guests.

With inflation driving costs up, operators are likely most concerned with what it will cost to add to or upgrade their tech stacks. However, there may be a significant reduction in labor costs that justifies the initial costs. Additionally, some solutions can be leased rather than purchased up front.

But the comfort levels of guests must also receive careful consideration. If a solution is going to alienate or drive away a significant portion of guests, it’s likely not worth the time and cost of implementing it.

Your guests likely want more tech in your restaurant, but it has to be the right tech. Solutions need to deliver convenience and speed without failing to deliver on hospitality.

Image: Harrison Broadbent on Unsplash

by David Klemt David Klemt No Comments

The Numbers on Food Delivery in Canada

The Numbers on Food Delivery in Canada

by David Klemt

Burger in container inside car

For most restaurants, delivery is now a crucial service element rather than a “nice-to-have” option a small percentage of guests expect.

This is true whether your restaurant is in the US or Canada. But who’s placing orders? How are they ordering? And will they continue to order for the foreseeable future?

Well, Restaurants Canada has answers to all those questions and more. So, we let’s take a look at what their 2022 Foodservice Facts report says about delivery.

To download your own copy of this informative report, click here.

Who’s Placing Orders?

In their 2022 Foodservice Facts report, Restaurants Canada looks at three age groups:

  • 18 to 34
  • 35 to 54
  • 55-plus

Perhaps unsurprisingly, the 18- to 34-year-old cohort leads the charge when it comes to ordering delivery. It’s also not surprising that 35 to 54 comes in second, and 55 and older is third.

However, the first two groups are closer than some may assume. Eighty-three percent of the the 18 to 34 cohort placed orders at quick-service or full-service restaurants between December 2021 and May 2022.

That number does drop for the same time period among the 35 to 54 group, but not by a significant amount. Of that cohort, 77 percent ordered delivery. Just over half of the 55-plus group placed delivery orders: 52 percent.

Now, those numbers are down a bit from 2021, which makes sense. Things were much more restrictive in 2021 and people were just getting back to a sense of normalcy at the start of this year.

In 2021, the delivery order percentages were:

  • 18 to 34: 89 percent
  • 35 to 54: 81 percent
  • 55-plus: 67 percent

Looking at these numbers, it appears the 55-plus cohort is more comfortable dining out in person. Conversely, the 18 to 34 age group is clearly comfortable making delivery a part of their everyday lives.

How do People Want to Order?

Believe it or not, your website still matters. I’ve been saying this for years but the pervasiveness of delivery and takeout ordering is really driving this point home.

The fact is, a notable percentage of your guests want to support your restaurant and staff directly. Over the past couple of years, consumers have become well aware that third-party delivery services are incredibly costly for operators.

Consumers are also aware of third-party delivery debacles, such as the abysmal Grubhub “Free Lunch” mess from May of this year.

So, direct delivery is something that operators need to at least consider. Implementation is often less difficult than most business owners believe. And many platforms, SevenRooms, for example, make implementing direct delivery simple and affordable.

Interestingly, Restaurants Canada data supports the need for direct delivery. Back in May, the industry advocacy organization asked survey respondents how they prefer to place delivery orders from restaurants.

Preferences for QSR customers:

  • No preference: 10 percent
  • Over the phone: 19 percent
  • Third party: 35 percent
  • Restaurant website or app: 36 percent

Full-service customer preferences:

  • No preference: 8 percent
  • Over the phone: 28 percent
  • Third party: 29 percent
  • Restaurant website or app: 35 percent

Honestly, I find it surprising anyone calls a QSR to place an order. However, I suppose that makes sense for an office or catering.

At any rate, make sure your website is up-to-date, you offer direct or “last-mile” delivery, and make it easy to navigate your menu and the ordering process.

Is Ordering Here to Stay?

Now, we all know why restaurant delivery has been supercharged the past two years. However, consumer trend data show that delivery was on the rise before the Covid-19 pandemic.

But now that people are eager to return to normal and the industry is on its way to returning to pre-pandemic levels, is delivery really here to stay?

According to another question asked of survey respondents by Restaurants Canada, more than half of QSR and full-service restaurant customers plan to stick with delivery.

For their 2022 Foodservice Facts report, Restaurants Canada asked back in May how often consumers planned to place delivery orders in the next six months.

Order frequency for QSR customers:

  • Never placed a delivery order and don’t plan to now: 29 percent
  • Order less often: 20 percent
  • Will order with the same frequency: 45 percent
  • Will order more often: 7 percent

Frequency of orders for full-service customers:

  • Never placed a delivery order: 24 percent
  • Order less often: 23 percent
  • Will order with the same frequency: 44 percent
  • Will order more often: 9 percent

Here to Stay?

Of course, there are multiple factors feeding the numbers above. Some people simply don’t like ordering and waiting for delivery. For these consumers, the practice doesn’t just seem convenient.

There’s also the consumer demand to return to in-person dining, socializing with family and friends. And, of course, meeting new people while dining out.

We must also consider inflation and rising costs. Often, restaurant spending is among the first to be reduced when consumers need to be more frugal. Rising menu costs are sure to curtail some delivery spending.

That said, it’s clear delivery is here to stay and must be considered a crucial element for most restaurant operations. QSR and full-service operators need to bear in mind is placing orders; how often they’re placing orders; and get them in the habit of placing orders directly.

Image: Oliur on Unsplash

by David Klemt David Klemt No Comments

Operators & Guests Respond to Rising Costs

Operators & Guests Respond to Rising Costs

by David Klemt

Canadian dollar bills

Everything is more expensive these days and both operators and consumers have their own ideas for addressing rising costs.

To gather and share insight into people’s mindsets, Restaurants Canada conducted and commissioned two surveys.

For one, the industry research and advocacy organization surveyed operators. The focus was on how much operators anticipated increasing their prices.

On the other side, Restaurants Canada commissioned Angus Reid for a survey focusing on consumers. This survey revealed potential traffic slowdowns and perceived value for money.

For your own copy of Restaurant Canada’s 2022 Foodservice Facts report, click here.

QSR vs. FSR: Consumers

As an operator, converting first-time visitors into repeat guests is paramount. Equally as important: increasing visit frequency per guest.

Of course, an immediate byproduct of rising costs is consumers pulling back and reevaluating their spending. Oftentimes, dining out is one of the first costs consumers slash in order to save money.

Therefore, operators always face the risk of reduced traffic and even losing some guests permanently when they raise prices. However, this is often a necessary risk to take to combat rising costs.

So, how dire is the situation among Canadian consumers currently? Or at least, how did they feel in Q2 of this year? Angus Reid conducted a survey of consumers to find out, and the results can be found within the 2022 Foodservice Facts report.

First, let’s look at visit frequency for QSRs and FSRs. Before we begin, 12 percent of survey respondents answer that they “don’t know for sure” if rising prices will affect their visit frequency for either QSRs or FSRs. Not helpful.

For QSRs, 19 percent of respondents say an increase in prices won’t impact their visit frequency. Thirty-six percent anticipate visiting “a little less often,” while 32 percent will visit much frequently.

As for FSRs, 16 percent of survey respondents won’t change their visit frequency. However, 37 percent anticipate visiting FSRs much less often. Nearly as many, 36 percent, will visit a bit less frequently.

Interestingly, however, is perceived value. More FSR guests believe they receive excellent or good value for their money than they do from QSRs. More QSR guests believe they receive fair, poor, or very poor value for their money.

Overall, though, 90 percent of Canadian consumers feel positive toward the value they receive from QSRs and FSRs.

QSR vs. FSR: Operators

Clearly, it’s good news that the vast majority of Canadians believe they receive good value for their money when dining out.

Nobody enjoys paying more but it appears that both QSRs and FSRs in Canada can increase their prices. At least, they can do so for now while consumers are mostly understanding about inflation.

Restaurants Canada asked QSR and FSR operators a simple but revealing question for their 2022 Foodservice Facts report. The question? How much higher do operators expect to increase their prices by the end of Q4 of this year in comparison to last year?

The majority of operators in both categories anticipate they’ll increase menu prices by more than seven percent. Twenty-seven percent of QSR operators have that expectation. That number rises to 35 percent for FSR operators.

Twenty-two percent of QSR operators anticipate raising prices five to seven percent before the end of 2022. In comparison, 32 percent of FSR operators expect to raise prices in the same range.

At the moment, Canadian consumers appear to be willing to endure these increases. However, it’s likely they expect prices to drop back to “normal” (pre-pandemic prices) or close to it sometime in 2023. That is, unless Canada slides into recession.

Image: PiggyBank on Unsplash

by David Klemt David Klemt No Comments

Restaurants in Canada: Daypart Performance

Restaurants in Canada: Daypart Performance

by David Klemt

White clock on red background

For both in-person dining and off-premise consumption, more Canadian consumers are ordering from restaurants across all dayparts.

As Restaurants Canada points out in their latest report, traffic and sales remain lower than pre-pandemic levels. However, there are reasons to be positive.

For one example, Restaurants Canada predicts 2022 sales to return to pre-pandemic levels by the end of the year. The foodservice research and advocacy organization’s 2022 Foodservice Facts report provides another positive outlook.

Just looking at Q1 of this year versus Q3, all dayparts are seeing increases in traffic.

To read more about the report and grab your own copy, follow this link.

Numbers Tell the Tale

Per Restaurants Canada, the breakfast daypart slid significantly in 2020. During that time, it fell 20 percent that year.

For the first half of this year, however, Restaurants Canada reports that breakfast traffic is just four percent lower in comparison to 2019.

On a positive note, the breakfast daypart has risen steadily from March of this year to July, or Q1 versus Q3. In fact, all dayparts have grown.

According to Restaurants Canada, 43 percent of Canadians ordered breakfast from restaurants in March 2022. That number grew to 50 percent by July of this year.

In terms of snack purchases, 55 percent of Canadian consumers made purchases from restaurants. By July, that percentage rose to 62 percent.

Continuing along, 64 percent of Canadians placed lunch orders in March. Four months later, that number had increased to 73 percent.

Per the 2022 Foodservice Facts report, a significant percentage of Canadians are placing lunch and snack orders. In fact, Restaurants Canada says that Canadians are making purchases from restaurants during those dayparts two to three times per month.

Of course, there’s one more daypart we need to discuss…

Dinner is King

By the numbers, the dinner daypart is outperforming all others in Canada.

In March of 2022, 85 percent of Canadians had placed dinner orders at restaurants. That number rose to 87 percent in April but dipped to 86 percent in May.

However, dinner saw growth again in June and July, rising to 88 and then 89 percent, respectively.

As the numbers show, dinner orders are outpacing lunch orders 14 percent. Snacks are being outpaced by dinner by nearly 30 percent. Of all dayparts, breakfast is the weakest.

In fact, dinner outperforms breakfast by nearly 40 points. This makes sense when we consider the work-from-home effect.

More people working from home means, in theory, many less people commuting to work. Restaurants that once saw great breakfast daypart traffic are seeing a significant dropoff. Less people commuting means less people popping into a restaurant for breakfast.

It appears that instead, people are clocking in, working until break time, and then going to get a snack. And when lunch rolls around, why not place an order for lunch?

Naturally, after working all day, people are tired or eager to meet up with friends and family to socialize and decompress. So, dinner ruling the daypart roost makes complete sense.

In other words, operators looking to streamline should consider this Restaurants Canada data. The dayparts that require the most labor currently are lunch and dinner, so operators should plan accordingly if that’s viable for their business.

Image: CHUTTERSNAP on Unsplash

by David Klemt David Klemt No Comments

Canada’s Restaurant Labor by the Numbers

Canada’s Restaurant Labor by the Numbers

by David Klemt

Chef inside commercial kitchen

While there are positive signs for Canada’s foodservice industry, recruiting and retaining labor continues to be a challenge.

Unfortunately, this isn’t a challenge unique to Canada. Operators throughout North America and indeed across the globe are facing labor shortages.

Restaurants Canada addresses this topic in their 2022 Foodservice Facts report. The non-profit research and advocacy group predicts sales will reach pre-pandemic levels by Q4 of this year.

However, restaurants, bars, and nightclubs may have to achieve traffic and revenue growth despite a significant labor deficit.

Please click here to access the 2022 Foodservice Facts report yourself.

Labor Shortage by Category

In their latest report, Restaurants Canada crunches the numbers for three distinct venue categories. These are quick-serve restaurants, full-service restaurants, and bars and nightclubs.

The organization finds that QSRs and FSRs are facing the greatest shortages. In fact, in response to a survey from May of this year, at least half of QSRs and FSRs aren’t operating with fulls staffs.

For QSRs, 52 percent of respondents say they perceive restaurants and bars they’ve visited to be understaffed. A bit over a third (36 percent) think staffing is “about right.” Unhelpfully, 12 percent “don’t know” if restaurants and bars have enough staff.

So, let’s switch gears to FSRs. Precisely half of survey respondends say restaurants and bars don’t have enough staff. Just like their QSR counterparts, 36 percent say that staffing seems to be at the ideal level. Fourteen percent respond that they “don’t know,” which doesn’t tell us much.

Per Canadians who responded to Restaurants Canada’s survey, bars and nightclubs are fairing better…at first. Frustratingly, a staggering 37 percent of respondents “don’t know” if bars or nightclubs have appropriate levels of staffing. Thirty-two percent think they’re understaffed, 31 percent think staffing levels are “about right.”

Industry professionals are probably already putting two and two together here. As long as guests receive the level of service they expect, from greeting to speed of service, to closing out their check, they think things are fine. If they’re made to wait longer than they want, they’ll likely say a restaurant, bar or nightclub doesn’t have enough people on shift.

Labor Shortage by Role

Okay, so the May 2022 Restaurants Canada wasn’t entirely helpful. It still provides interesting insight. That is, we know how guests perceive staffing in at least most instances.

So, let’s get down to hard numbers: shortages in specific roles throughout the industry.

Here, Restaurants Canada provides compelling information, even if it’s not what we want to see. In comparison to 2019, every role is down by thousands of people. In some cases, tens of thousands.

Below you’ll find the deficits by role:

  • Foodservice supervisors: -3,100
  • Chefs: -10,900
  • Bartenders: -17,600
  • Maîtres d’hôtel and hosts/hostesses: -21,100
  • Restaurant and foodservice managers: -22,400
  • Food counter attendants, kitchen helpers, and related support occupations: -43,200
  • Cooks: -44,400
  • F&B servers: -89,500
  • Other: -18,800

Add that up and that’s a shortage of 271,000 people throughout Canada’s foodservice industry. For further context, the industry boasted 1,265,700 workers. In 2021, the industry was down to 994,700.

Unfortunately, from 2020 to 2021, just 4,100 jobs were recovered, according to Restaurants Canada. This situation clearly shows that operators need to change their approach to staffing.

Now, more than ever, operators must focus on effective recruitment, onboarding, and retention. For tips on making improvements, click here. To learn how to implement employee surveys to boost retention and avoid costly turnover, click here.

Image: Brian Tromp on Unsplash

by David Klemt David Klemt No Comments

Restaurants Canada Reveals Pandemic Impact

Two Years On, Restaurants Canada Reveals Pandemic Impact

by David Klemt

Canon accounting calculator

Restaurants Canada looks at the impact of the pandemic on the foodservice industry in their latest Foodservice Facts report.

Canada’s foodservice industry research and advocacy non-profit sees a return to pre-pandemic operations. However, the path forward toward pre-pandemic traffic and sales levels won’t be without its challenges.

“While nominal sales are expected to return to pre-pandemic levels before the end of the year, traffic still remains below what it was before,” says Restaurants Canada president and CEO Christian Buhagiar.

To access your own copy of 2022 Foodservice Facts, click here.

Industry Still Struggling

As an owner, operator, or foodservice professional, you probably have the answer to a specific question in mind.

When will we be “back to normal?” And, of course, the natural followup to that question. Will the industry surpass 2019 traffic and sales?

Restaurants and bars throughout Canada have survived six waves of Covid-19 over the course of two-plus years. There have been an inordinate amount of lockdowns that inarguably forced the permanent closure of far too many businesses.

As Restaurants Canada states (and the rest of us know all too well), there’s no telling if another Covid-19 variant will rear its ugly head. It’s conceivable (but with any luck unlikely) that Canada could face future lockdowns.

At the moment, according to Restaurants Canada, foodservice sales are currently 11 percent below 2019 levels. And yes, that’s after adjustment for inflation. Speaking of which, one reason traffic and sales remain below those of 2019 is consumer confidence. Many Canadians are concerned about a possible recession.

In addition, operators in Canada continue to face a labor shortage.

News Not All Bad

Now, anyone who read the previous section would be justified in lacking confidence in the industry. However, there is good news.

First, let’s compare Q1 of 2022 to Q2. Per Restaurants Canada, just 15 percent of restaurants were able to seat guests with zero restrictions. By April, though, approximately 90 percent of restaurants in Canada could serve in-person guests restriction-free.

Second, Q2 had more positivity in store for operators. According to Restaurants Canada, the FSR segment endured an 18-month decline in traffic when Covid-19 took hold. When restrictions were lifted, the floodgates of consumer demand burst. By Q2, traffic was a mere one percent lower in comparison to 2019.

Going a bit granular, QSR performance also improved in Q2. Per Restaurants Canada, QSR traffic lagged eight percent behind pre-pandemic levels. However, that number improved to just two percent under pre-pandemic levels by Q2.

Compellingly, Q2 still wasn’t done with foodservice industry positivity. While QSRs outpaced FSRs three-fold in terms of traffic, their numbers combined bring the industry back to 2019 Q2 levels.

Restaurant Canada’s positive outlook predicts that the industry will return to pre-pandemic levels by Q4.

Image: StellrWeb on Unsplash

by David Klemt David Klemt No Comments

Pumpkin Spice Season Descends Upon Us

Pumpkin Spice Season Descends Upon Us

by David Klemt

Jack o' lantern and smoke

Once again, the unstoppable march of the spooky season is upon us, bringing with it a frightening assortment of pumpkin spice items and expectations.

In the blink of an eye, hordes will descend on your restaurant or bar. “Pumpkin spiiiiiice,” they’ll croak.

Okay, so that’s overly dramatic. For the most part, pumpkin spice season is anything but scary. And really, very few people will transform into singularly focused pumpkin spice zombies.

However, fall is nearly here. So, you do need to finalize your fall/autumn menu. Beginning in September, that really does mean considering offering at least one pumpkin spice LTO item.

Interestingly, though, pumpkin spice may not deserve its perception as the flavor of fall. According to Datassential, there are ten flavors that index high enough to give pumpkin spice a challenge for the fall throne.

What are they? Well, it just so happens that Datassential has those answers, along with a bit of useful advice.

Lord of the LTO

Recently, Datassential released “Food Industry Trend Report: 2022 Pumpkin Spice Season.” As the research firm points out, pumpkin spice seems to be encroaching on summer more each year.

How far away are we, I wonder, from pumpkin spice claiming summer for itself? Will we be subjected to pumpkin spice dry rubs at summer barbecues? Is some intrepid operator going to create a pumpkin spice lemonade?

Those terrifying questons aside, pumpkin spice season coming earlier means more opportunities to benefit from LTOs. Just as it seems that pumpkin spice is descending upon us earlier and earlier, it also seems to dominate the LTO space.

In fact, per Datassential research, major chains executed 174 pumpkin spice LTOs. Now, that’s still with a five-percent drop in menuing for pumpkin space over the past 12 months. Further, that number doesn’t include small, regional chains and independents who also launched pumpkin spice LTOs.

Of course, there are also other fall flavors that deserve a place on operators’ menus. And they’re perfectly cromulent as LTO drivers.

Fall Flavor Favorites

To inspire operators to create LTOs that entice consumers this fall, Datassential has identitied ten flavors on which to focus. Helpfully, they separate them into two main categories.

Top five sweet fall flavors:

  • Vietnamese cinnamon
  • Spicy ginger
  • Allspice
  • Eggnog
  • Pumpkin pie

Top five savory flavors:

  • Coconut milk
  • “Oktoberfest”
  • Mustard cream
  • Turkey gravy
  • Cranberry sauce

Personally, I can see operators and their teams needing to get creative to leverage mustard cream and turkey gravy. Interestingly, Datassential suggests a few flavors not on either list above.

According to their report, Datassential expects apple and blood orange to be popular for LTOs this year. According to the firm, apple was popular last year. When it comes to blood orange, Datassential says 38 percent of consumers like or love the flavor.

Whichever flavors you choose, Datassential has the following advice, which we co-sign: Ensure your LTOs are fresh; make sure they’re easy and quick to make; and don’t discount them. In fact, you should create premium LTOs that come with a premium price.

Image: Colton Sturgeon on Unsplash

by David Klemt David Klemt No Comments

Clever Ranks the Top US Retirement Cities

Clever Ranks the Top US Retirement Cities

by David Klemt

Bridge in City Park in New Orleans

Real estate brokerage Clever, known for transparency and affordability, has identified the top cities for people to retire to in the United States of America.

Over the past few weeks we’ve examined an array of city rankings. For example, last month we took a look at Time Out’s top 53 cities in the world for 2022. Out of those 53 cities, six are in the US and two are in Canada. Both countries have one city in the top ten.

Also in July of this year, we learned from Redfin which US cities are experiencing the greatest outflow and inflow. Spoiler: The top outflow city is San Francisco. Also, the number one inflow city is Miami.

Then this month we checked in on a very specific demographic: “high earners.” For this report, SmartAsset Advisors labeled high-earner households as those earning $200,000 or more per year. If you want to know which states are attracting the most high earners, click here. Conversely, you’ll see which states are seeing the greatest outflow of high earners.

Now, we know the top cities in which Baby Boomers should retire, according to Clever.

Retirement

It’s wise for operators to know everything they can about the markets in which the operate. Is it attracting or losing high earners? Are people clamoring to live in a particular city, driving up home, rental, and other costs?

On the flip side, is a city an operating is running a business in seeing an exodus? Obviously, if a significant number of people are leaving, traffic and revenue can see a negative impact.

Another important factor impacting a given market? The number of retirees who want to move there.

Generally speaking, many retirees have disposable income and time on their hands. Both of which, of course, they can spend at restaurants, bars, and hotels.

For their report, Clever considered healthcare, cost of living, and quality of life. On the topic of healthcare, Clever points out that retirees need to consider affordable care costs and quality of care.

Overall, Clever examined 18 metrics to come up with their lists, including how states tax Social Security and a 401(k).

American Cities 50 to 11

Unsurprisingly, there’s crossover between the top inflow and outflow cities and the top retirement cities.

  1. Minneapolis, Minnesota
  2. Riverside, California
  3. Sacramento, California
  4. Detroit, Michigan
  5. Seattle, Washington
  6. San Diego, California
  7. Phoenix, Arizona
  8. Buffalo, New York
  9. Boston, Massachusetts
  10. Salt Lake City, Utah
  11. Columbus, Ohio
  12. New York, New York
  13. Los Angeles, Calfornia
  14. Dallas, Texas
  15. Charlotte, North Carolina
  16. Las Vegas, Nevada
  17. Raleigh, North Carolina
  18. San Jose, California
  19. Washington, DC
  20. Atlanta, Georgia
  21. Portland, Oregon
  22. Houston, Texas
  23. San Antonio, Texas
  24. Austin, Texas
  25. San Francisco, California
  26. Baltimore, Maryland
  27. Orlando, Florida
  28. Philadelphia, Pennsylvania
  29. Cincinnati, Ohio
  30. Cleveland, Ohio
  31. Chicago, Illinois
  32. Virginia Beach, Virginia
  33. Jacksonville, Florida
  34. Hartford, Connecticut
  35. Memphis, Tennessee
  36. Pittsburgh, Pennsylvania
  37. Providence, Rhode Island
  38. Kansas City, Missouri
  39. Milwaukee, Wisconsin
  40. Indianapolis, Indiana

American Cities 10 to 1

Below, the top ten retirement cities according to Clever.

  1. Nashville, Tennessee
  2. Miami, Florida
  3. Oklahoma City, Oklahoma
  4. Tampa, Florida
  5. Richmond, Virginia
  6. Denver, Colorado
  7. St. Louis, Missouri
  8. Louisville, Kentucky
  9. Birmingham, Alabama
  10. New Orleans, LA

Per Clever, New Orleans clinches the top spot for the following reasons:

  • Affordability.
  • The state of Louisiana doesn’t tax Social Security benefits.
  • Income-level limits on 401(k), IRA, and pension distribution tax rates.

Image: Susan Q Yin on Unsplash

by David Klemt David Klemt No Comments

Date Night Desires and Dealbreakers

Date Night Desires and Dealbreakers

by David Klemt

Reserved seats at a bar

Focusing on date night, guest experience and retention tech platform SevenRooms is sharing their latest data-driven report.

Their “Date Night Diner Report” is another successful collaboration with YouGov. Previous reports from this partnership include:

One of the reasons we at KRG Hospitality appreciate and recommend SevenRooms is their dedication to data. The platform’s commitment to sharing the data they collect to the benefit of operators is impressive.

“A resurgence of the American date night is here, and these date night diners are flipping the script on what that experience should look and feel like,” says Allison Page, co-founder and chief product officer at SevenRooms.

So, operators who want to succeed with date night should review this new report. In fact, all operators would be wise to read this report. After all, it addresses reservations, waitlists, walk-ins, and much more.

Released today, this brand-new report can be downloaded here. Read the press release here.

Date Night Details

A lot has changed over the past two-plus years. What hasn’t changed are the two most popular date nights in the US: Friday and Saturday.

Both Friday and Saturday night are preferred by 26 percent of the 763 survey respondents who go on dates. In total, SevenRooms and YouGov surveyed 1,153 individuals.

Generally speaking, these dates are return visits. People who go on dates tend to make reservations at restaurants they’ve dined at previously.

However, 46 percent of such guests are open to reserving a table at a restaurant they haven’t visited before. And speaking of those tables reservations, 53 percent are for two people.

Looking at two major populations, tables for two are the most popular reservations. In New York, they account for 50 percent of reservations. That number increases to 56 percent in Los Angeles.

Interestingly, however, is this bit of date: 53 percent of Americans don’t make reservations for date night. Rather, they’re walk-in guests, meaning they’ll likely become waitlist guests.

Date Night Desires

So, now operators know that the majority of today’s date-night reservations are for two. That doesn’t mean setting aside two-tops and side-by-side seats at the bar is enough for success.

No, there are also guest expectations to consider. SevenRooms identifies the following as the top date-night desires:

  1. A complimentary cocktail or dessert. (33 percent)
  2. Ability to earn extra rewards (24 percent), highlighting the value of loyalty programs.
  3. Incentives that encourage repeat date-night visits. (23 percent)

Furthermore, personalization continues to be a key factor in the dining decision. One-third of guests consider the ability to personalize their dining experience more important than factors such as menu variety or receiving their order quickly.

Date Night Dealbreakers

Of course, if there are desires there are also dealbreakers.

According to SevenRooms, the following are the dealbreakers operators must avoid:

  1. People on a date receiving their meals at different times. In this case, more than ten to 15 minutes apart. (45 percent)
  2. The restaurant being so loud the guests on their date can’t hold a conversation. (43 percent)
  3. A restaurant not having the menu items the guests were looking forward to ordering. (31 percent)
  4. Being sat too close to another table. (31 percent)
  5. Sitting next to a table speaking “too loudly.” (26 percent)
  6. The restaurant being so crowded that a guest can’t find their date. (24 percent)

How important is it to avoid these dealbreakers? Well, the survey respondents say they won’t return to a restaurant if they experience any of them.

To read the full report, click here. And to learn more about SevenRooms, listen to Bar Hacks episode 24, featuring SevenRooms CEO Joel Montaniel.

Image: Dmitri Nesteruk on Unsplash

by David Klemt David Klemt No Comments

Are You Surveying Your Team?

Are You Surveying Your Team?

by David Klemt

Interesting "Information" typography

Successful recruitment is only one element of overcoming the current labor shortage—retention is another crucial element.

In fact, employee turnover can be incredibly costly. According to the Center for Hospitality Research at Cornell, employee turnover costs nearly $6,000 per hourly team member.

Now, consider what it costs to hire a single employee. On average, it costs $3,500 to hire that worker in the first place. So, the math is simple: Losing an employee costs an operator more than hiring one.

Unsurprisingly, turnover cost more than doubles—nearly $14,000—for a restaurant manager. In short, employee retention is arguably more important than recruitment and hiring.

Labor Shortage

Per Datassential, 33 percent of 801 survey respondents say the labor shortage is their greatest challenge in 2022. More than 70 percent of those respondents are independent operators.

However, independent, chain, and franchise operators appear to agree on one particular element of the challenge. Across segments, hiring hourly back-of-house employees is the most difficult.

In fact, Datassential’s latest FoodBytes report states that restaurants are coming up short in the kitchen. Two-thirds of restaurants are struggling to fill open hourly cook positions.

So, what’s the solution? Higher starting wages? Bonuses for remaining in role for 90 days? Benefits like health insurance and a 401K?

Each of those does work—for recruitment and hiring. What keeps a new hire from leaving after 90 days with their bonus cash, heading down the road to the next restaurant or bar?

It’s commonly agreed that the first 90 days of a new hire’s employment are the most crucial. Wages and benefits keep them in role for roughly three months. During that time, they’re deciding if their role and the employer’s culture are for them.

Employee Engagement

If you’re an owner, operator, or member of the leadership team, you know the importance of data. In fact, you should be obsessed with data collection and analysis.

Truly, the best way to make decisions that will impact the business is with information. Guesswork just doesn’t cut it. Yes, you should pay close attention to your “gut.” However, you should avoid acting on gut instincts before analysing the relevant data.

Wisely, many operators encourage their guests to complete satisfaction surveys. After all, their feedback is crucial to the success of any business. But what about employee surveys? Your team is equally as important as your guests.

Unhappy team members, unhappy guests. Unhappy guests, reduction in traffic. Team members fleeing your business? Your guests pick up on turnover. Eventually, you won’t have a business.

Now, you can assume your team is happy. You can feel like your leadership team is ensuring employee satisfaction and engagement. Or, you can know.

How do you know? You ask.

Satisfaction Surveys

Call it a satisfaction survey, call it a happiness survey… Either way, you’re asking your team members how happy they are with you and their role.

Operators will likely want to keep these surveys anonymous. Several sources that address employee surveys claim most employees prefer anonymity. Unfortunately, this is due to a fear of retribution from ownership or the leadership team.

Even with a healthy workplace culture, anonymity is probably the best for these surveys. Of course, if you’re implementing a 90-day happiness survey for new hires, anonymity doesn’t make much sense.

As far as company-wide survey frequency, there are several options. Once per year is obviously the bare minimum. Therefore, it’s not very effective. Every six months is better but is checking in on your team’s happiness twice per year enough?

The sweet spot appears to be quarterly surveys. More than that—monthly or bi-monthly—will likely get annoying.

Survey Questions

Below are a few questions to consider for your surveys. You’ll have to decide if you want to use multiple-choice, yes or no, matrix, or open-ended questions, or a mix of each type.

Another consideration is how your team will access the survey. The process needs to be as painless as possible. So, consider pushing a link via your scheduling platform, text, or QR code.

  • How happy are you working here?
  • How happy are you in your current role?
  • Would you recommend us to friends and family as a good place to work?
  • Does the leadership team make you feel valuable?
  • Do you see yourself working here a year from now?
  • Are we helping you succeed in your role?
  • Are we giving you what you need to progress in your career?

Image: Roman Kraft on Unsplash

by David Klemt David Klemt No Comments

Datassential’s State of the Operator 2022

Datassential’s State of the Operator 2022

by David Klemt

Guests sitting at the bar inside a restaurant

The latest addition to the Datassential FoodBytes research series shares insights into the top three challenges most—if not all—operators are facing.

Now, some of what the report reveals paints a bleak picture. Inflation, the labor shortage, and supply chain issues persist even past the midway point of 2022.

However, operators are a tenacious and innovative group of business owners. Of course, that tenacity seems to manifest in people thinking this industry can weather any storm. That perception can come at operators’ detriment. Exhibit A: The Inflation Reduction Act of 2022 not including replenishing of the RRF. But, I digress.

“The State of the Operator & the Road Ahead,” which you can download here, is helpful and informative. As you may be aware, we’re fans of Datassential and their FoodBytes reports. In fact, you can find our synopses of FoodBytes reports here and here.

Below are some key points that operators should be aware for consideration. I strongly urge you to download this free report today.

Operator Outlook

First, let’s take a look at traffic. As Datassential points out, some hospitality business segments are performing better than others currently.

In large part, this is due to two factors: People working from home, and people returning to travel. So, operators who rely heavily on commuters and in-person workers are struggling. On the other hand, operators inside or around hotels are, per Datassential, performing the strongest at the moment.

Interestingly, though, nearly half of operators (47 percent) are seeing an increase in traffic in comparison to pre-Covid levels. Fourteen percent of operators are reporting no change in traffic. Unfortunately, traffic is lower for 39 percent of operators.

Next, sales. In comparison to pre-Covid times, more than half (51 percent) of operators report an increase. Again, 14 percent of operators are experiencing no change. But 35 percent of operators are experiencing a decrease in sales.

Finally, profit margins. Half of operators may be seeing increases in traffic in sales, but profit margins are taking a hit. On average, the industry’s profit margin is now hovering at 13 percent. That’s an eight-percent drop in comparison to pre-Covid levels.

Segment Performance

The findings regarding profit margins are likely to be the most alarming to operators. Historically, our industry has operated on razor-thin margins for decades. Dropping from an average of 21 percent to 13 is concerning.

However, context is important. The segments seeing the lowest profit margins in 2022 are: Business & Industry (B&I), Healthcare, and Colleges & Universities (C&U). Again, remote work (and learning) are largely responsible for those particular segments watching their profit margins tumble.

The strongest performers are: Quick-Service Restaurants (QSR) at 17 percent; Fast Casual at 15 percent); and Midscale, Casual Dining, and Fine Dining, each at 13 percent. Lodging is just below the current average at 12 percent.

Operator Adaptation

Inflation, rising food costs, supply chain issues, labor shortages… Operators are finding ways to cope, and in some situation, thrive.

Unsurprisingly, the vast majority of operators are increasing menu prices. In the past 12 months, 77 percent of operators have raised menu prices at least once.

These increases range from one percent a staggering 30 percent. However, the majority have kept these increases to one to ten percent. Most (31 percent) have implemented increases of no more than five percent. Just one percent of operators boosted prices between 25 to 30 percent.

Of course, raising prices isn’t the only strategy operators have at their disposal. Forty percent of operators are streamlining their menu, reducing the sizes of their menus. However, it’s wise for operators to review their menus at least every three months to eliminate poor performers.

Other strategies include focusing on value for guests (27 percent); utilizing LTOs and launching new menu items (26 percent); eliminating a specific daypart or portion of the menu (25 percent); and making portion sizes small, or “shrinkflation” (18 percent).

There’s much more revealed in Datassential’s latest FoodBytes report. Download your copy today.

Image: Luca Bravo on Unsplash

by David Klemt David Klemt No Comments

iPourIt Releases Fourth Annual Pour Report

iPourIt Releases Fourth Annual Pour Report

by David Klemt

Black and white beer taps

Self-serve beverage platform iPourIt’s informative fourth annual Pour Report identifies their top beer and wine pours from 2021.

iPourIt is a pioneer in the self-serve space, enhancing the guest experience and boosting revenue. However, their annual reports are another key reason operators should consider this platform.

Unlike other industry platforms, iPourIt doesn’t limit their resources to clients. Nor do they place resources like their annual Pour Report behind a pay wall. So, this is a transparent company that clearly views their relationships with clients as partnerships.

You can check out their resources for yourself by following this link. To download a copy of the 2021 Annual Pour Report, click here.

Below you’ll find key datapoints from the latest iPourIt report. I encourage you to download and review the report in its entirety.

Key Demographic Information

When it comes to men and women using iPourIt self-serve systems, men are respsonsible for 64 percent of total ounces poured.

On average, men served themselves 6.4 ounces per pour and spent $14.21 on iPourIt per visit. For men, the top pours were IPA, Lager, Cider, Hefeweizen, and Sour.

Conversely, women served themselves nearly 11 million ounces via iPourIt systems. That’s 36 percent of total ounces poured.

On average, women served themselves 5.3 ounces per pour and spent $11.95 per visit. For women, the top pours were Cider, IPA, Sour, Lager, and Hefeweizen.

Interestingly, the top pour for both men and women was Michelob Ultra.

Key Beer Takeaways

The 2021 Pour Report analyzes data from more than 300 iPourIt systems, over 8,800 taps, and 49 million total ounces of beer and wine poured.

In total, patrons consumed nearly 14,600 total products. Further, the data above represents 1.9 million guests served 3.1 million pints. Compellingly, that’s $26.2 million in revenue generated by iPourIt systems.

In terms of iPourIt systems and patrons, cider claimed the number two slot for the top 15 poured beer styles. Perhaps unsurprisingly, IPA claims the top spot. In fact, iPourIt systems served more than 10 million ounces of IPA.

As far as beer styles that are growing in popularity, three styles are on the rise. These climbers are Belgian, Cream Ale, and fruit beer. Conversely, Lager, Red Ale, and Witbier slipped down the list. Interestingly, Witbier slid four slots on iPourIt’s top 15 beer styles list. For the first time since iPourIt has been releasing reports, Seltzer made it onto the list, claiming the 11 spot.

Another interesting bit of data concerns consumer preferences. IPA may be the beer style seeing the most pours but domestic Lagers and light Ales are the top-selling products across iPourIt systems. The platforms interprets this as consumers trying small samples of IPA but going with Lagers and Ales for full serves.

Top Beer Pours by Category

Helpfully, iPourIt breaks down their Pour Report into several categories. So, let’s take a look at the top five from several of their lists.

As for the top products poured overall, Michelob Ultra claims the top spot. In descending order, it’s followed by Bud Light, Golden Road Mango Cart, Ace Pineapple Cider, and Modelo Especial.

For domestic pours, numbers one and two are the same as above. However, Coors Light, Miller Lite, and Pabst Blue Ribbon. The top five import products are Modelo Especial, Delirium Tremens, Rekorderlig Strawberry-Lime, Stella Artois, and Dos Equis Lager Especial.

Switching gears to craft and microbrew, Mango Cart claims the number one spot. Numbers two through five are Space Dust, 805, Kona Big Wave, and Big Storm Oak & Stone Snowbird Pilsner.

Of course, the report goes much deeper than just those four categories. There’s also the top 25 IPAs, and the top 15 Lagers, Ciders, Hefeweizens, Sours, Stouts, Blonde Ales, Pilsners, and Pale Ales.

New for the annual Pour Report are the top 15 fruit beers and Seltzers.

Key Wine Takeaways

Before we proceed, iPourIt systems aren’t limited to beer and wine. If it’s a beverage without pulp or sediment intended to be poured cold, iPourIt can handle it.

So, cold brew coffee, kombucha, sodas…these are all revenue-generating serves to pour alongside beer and wine.

Now, onto the 2021 report. The key wine takeaway focuses on sparkling wine. In short, sparking wines have proven popular with iPourIt patrons. So, the platform suggests using their systems to offer guests build-your-own Mimosas, as well as promoting self-serve as an enhancement to brunch.

Addressing the top-performing wines for iPourIt systems, the top five overall in descending order are:

  1. Boca Barrel Boca Frizzante
  2. Starborough Sauvignon Blanc
  3. Carletto Prosecco (up two spots)
  4. Stemmari Pinot Grigio
  5. Archer Roose Bubbly

Boca Frizzante is a “Prosecco-style” white wine sparkler. Archer Roose Bubbly is also a Prosecco-style white. An actual Prosecco climbed the top 10 to reach spot number three. Essentially, three Proseccos are among the top five most-poured wine products for iPourIt patrons.

Interestingly, the top five are all white wines. In fact, there are only two reds among the top ten, both of them Cabernet Sauvignons.

Image: Josh Olalde on Unsplash

by David Klemt David Klemt No Comments

Datassential Identifies Top Design Trends

Datassential Identifies Top Design Trends

by David Klemt

Maximalist interior bar or restaurant design

For their latest FoodBytes research topic, Datassential tackles some of the top restaurant design trends.

Click here to download Datassential’s “Foodbytes: Restaurant Design Trends” report. If you haven’t already, you’ll need to sign up for FoodBytes reports.

As the title states, this Datassential resource addresses the state of restaurant design. Now, we recommend reading the report for yourself but below you’ll find the points that really stand out to us.

If you’re among the 22 percent of operators that Datassential says are either considering a dining room redesign or have completed one, this report is particularly relevant to you.

Back-0f-house Design

Unsurprisingly, most people envision the interior dining area when considering restaurant design. However, as Lauren Charbonneau of Reitano Design Group says in Datassential’s latest FoodBytes, “Restaurants are living spaces that need to be agile.”

That means considering the entire space, not just the front of house. There’s also this stat from Datassential: 64 percent of operators think shrinking their footprint would be detrimental. If that’s the case, making the BoH smaller rather than the front may be the way forward.

So, let’s take a look at what Charbonneau identifies as BoH design trends to consider.

Clearly, it’s crucial operators consider their back-of-house teams. Providing a better workplace experience and improving efficiency can be done through design. Per Charbonneau, operators can use clever design and equipment choices to reduce steps, movement, labor, footprint, and costs.

Additionally, sustainability is not only crucial to responsible operation, being sustainable can reduce costs. Selecting Energy Star, Water Sense, and multi-functional equipment can make tasks easier for BoH teams, make a business more sustainable, and, again, drive down costs.

Maximalist Design

Finally, it seems, the minimalist design trend is losing its stranglehold on restaurant design. Of course, if that approach and design language works for a particular concept, it works.

However, maximalism is growing in popularity. For this type of design, think lots of color and bold patterns. Then, think about using multiple patterns and textures, including on the floors.

So, wallpaper, artwork, plush seating, loud tiles… Per Datassential, maximalism appeals to younger guests. In part, this is because these spaces can offer so many Instagrammable moments.

Monochrome Design

Okay, before we begin, “monochrome” doesn’t only mean a black-and-white palette. While that can work very well depending on the concept, monochrome also means using different tones of a single color.

Of course, there are multiple ways to approach this design trend. For example, if one does want to select a black-and-white scheme, Matte Black Coffee in Los Angeles is compelling.

Not only is the design monochrome, guests feel as though they’re inside a two-dimensional image. Per Datassential, this type of design is growing in popularity across the US specifically.

In terms of colorful monochrome, a great example is NYC’s Pietro Nolita. Not only have they chosen pink for their palette, it’s a core element of their branding: Pink AF.

Yet another way to approach this trend is for operators to use varying tones of particular colors to delineate different spaces. So, the dining room may be tones of pink while the bar is green and a private dining room is blue.

Nostalgic Design

As we’re all well aware, the pandemic derailed people’s plans. In particular, people hit the pause or cancel button on travel and vacations. Now, people appear to restarting their travel plans and getting back out there.

However, we’re also dealing with inflation. So, many people are holding off on spending money on travel. This is where restaurant design comes into play.

According to Datassential, “nostalgic escape” is a trend to watch moving forward. While very specific, this trend combines a dive into the past and capturing vacation vibes.

Per their FoodBytes report, Datassential identifies the following elements as key to this design approach:

  • Soft shades of colors. In particular, pink.
  • Tropical designs.
  • Fifties, Eighties, and Nineties design elements.

One concept that leverages this trend and did so before the pandemic is the Hampton Social. Currently, there are eight locations and two more are on the way.

Of course, it’s imperative that operators commit only to design language that’s authentic to their concepts. Pursuing a trend simply to pursue it is a clear path to disaster. That said, these design trends have massive appeal and can work for many operators and their brands.

Image: Davide Castaldo on Unsplash

Top